South America Pet Treats Market Size and Share
Market Overview
| Study Period | 2018 - 2031 |
|---|---|
| Forecast Data Period | 2026 - 2031 |
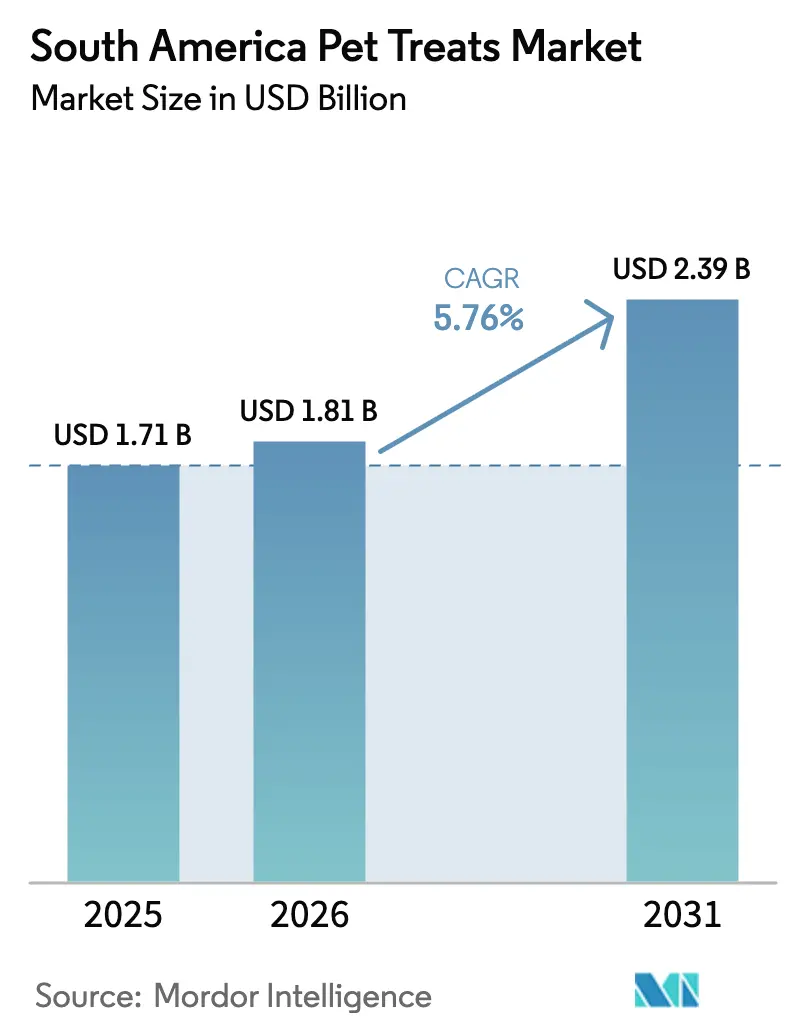
| Base Year Market Size (2025) | USD 1.71 Billion |
| Market Size (2026) | USD 1.81 Billion |
| Market Size (2031) | USD 2.39 Billion |
| Growth Rate (2026 - 2031) | 5.76% CAGR |
| Market Concentration | Low |
Major Players
*Disclaimer: Major Players sorted in no particular order Image © Mordor Intelligence. Reuse requires attribution under CC BY 4.0. |
|
South America Pet Treats Market Analysis by Mordor Intelligence
South American pet treats market size in 2026 is estimated at USD 1.81 billion, growing from 2025 value of USD 1.71 billion with 2031 projections showing USD 2.39 billion, growing at 5.76% CAGR over 2026-2031. Robust pet-humanization, premium product adoption, and swift digital channel adoption sustain strong revenue momentum despite high tax burdens in Brazil. Dental and functional lines set the pace for premiumization, while freeze-dried and jerky items gain share through protein-rich positioning. Global majors compete with nimble regional specialists, all of whom leverage abundant local animal-protein by-products to balance margin pressure from volatile grain inputs. E-commerce growth is most pronounced in Brazil, Argentina, and Chile, where improved last-mile networks and subscription models have raised the average purchase frequency. With pet parents buying treats three to four times a month, producers that align brand stories with emotional bonding and health assurance secure lasting demand.
Key Report Takeaways
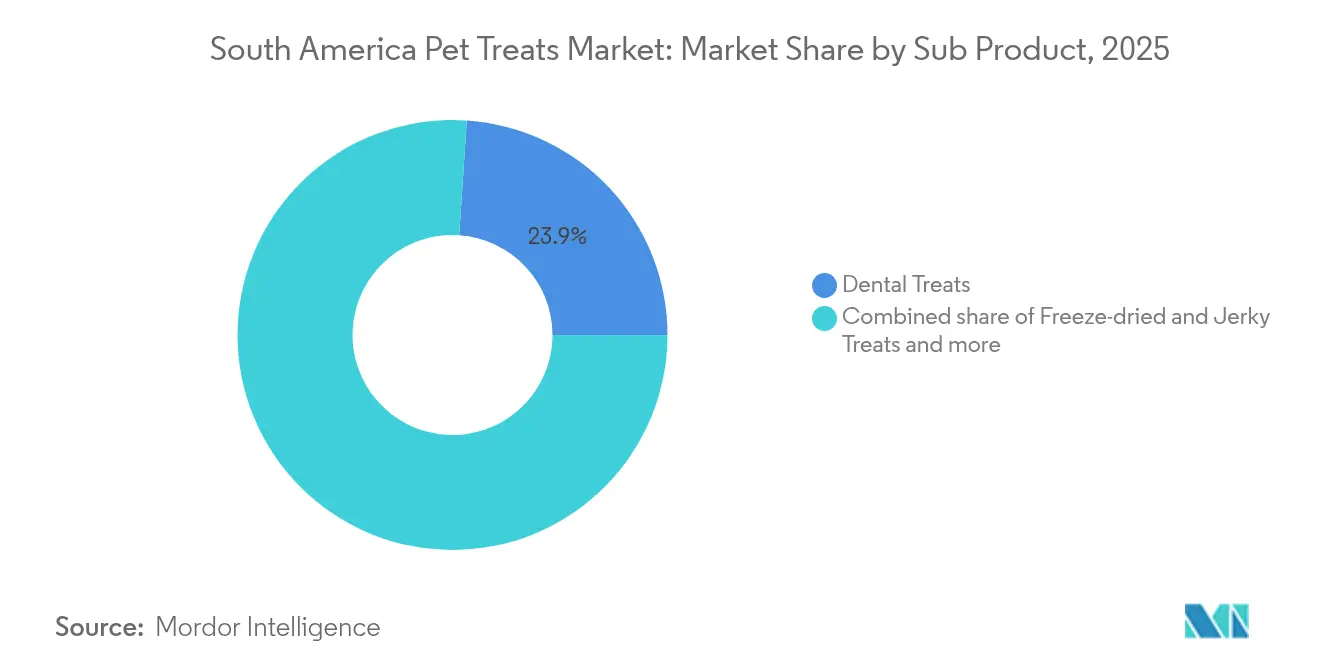
- By sub-product, dental treats led the South America pet treats market with a 23.94% revenue share in 2025; freeze-dried and jerky treats are projected to expand at a 6.72% CAGR through 2031.
- By pet type, dogs accounted for 64.85% of the South America pet treats market share in 2025, while cat treats are projected to advance at an 7.82% CAGR to 2031.
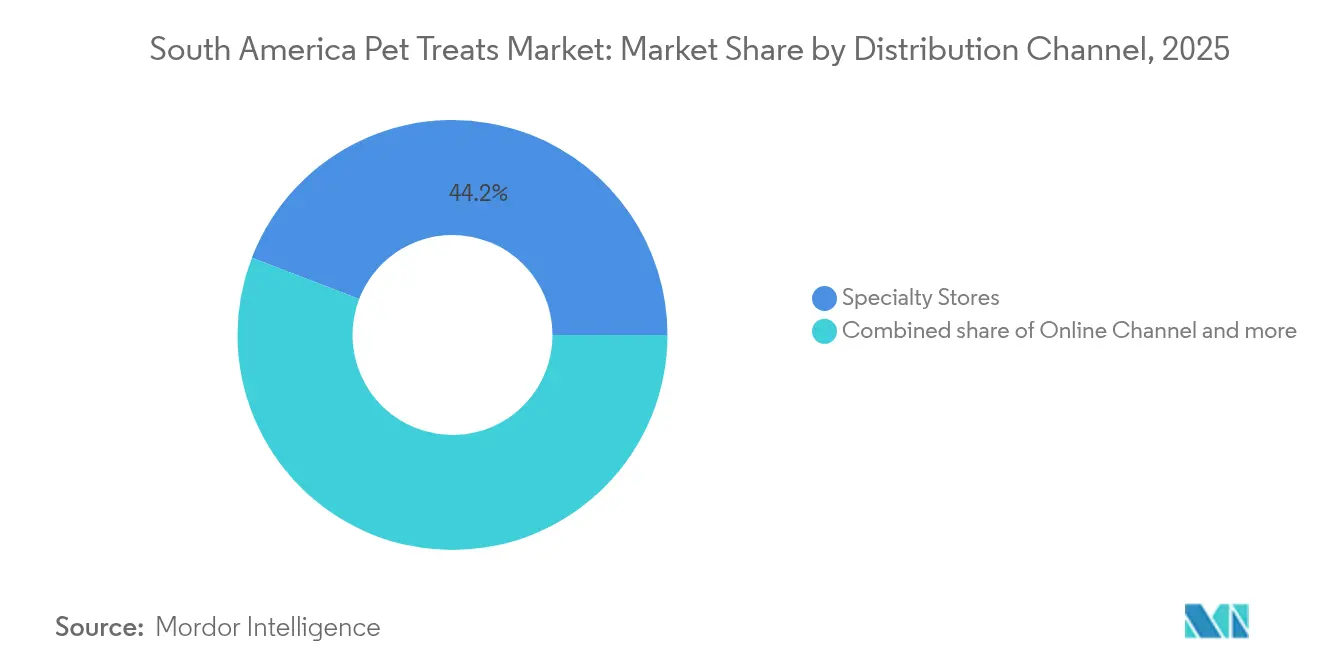
- By distribution channel, specialty stores held 44.15% of the South America pet treats market in 2025; online channels are growing fastest at a 6.43% CAGR.
- By geography, Brazil commanded 74.05% of the South America pet treats market size in 2025, whereas Argentina is set to grow at a 6.28% CAGR through 2031.
Note: Market size and forecast figures in this report are generated using Mordor Intelligence’s proprietary estimation framework, updated with the latest available data and insights as of 2026.
South America Pet Treats Market Trends and Insights
Drivers Impact Analysis*
| Driver | (~) % Impact on CAGR Forecast | Geographic Relevance | Impact Timeline |
|---|---|---|---|
| Pet-humanization and "pet-parent" culture boom | +1.2% | Brazil (São Paulo, Rio de Janeiro), Argentina (Buenos Aires), Chile (Santiago) | Medium term (2-4 years) |
| Rapid premiumization of treat formats | +0.9% | Urban centers across Brazil, Argentina, Colombia | Medium term (2-4 years) |
| Expansion of omnichannel (e-commerce + last-mile delivery) | +0.8% | Major metropolitan areas with digital infrastructure | Short term (≤ 2 years) |
| Functional and nutraceutical treats gaining vet endorsement | +0.7% | Brazil and Argentina leading, expanding to Chile and Peru | Long term (≥ 4 years) |
| Availability of low-cost local animal-protein by-products | +0.5% | Brazil (beef), Argentina (beef), Chile (salmon), Peru (fish) | Long term (≥ 4 years) |
| Government tax reforms under discussion in Brazil and Argentina | +0.4% | Brazil and Argentina specifically | Long term (≥ 4 years) |
| Source: Mordor Intelligence | |||
Pet-humanization and “Pet-parent” Culture Boom
A fundamental shift toward treating pets as family members is reshaping purchasing decisions across South America's urban centers, where pet owners are increasingly prioritizing emotional satisfaction over price sensitivity. This cultural transformation is evident in the adoption rates of premium treats exceeding 40% in São Paulo and Buenos Aires, as consumers seek products that meet human food quality standards. Mars' Pedigree Dentastix leveraged this trend by positioning dental chews as "daily care rituals," resulting in clinical evidence showing an 80% reduction in tartar when used as directed[1]Source: Tim Wall, “Key to Success for the Brazilian Pet Food Industry,” PetfoodIndustry, petfoodindustry.com. Continual social media sharing of pet lifestyle moments reinforces the link between indulgence and companionship, propelling the South America pet treats market.
Rapid Premiumization of Treat Formats
Organic, grain-free, and artisanal recipes command two- to three-fold price premiums yet attract middle- and upper-income households. Sixty-four percent of Brazilian pet owners read labels, prompting brands to emphasize local proteins, sustainable sourcing, and transparent ingredient lists. Local manufacturers, such as BRF's Affinity division, have capitalized on this shift by introducing locally sourced premium lines that emphasize regional protein sources and traditional preparation methods. The trend's sustainability stems from its correlation with higher disposable incomes in metropolitan areas, where premium treat penetration reaches 35-45% compared to 15-20% in secondary cities. This geographic concentration enables targeted distribution strategies through specialty retailers and veterinary channels, reinforcing premium positioning.[2]Source: ECDB, "Pet Supplies eCommerce Market in Brazil - Data, Trends, Top Stores, ecommercedb.com.
Expansion of Omnichannel (E-commerce + Last-mile Delivery)
Digital commerce transformation accelerated dramatically. Mercado Libre's dominance across eight South American countries provides manufacturers with unified access to registered users, while platform improvements in payment processing and delivery infrastructure reduce traditional e-commerce friction points. The omnichannel evolution enables subscription models and personalized recommendations that increase customer lifetime value, with Petz reporting that 40% of sales are generated through digital channels and that same-day delivery is available in major metropolitan areas. Last-mile delivery partnerships with local logistics providers create competitive moats for established players while lowering entry barriers for niche premium brands.
Functional and Nutraceutical Treats Gaining Veterinary Endorsement
Veterinary channel endorsement is legitimizing functional treat categories that address specific health concerns, transforming treats from indulgent purchases to investments in preventive care. Virbac's dental chews exemplify this trend, securing veterinary recommendations through clinical efficacy data while commanding premium pricing justified by health benefits rather than taste alone. The functional treats segment benefits from regulatory clarity under MAPA guidelines, which distinguish between therapeutic and conventional products, enabling manufacturers to make specific health claims when supported by clinical evidence.
Restraints Impact Analysis*
| Restraint | (~) % Impact on CAGR Forecast | Geographic Relevance | Impact Timeline |
|---|---|---|---|
| High cumulative tax burden on pet products | -0.8% | Brazil (highest impact), Argentina, Colombia | Long term (≥ 4 years) |
| Regulatory fragmentation across South-American countries | -0.5% | All countries with varying import/export requirements | Medium term (2-4 years) |
| Raw-material price volatility | -0.6% | Import-dependent countries (Chile, Peru, Ecuador) | Short term (≤ 2 years) |
| Low consumer awareness of obesity-linked over-treating | -0.3% | Lower-income segments across all countries | Long term (≥ 4 years) |
| Source: Mordor Intelligence | |||
High Cumulative Tax Burden on Pet Products
Brazil's 51% cumulative tax burden on pet products creates significant affordability barriers that limit market penetration among price-sensitive consumer segments, particularly affecting middle and lower-income households where pet ownership is growing fastest[3] Source: Bulthez, Ewa. "The pet sector in Brazil." Flanders Investment & Trade", export.flandersinvestmentandtrade.com. This burden disproportionately impacts premium treat categories where higher absolute prices amplify the tax effect, potentially constraining premiumization trends that drive market value growth. The recent tax reform's exclusion of pet products from VAT reductions signals continued policy challenges for industry growth, as government priorities focus on essential human consumption items. Manufacturers respond through local production strategies and value engineering, but fundamental affordability constraints persist across key demographic segments.
Regulatory Fragmentation Across South-American Countries
Divergent regulatory frameworks across South American countries create compliance complexity and cost burdens that inhibit cross-border trade and regional market integration. These regulatory differences compel manufacturers to maintain country-specific formulations, packaging, and marketing materials, thereby increasing operational complexity and reducing the efficiency gains from regional market strategies. Import/export procedures vary significantly, with Peru requiring specific documentation for animal-origin ingredients while Colombia maintains different labeling standards for nutritional claims. The fragmentation particularly affects smaller manufacturers who lack resources to navigate multiple regulatory systems, potentially limiting competitive dynamics and innovation diffusion across the region.
*Our forecasts treat driver/restraint impacts as directional, not additive. The impact forecasts reflect baseline growth, mix effects, and variable interactions.
Segment Analysis
Segment 1
Dental treats accounted for 23.94% of the South America pet treats market size in 2025, driven by clinical efficacy claims and daily-care usage patterns endorsed by veterinarians. The freeze-dried and jerky cluster is the fastest riser at a 6.72% CAGR, highlighting the premium, protein-forward appeal that aligns with owner expectations for minimally processed nutrition. Crunchy, soft, and chewy segments remain affordable indulgence options, yet innovation in texture and functional additives keeps them relevant. The South America pet treats market benefits as local processors leverage beef, poultry, and salmon by-products to formulate cost-effective protein snacks without sacrificing premium cues.
Freeze-drying retains nutrient density and clean labels, aligning with consumer expectations that apply human nutritional standards to pets. Meanwhile, dental formats evolve with multi-layer textures and enzymatic coatings that mechanically and biochemically reduce plaque, thereby extending ownership of the high-value oral care niche. Brands that validate claims and secure MAPA functional status position themselves to capture a larger slice of premium-tier spending.


By Pets: Dogs Dominate While Cats Accelerate
Dogs consumed 64.85% of treats sold in 2025, reflecting larger body sizes and established training habits among pet owners in South America. Yet, the 7.82% CAGR for cat treats signals a structural shift toward apartment-friendly companions in densely populated urban centers. Cat owners are willing to pay higher unit prices for taurine-reinforced and omega-3-rich snacks, thereby widening premium margins. The South America pet treats market thus diversifies, with canine lines focusing on joint and digestive support while feline SKUs emphasize hairball control and sensory-driven textures.
Rising millennial adoption of cats aligns with flexible lifestyles and smaller living spaces in São Paulo and Santiago. Marketing that mirrors human snacking occasions, mid-day bites, late-night rewards—creates new consumption moments and lifts average spend. Brands that map texture and flavor to feline sensory preferences will capitalize on the rapid cat-treat growth curve threaded through the overall South America pet treats market.
By Distribution Channel: Specialty Stores Face Digital Disruption
Specialty outlets held 44.15% share of the South America pet treats market in 2025, supported by stores offering curated assortments and expert advice. Yet, online platforms are expanding at a 6.43% CAGR as consumers increasingly embrace doorstep convenience and the value of subscriptions. Multichannel leaders utilize data to personalize recommendations, increase basket sizes, and prevent churn. Supermarkets remain vital for price-sensitive shoppers, while veterinary clinics retain authority for functional SKUs.
Digital innovation lowers entry barriers for niche premium labels, but scale players defend share through exclusive bundles and loyalty perks. The South America pet treats market thus rewards brands that blend physical presence with digital intimacy, ensuring inventory availability and fast fulfillment without diluting premium positioning.
Geography Analysis
Brazil contributed 74.05% of the South America pet treats market in 2025, driven by pet-owning households and a mature retail and veterinary ecosystem. São Paulo’s affluence supports the deepest penetration of premium dental products, while Rio de Janeiro shows a rising adoption of functional dental lines. Local manufacturers leverage abundant poultry and beef by-products to offset grain cost spikes, stabilizing margins even under Brazil’s tax load. Continued economic growth and tax-relief lobbying will dictate the breadth of premium adoption.
Argentina is the fastest-growing geography, advancing at a 6.28% CAGR as currency stabilization rebuilds consumer confidence. Buenos Aires and Córdoba households exhibit a heightened demand for high-protein treats that feature national beef heritage. Improved digital infrastructure and Mercadolibre’s strong footprint make e-commerce a cost-effective entry channel for global and regional brands targeting the South America pet treats market.
The rest of South America, including Chile, Peru, Colombia, and neighboring markets, collectively offers an emerging growth path. Chile’s high GDP per capita favors premium imports, while Peru and Colombia post double-digit e-commerce gains anchored in youthful demographics and rising pet humanization. Regulatory harmonization under Pacific Alliance dialogues could reduce approval duplication, enhancing speed to market for innovative functional SKUs and widening the addressable base in the South America pet treats market.
Competitive Landscape
Mars, Incorporated, Nestlé (Purina), Empresas Carozzi SA, PremieRpet, and Hill’s Pet Nutrition collectively captured a minor share of the revenue in 2024, underscoring a relatively low market share. The South America pet treats market exhibits low concentration, with an estimated Herfindahl-Hirschman Index of approximately 2,200. Global leaders Mars and Nestlé compete alongside regional specialists, such as Empresas Carozzi, through differentiated positioning strategies that emphasize local sourcing, premium formulations, and veterinary channel partnerships.
Mars leverages its Pedigree brand equity and clinical research capabilities to maintain leadership in dental treats, while Nestlé's Purina division focuses on premium positioning and omnichannel distribution through partnerships with major retailers like Petz and Cobasi. Regional players capitalize on local protein sourcing advantages and cultural preferences, with BRF's Affinity division demonstrating successful premium positioning through locally-sourced ingredients and traditional preparation methods that resonate with Brazilian consumers.
Technology adoption patterns favor companies that invest in e-commerce capabilities, subscription models, and direct-to-consumer strategies, which bypass traditional retail margins while providing customer data and control over relationships. Emerging disruptors include specialized premium brands that leverage social media marketing and influencer partnerships to build brand awareness among younger demographics, while established players respond through acquisition strategies and innovation investments in functional ingredients and sustainable packaging solutions that align with evolving consumer preferences.
South America Pet Treats Industry Leaders
-
Empresas Carozzi SA
-
Mars Incorporated
-
Nestle (Purina)
-
PremieRpet
-
Hill's Pet Nutrition (Colgate-Palmolive Co.)
- *Disclaimer: Major Players sorted in no particular order

Recent Industry Developments
- May 2025: Adimax opened three new manufacturing facilities in Paraná, Brazil, with a total investment of R$140 million (approximately USD 24.8 million) to expand its production capacity for pet food and treats. The expansion features advanced extrusion technology and automated packaging systems, designed to meet the growing domestic demand and capitalize on export opportunities across South America.
- May 2023: Nestle Purina launched new cat treats under the Friskies "Friskies Playfuls - treats" brand. These treats are round in shape and are available in chicken and liver and salmon and shrimp flavors for adult cats.
- March 2023: PremieRpet launched a line of superpremium, "Protein-packed" meal toppers/treats for dogs and cats under the brand Natoo. These are produced at PremieRpet's facility in Brazil.


South America Pet Treats Market Report Scope
Crunchy Treats, Dental Treats, Freeze-dried and Jerky Treats, Soft & Chewy Treats are covered as segments by Sub Product. Cats, Dogs are covered as segments by Pets. Convenience Stores, Online Channel, Specialty Stores, Supermarkets/Hypermarkets are covered as segments by Distribution Channel. Argentina, Brazil are covered as segments by Country.| Dental Treats |
| Crunchy Treats |
| Soft and Chewy Treats |
| Freeze-dried and Jerky Treats |
| Other Treats |
| Cats |
| Dogs |
| Other Pets |
| Convenience Stores |
| Online Channel |
| Specialty Stores |
| Supermarkets/Hypermarkets |
| Other Channels |
| Brazil |
| Argentina |
| Rest of South America |
| Sub Product | Dental Treats |
| Crunchy Treats | |
| Soft and Chewy Treats | |
| Freeze-dried and Jerky Treats | |
| Other Treats | |
| Pets | Cats |
| Dogs | |
| Other Pets | |
| Distribution Channel | Convenience Stores |
| Online Channel | |
| Specialty Stores | |
| Supermarkets/Hypermarkets | |
| Other Channels | |
| Geography | Brazil |
| Argentina | |
| Rest of South America |


Market Definition
- FUNCTIONS - Pet foods are usually intended to provide complete and balanced nutrition to the pet but are primarily used as functional products. The scope includes the food and supplements consumed by pets including veterinary diets. Supplements/nutraceuticals that are directly supplied to pets are considered within the scope.
- RESELLERS - Companies engaged in reselling of pet food without value addition have been excluded from the market scope, in order to avoid double counting.
- END CONSUMERS - Pet owners are considered to be the end-consumers in the market studied.
- DISTRIBUTION CHANNELS - Supermarkets/hypermarkets, specialty stores, convenience stores, online channels and other channels are considered within the scope. The stores which are exclusively providing pet related basic and custom products are considered within the scope of specialty stores.
| Keyword | Definition |
|---|---|
| Pet Food | The scope of pet food includes the food that is eatable by pets including food, treats, veterinary diets, and nutraceuticals/supplements. |
| Food | Food is animal feed intended for consumption by pets. It is formulated to provide essential nutrients and meet the dietary needs of various types of pets, including dogs, cats, and other animals. These are generally segmented into dry and wet pet foods. |
| Dry Pet Food | Dry pet foods may be extruded/baked (kibbles) or flaked. They have a lower moisture content, typically around 12-20%. |
| Wet Pet Food | Wet pet food, also known as canned pet food or moist pet food, generally has a higher moisture content compared to dry pet food, often ranging from 70-80%. |
| Kibbles | Kibbles are dry, processed pet food in small, bite-sized pieces or pellets. They are specifically formulated to provide balanced nutrition for various domestic animals, such as dogs, cats, and other animals. |
| Treats | Pet Treats are special food items or rewards given to pets, to show affection, and encourage good behavior. They are especially used during training. Pet treats are made from various combinations of meat or meat-derived materials with other ingredients. |
| Dental Treats | Pet dental treats are specialized treats that are formulated to promote good oral hygiene in pets. |
| Crunchy Treats | It is a type of pet treat that has a firm and crispy texture which can be a good source of nutrition for pets. |
| Soft and chewy treats | Soft and Chewy pet treats are a type of pet food product that is formulated to be easy to chewy and digest. They are usually made from soft and pliable ingredients, such as meat, poultry, or vegetables, that have been blended and formed into bite-sized pieces or strips. |
| Freeze-dried & Jerky Treats | Freeze-dried and jerky treats are snacks given to pets, that are prepared through a special preservation process, without damaging the nutritional content, resulting in long-lasting, nutrient-rich treats. |
| Urinary Tract Disease Diets | These are commercial diets that are specifically formulated to promote urinary health and reduce the risk of urinary tract infections and other urinary problems. |
| Renal Diets | These are specialized pet foods formulated to support the health of pets with kidney disease or renal insufficiency. |
| Digestive Sensitivity Diets | Digestive-sensitive diets are specially formulated to meet the nutritional needs of pets with digestive issues such as food intolerances, allergies, and sensitivities. These diets are designed to be easily digestible and to reduce the symptoms of digestive problems in pets. |
| Oral Care Diets | Oral care diets for pets are specially formulated diets produced to promote oral health and hygiene in pets. |
| Grain-Free Pet Food | Pet food that does not contain common grains like wheat, corn, or soy. Grain-free diets are often preferred by pet owners seeking alternative options or if their pets have specific dietary sensitivities. |
| Premium Pet Food | High-quality pet food formulated with superior ingredients often offers additional nutritional benefits compared to standard pet food. |
| Natural Pet Food | Pet food made from natural ingredients, with minimal processing and without artificial preservatives. |
| Organic Pet Food | Pet food is produced using organic ingredients, free from synthetic pesticides, hormones, and genetically modified organisms (GMOs). |
| Extrusion | A manufacturing process used to produce dry pet food, where ingredients are cooked, mixed, and shaped under high pressure and temperature. |
| Other Pets | Other pets include birds, fish, rabbits, hamsters, ferrets, and reptiles. |
| Palatability | The taste, texture, and aroma of pet food influence its appeal and acceptance by pets. |
| Complete and Balanced Pet Food | Pet food that provides all essential nutrients in appropriate proportions to meet the nutritional needs of pets without additional supplementation. |
| Preservatives | These are the substances that are added to pet food to extend its shelf life and prevent spoilage. |
| Nutraceuticals | Food products that offer health benefits beyond basic nutrition, often contain bioactive compounds with potential therapeutic effects. |
| Probiotics | Live beneficial bacteria that promote a healthy balance of gut flora, supporting digestive health and immune function in pets. |
| Antioxidants | Compounds that help neutralize harmful free radicals in the body, promoting cellular health and supporting the immune system in pets. |
| Shelf-Life | The duration of which pet food remains safe and nutritionally viable for consumption after its production date. |
| Prescription diet | Specialized pet food formulated to address specific medical conditions under veterinary supervision. |
| Allergen | A substance that can cause allergic reactions in some pets, leading to food allergies or sensitivities. |
| Canned food | Wet pet food that is packed in cans and contains higher moisture content than dry food. |
| Limited ingredient diet (LID) | Pet food formulated with a reduced number of ingredients to minimize potential allergens. |
| Guaranteed Analysis | The minimum or maximum levels of certain nutrients present in pet food. |
| Weight management | Pet food designed to help pets maintain a healthy weight or support weight loss efforts. |
| Other Nutraceuticals | It includes prebiotics, antioxidants, digestive fiber, enzymes, essential oils and herbs. |
| Other Veterinary Diets | It includes weight management diets, skin and coat health, cardiac care, and joint care. |
| Other Treats | It includes rawhides, mineral blocks, lickables, and catnips. |
| Other Dry Foods | It includes cereal flakes, mixers, meal toppers, freeze-dried foods, and air-dried foods. |
| Other Animals | It includes birds, fish, reptiles, and small animals (rabbits, ferrets, hamsters). |
| Other Distribution Channels | It includes veterinary clinics, local unregulated stores, and feed and farm stores. |
| Proteins and Peptides | Proteins are large molecules composed of basic units called amino acids which help in the growth and development of pets. Peptides are the short string of 2 to 50 amino acids. |
| Omega-3 fatty acids | Omega-3 fatty acids are essential polyunsaturated fats that play a crucial role in the overall health and well-being of Pets |
| Vitamins | Vitamins are the essential organic compounds that are essential for vital physiological functioning. |
| Minerals | Minerals are naturally occurring inorganic substances that are essential for various physiological functions in pets. |
| CKD | Chronic Kidney Disease |
| DHA | Docosahexaenoic Acid |
| EPA | Eicosapentaenoic Acid |
| ALA | Alpha-linolenic Acid |
| BHA | Butylated Hydroxyanisol |
| BHT | Butylated Hydroxytoluene |
| FLUTD | Feline Lower Urinary Tract Disease |


Research Methodology
Mordor Intelligence follows a four-step methodology in all our reports.
- Step-1: IDENTIFY KEY VARIABLES: In order to build a robust forecasting methodology, the variables and factors identified in Step-1 are tested against available historical market numbers. Through an iterative process, the variables required for market forecast are set and the model is built on the basis of these variables.
- Step-2: Build a Market Model: Market-size estimations for the forecast years are in nominal terms. Inflation is not a part of the pricing, and the average selling price (ASP) is kept constant throughout the forecast period.
- Step-3: Validate and Finalize: In this important step, all market numbers, variables and analyst calls are validated through an extensive network of primary research experts from the market studied. The respondents are selected across levels and functions to generate a holistic picture of the market studied.
- Step-4: Research Outputs: Syndicated Reports, Custom Consulting Assignments, Databases & Subscription Platforms


