Market Overview
| Study Period | 2020 - 2031 |
|---|---|
| Forecast Data Period | 2026 - 2031 |
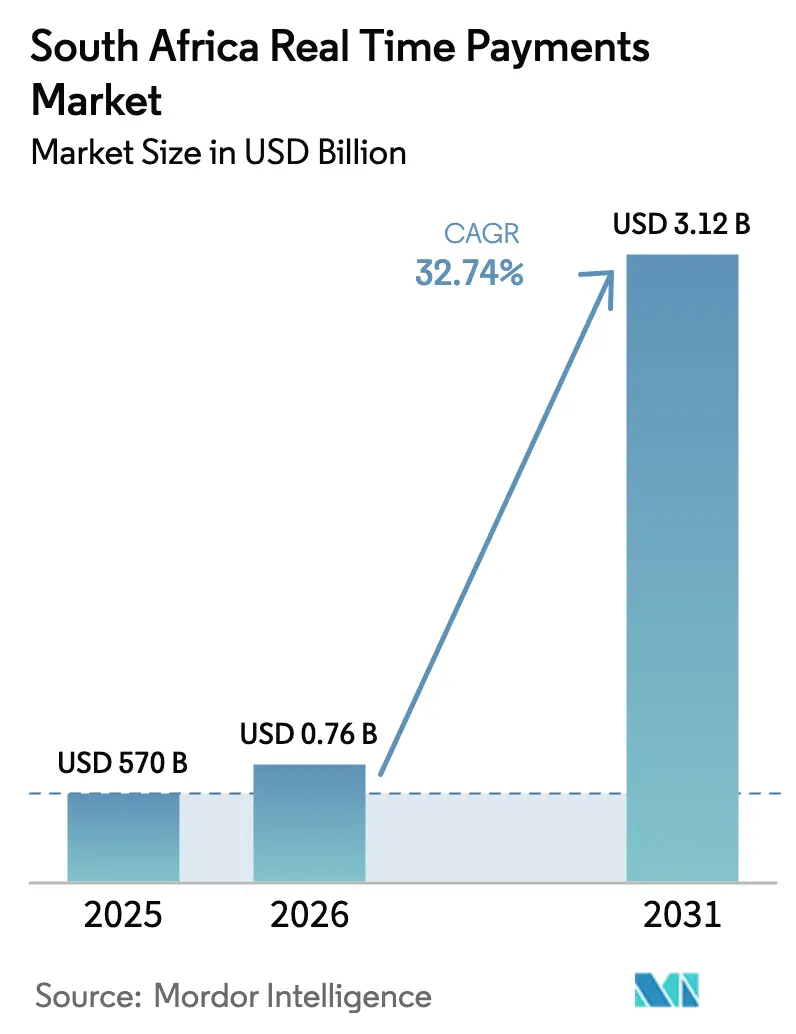
| Base Year Market Size (2025) | USD 570 Billion |
| Market Size (2026) | USD 0.76 Billion |
| Market Size (2031) | USD 3.12 Billion |
| Growth Rate (2026 - 2031) | 32.74% CAGR |
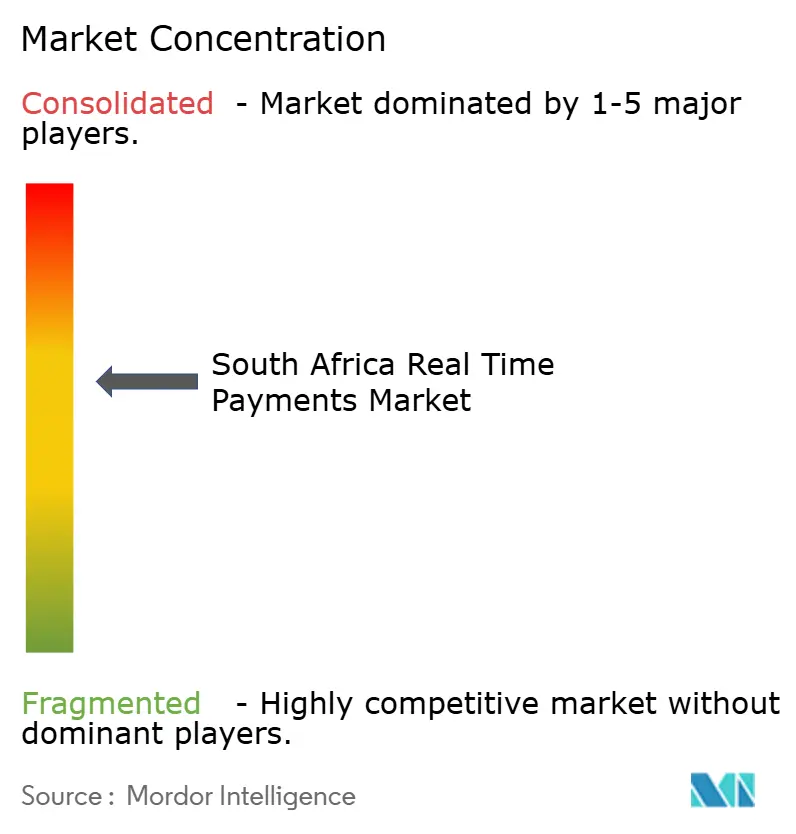
| Market Concentration | Medium |
Major Players *Disclaimer: Major Players sorted in no particular order Image © Mordor Intelligence. Reuse requires attribution under CC BY 4.0. | |
South Africa Real Time Payments Market Analysis by Mordor Intelligence
The South Africa real time payments market size is expected to grow from USD 570 million in 2025 to USD 756.6 million in 2026 and is forecast to reach USD 3.12 billion by 2031 at 32.74% CAGR over 2026-2031. Rapid scale-up is supported by the South African Reserve Bank’s PayShap rail, a sharp drop in mobile-data prices, and a national pivot toward digital commerce. Heavy fintech funding, topping USD 100 million during 2024-2025, accelerates product innovation while cloud migration reshapes bank cost structures.[1]National Treasury, “Budget Review 2024,” treasury.gov.za Competitive intensity remains moderate as incumbents Standard Bank, FNB, Nedbank, and Absa jostle with rising fintechs such as Stitch and Ozow. Still, structural frictions—transaction fees of R6-10 per instant payment, legacy cores at tier-2 lenders, and a 15% rise in authorised push-payment fraud—temper the near-term growth trajectory.
Key Report Takeaways
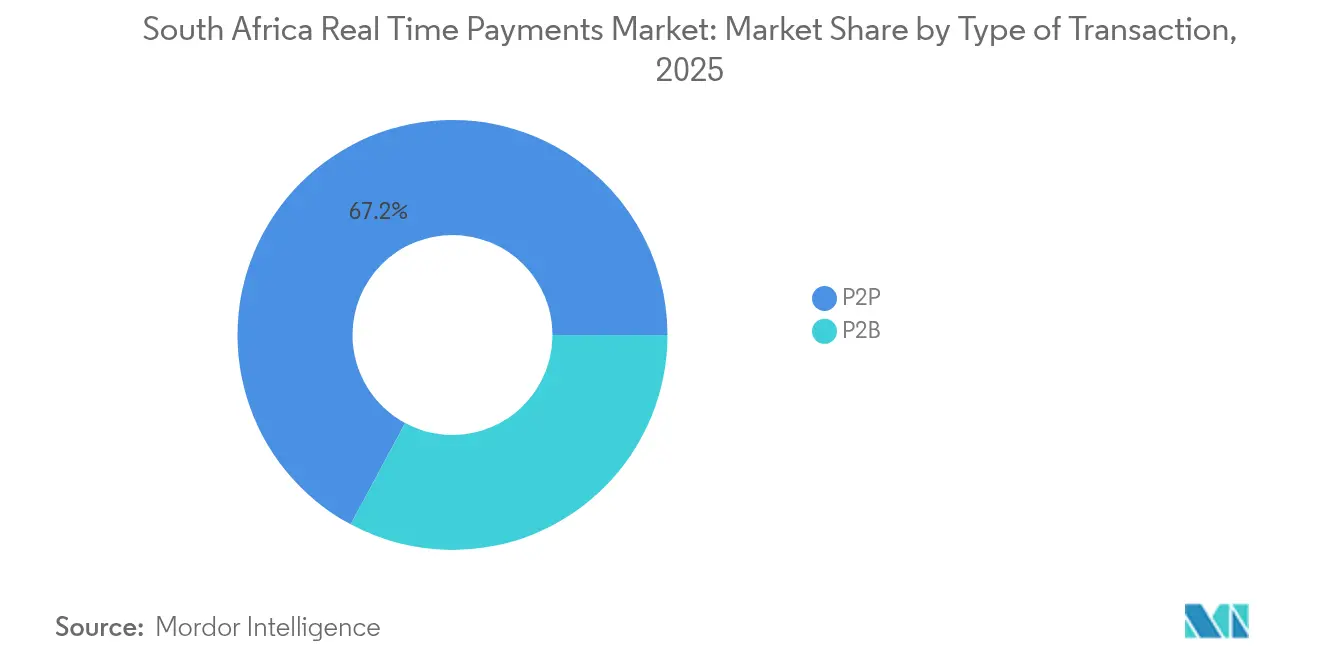
- By type of payment, person-to-person transfers captured 67.15% of South Africa real time payments market share in 2025, while person-to-business flows are projected to compound at 34.38% CAGR through 2031.
- By component, solutions accounted for 79.20% share of the South Africa real time payments market size in 2025; services are set to advance at a 35.70% CAGR to 2031.
- By deployment, on-premises systems held 64.20% share of the South Africa real time payments market size in 2025, whereas cloud models are forecast to grow at 36.10% CAGR.
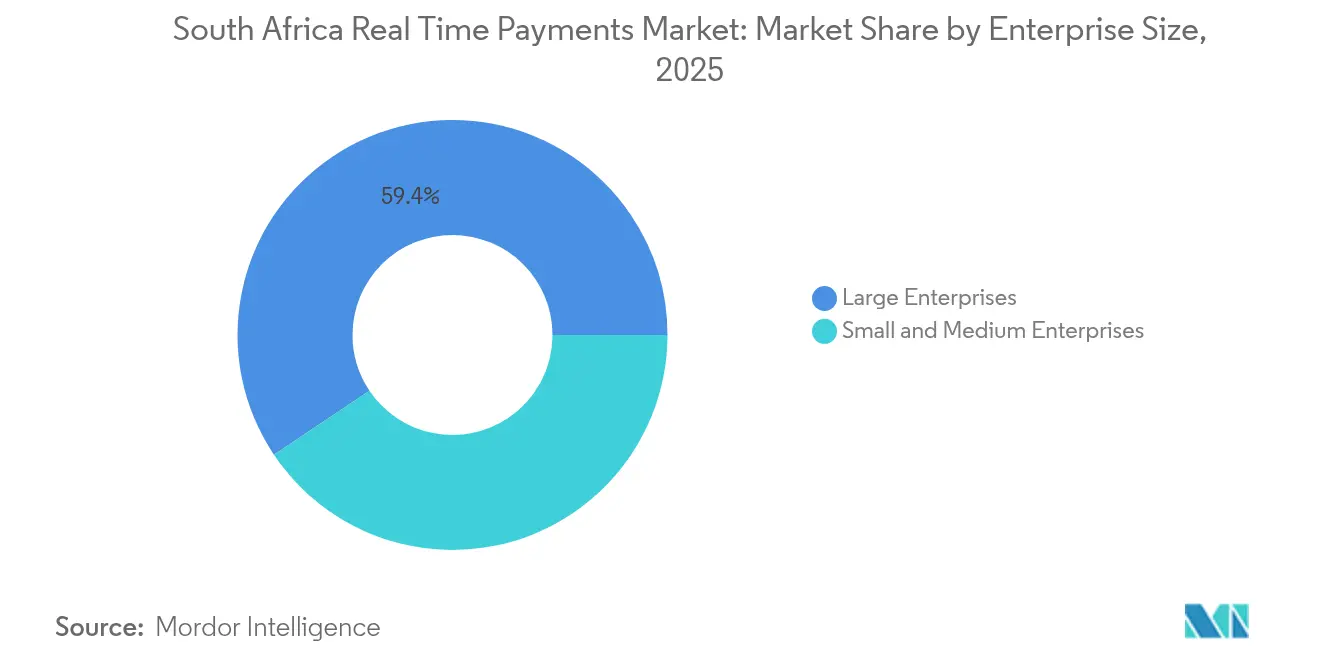
- By enterprise size, large enterprises commanded 59.40% share of the South Africa real time payments market size in 2025, but the SME segment is expanding at 33.10% CAGR.
- By end-user industry, retail and e-commerce led with a 39.30% share of the South Africa real time payments market size in 2025; government and utilities represent the fastest path, rising at 35.60% CAGR.
Note: Market size and forecast figures in this report are generated using Mordor Intelligence’s proprietary estimation framework, updated with the latest available data and insights as of 2026.
South Africa Real Time Payments Market Trends and Insights
Drivers Impact Analysis*
| Driver | (~) % Impact on CAGR Forecast | Geographic Relevance | Impact Timeline |
|---|---|---|---|
| SARB PayShap Launch Accelerating Instant Low-Value Transfers | +8.2% | National, with early gains in Western Cape, Gauteng | Short term (≤ 2 years) |
| Fintech VC Surge Enabling Innovative RTP Front-Ends | +6.1% | Urban centers, expanding to secondary cities | Medium term (2-4 years) |
| Declining Mobile-Data Costs Expanding Smartphone-Based RTP | +4.8% | National, with higher impact in rural provinces | Long term (≥ 4 years) |
| Township e-Commerce Sellers Demanding Immediate Settlement | +3.9% | Gauteng, Western Cape, KwaZulu-Natal townships | Medium term (2-4 years) |
| On-Demand Payroll and Gig-Economy Disbursements | +3.2% | Major metropolitan areas | Short term (≤ 2 years) |
| Open-Banking Mandates Under COFI Bill Fueling API-Driven RTP | +2.8% | National, phased implementation | Long term (≥ 4 years) |
| Source: Mordor Intelligence | |||
SARB PayShap Launch Accelerating Instant Low-Value Transfers
PayShap processed 74.2 million transactions worth R46 billion by October 2024, proving that a simplified alias-based design can motivate mainstream adoption.[2]Standard Bank, “PayShap Adoption Update,” standardbank.co.za Average ticket sizes have slid to R498 (USD 28.04), signalling deep penetration into micro-payments once dominated by cash. Transfers below R100 (USD 5.63) remain free, encouraging price-sensitive users to accept the service for daily purchases.[3]Nedbank, “Digital Fees Disclosure 2024,” nedbank.co.za With Capitec and Discovery Bank now live, national coverage is broadening. Rising competitive pressure has pushed major banks to trim instant-payment fees, narrowing the cost gap with batch EFT alternatives. PayShap’s small-business rollout, slated for late-2024, could redirect R2.1 trillion (USD 0.12 trillion) in MSME turnover onto real-time rails.
Fintech VC Surge Enabling Innovative RTP Front-Ends
South African fintechs clinched record capital in 2024-2025, highlighted by Stitch’s USD 55 million Series B round that unlocked omnichannel payment APIs for retailers such as Takealot and MTN. Smaller startups like Happy Pay raised USD 1.8 million to broaden BNPL options for 150,000 users, evidence of deepening investor confidence. Consolidation is under way: Stitch acquired ExiPay to merge in-person and online acceptance, while Ozow joined forces with EBANX for cross-border reach. Available funding accelerates front-end experimentation—chat-based checkout, QR acceptance, and earned-wage APIs—that plug directly into the South Africa real time payments market backbone.
Declining Mobile-Data Costs Expanding Smartphone-Based RTP
Average data prices fell from USD 12.44 in 2010 to USD 1.77 per GB in 2025, spurring internet reach to 646 million Africans and setting a path to 1.1 billion by 2029. More than 50 million South Africans hold smartphones, enabling secure P2P apps such as Bank Zero which rests on IBM LinuxONE hardware for sub-millisecond latency. Cheaper connectivity also boosts crypto-linked QR payments: Pick n Pay now clears R1 million (USD 0.056 million) in Bitcoin transactions each month across 700 stores. Rural uptake is improving because mobile coverage often precedes bank branches, aligning perfectly with alias-based PayShap IDs. Sustained cost declines underpin long-run expansion of the South Africa real time payments market into peri-urban areas.
Township e-Commerce Sellers Demanding Immediate Settlement
Informal MSMEs generate R5 trillion in annual turnover yet stay largely cash-reliant, delaying scale-up and credit access. The FinScope MSME 2024 survey shows 72% of micro-enterprises operate off the formal grid, making instant, low-fee transfers vital for daily liquidity. Budget 2024 earmarked funds to digitise township payments through Swiss-backed pilots, supporting OECD-aligned financial-inclusion targets. Real-time settlement gives sellers proof-of-payment and inventory cash the same day. That facility also interfaces neatly with courier networks serving “spaza-to-door” commerce models, sharpening township competitiveness with formal supermarkets.
Restraints Impact Analysis*
| Restraint | (~) % Impact on CAGR Forecast | Geographic Relevance | Impact Timeline |
|---|---|---|---|
| High Interchange and Scheme Fees for RTP Rails | -4.3% | National, higher impact on price-sensitive segments | Short term (≤ 2 years) |
| Legacy Core Systems of Tier-2 Banks Slowing Integration | -3.1% | Regional banks, community financial institutions | Medium term (2-4 years) |
| Rising Cyber-Enabled Authorised Push-Payment Fraud | -2.8% | National, concentrated in urban digital payment hubs | Short term (≤ 2 years) |
| Low Financial Literacy in Rural Provinces | -2.2% | Rural provinces: Limpopo, Eastern Cape, Northern Cape | Long term (≥ 4 years) |
| Source: Mordor Intelligence | |||
High Interchange and Scheme Fees for RTP Rails
Major banks charge R6-10 (USD 0.34 to USD 0.56) per Pay-by-Bank transaction versus R1-3 (USD 0.056 to USD 0.17) for standard EFTs, creating sticker shock for mass users. Capitec has broken rank with a R6 (USD 0.34) flat fee, showing how aggressive pricing can capture volume. The disparity drives consumers to split their payment flows: real time for urgent transfers, EFT for routine bills. New CMA rules forcing cross-border remittances onto SWIFT rails raise costs further, dampening adoption in border towns. Unless fees fall quickly, price elasticity could shave several points off the South Africa real time payments market trajectory.
Legacy Core Systems of Tier-2 Banks Slowing Integration
Upgrading a regional bank’s core to ISO 20022-native rails can exceed R50 million (USD 2.82) and require multiyear programmes, a burden many tier-2 lenders cannot carry. Absa’s own overhaul, tied to stringent capital-markets rules such as FRTB, highlights the operational drag and compliance complexity. Standard Bank’s wide-ranging partnership with Volante shows the scale needed to embed real-time at continental level. Smaller banks risk falling behind, producing a dual-speed market where only big players deliver full RTP functionality, constraining inclusive growth.
*Our forecasts treat driver/restraint impacts as directional, not additive. The impact forecasts reflect baseline growth, mix effects, and variable interactions.
Segment Analysis
By Type of Payment: P2B Growth Outpaces P2P Dominance
The P2P segment held 67.15% of total 2025 volume, anchored in family remittances and PayShap’s consumer-first roll-out. Person-to-business flows, however, are climbing faster at 34.38% CAGR, powered by township sellers, ride-hailing payouts, and invoice settlement. Uber alone channels thousands of micro-wage pushes daily, proving the viability of real-time disbursement for service marketplaces. PayShap’s forthcoming SME features will catalyse merchant uptake, shifting share toward business traffic. Informal retail chains and last-mile couriers already queue for beta access, suggesting a migration of working-capital cycles onto the South Africa real time payments market.
The South Africa real time payments market size for person-to-business flows is forecast to widen substantially as MSMEs formalise digital acceptance, cutting cash-handling losses and creating invoice data trails helpful for credit scoring. Meanwhile, the South Africa real time payments market share of P2P will gradually decline, yet volumes will keep growing in absolute terms as remittance activity shifts entirely to alias-based rails. Consumers value the instant confirmation and lower cost compared with cash deposits at branches. Payment providers are adding value-added services—split bills, request-to-pay, and cashback—to defend their P2P franchises.


By Component: Services Segment Accelerates Infrastructure Modernisation
Solutions, including core switches, mobile apps, and API platforms, owned 79.20% of revenue in 2025 due to capital-intensive buildouts. Yet services post a 35.70% CAGR as banks outsource integration, testing, and compliance. Standard Bank’s Volante contract exemplifies end-to-end managed services encompassing ISO 20022 conversion, fraud analytics, and 24/7 uptime monitoring. Financial institutions prefer OpEx-based models that shift cyber-risk and skills shortages to specialist vendors.
The South Africa real time payments market size for services is projected to close the gap with solutions by 2031, fostering annuity revenues for consultancies and cloud SIs. Integration complexity, especially for tier-2 banks with dated cores, ensures sustained demand. Vendors that bundle KYC orchestration, dispute management, and analytic dashboards create lock-in advantages. Conversely, pure-software providers feel margin pressure as open-source projects commoditise basic routing engines.
By Deployment: Cloud Migration Transforms Banking Infrastructure
On-premises deployments controlled 64.20% of 2025 spend, reflecting regulatory caution and sunk hardware assets. Cloud rails, however, compound at 36.10% CAGR as institutions chase elasticity, sub-second latency, and lower capex. Bank Zero’s all-cloud stack serves as a poster child, delivering under-one-second transfers facilitated by IBM FlashSystem arrays. Capitec’s cloud estate drives the bank’s low-fee model, illustrating cost advantages.
The South Africa real time payments market size allocated to cloud is expected to overtake on-premises spend before 2029, barring policy reversals. Regulators have signalled comfort provided data resides in-country and redundancy is proven. Multi-cloud strategies will rise as banks seek to avoid hyperscaler lock-in. Cybersecurity posture improves through automated patching and shared-responsibility models, countering the perception that cloud is less secure for financial workloads.
By Enterprise Size: SME Adoption Accelerates Despite Large Enterprise Dominance
Large enterprises captured 59.40% of 2025 transaction value due to established ERP integrations and stringent treasury mandates. SMEs, however, are forecast to post 33.10% CAGR as they digitalise point-of-sale and supply-chain payments. Happy Pay’s BNPL rails tailor settlement terms to SME cash cycles, evidence that credit-embedded payments resonate with smaller merchants.
The South Africa real time payments market share controlled by SMEs will widen as government pilots focus on township and rural entrepreneurs. Lower fee regimes and alias-based onboarding reduce friction that once deterred informal traders. Fintechs offering plug-and-play POS kits are best placed to capture early wallet share. Large enterprises will continue to invest in API orchestration to connect multiple banks and hedge counterparty risk, sustaining their monetary volume lead.
By End-User Industry: Government & Utilities Growth Challenges Retail Leadership
Retail and e-commerce held a 39.30% slice of 2025 value, buoyed by omnichannel roll-outs and QR acceptance at chains such as Pick n Pay. Government and utilities outpace at 35.60% CAGR, a function of SASSA grants disbursement automation and municipal bill digitisation. Public-sector modernisation avoids cash leakage, cuts fraud, and satisfies National Treasury inclusion goals.
The South Africa real time payments market size in government workflows may double by 2031 as water, power, and toll operators migrate to instant clearing. Education and healthcare represent latent demand once tariff frameworks finalise. Retailers, meanwhile, experiment with crypto rails, loyalty-linked micropayments, and same-day refunds to defend share. Each vertical will require tailored risk and chargeback policies, expanding service-provider revenues.
Geography Analysis
Western Cape and Gauteng lead with 47% and 42% digital-payment penetration respectively, sustained by dense smartphone ownership, fintech clusters, and broadband availability. Cape Town hosts Stitch, Yoco, and over 40 payment startups funded since 2020, creating a virtuous cycle of talent and capital. Gauteng benefits from Johannesburg’s corporate HQ base and rising township e-commerce nodes in Soweto and Tembisa.
KwaZulu-Natal shows mid-tier uptake at 35%. Durban’s port logistics and growing B2B e-commerce provide catalysts, while Budget 2024 township pilots aim to expand merchant-payment infrastructure. Limpopo and Eastern Cape trail at 18-22% due to sparse ATM density, higher data-cost-to-income ratios, and limited bank branch networks. Government and donor programmes are subsidising smartphone acquisition and merchant QR kits in these provinces.
Cross-border flows in the Common Monetary Area now route via SWIFT after a 2024 rule change, elevating fees and lengthening settlement windows, which may slow adoption along Namibia and Eswatini corridors. Yet PayShap’s reach expanded after Capitec, Discovery, and Postbank integrations, narrowing urban-rural gaps. Nationwide, the South Africa real time payments market benefits from consistent regulator messaging: Vision 2025 targets 90% electronic transaction penetration by mid-decade.
Competitive Landscape
Incumbents and fintechs share a moderately concentrated ecosystem. BankservAfrica operates the PayShap switch, processing 74.2 million transactions for R46 billion (USD 2.59 billion) within 18 months of launch. Standard Bank leverages Volante Technologies to modernise across 20 African markets, signalling a platform-sized bet on Payments-as-a-Service. Absa, FNB, and Nedbank are re-architecting cores with ISO 20022 semantics to maintain compliance and latency parity.
Fintech challengers target niches. Stitch’s USD 107 million war-chest funds unified checkout for retailers and subscription platforms. Ozow collaborates with EBANX to extend reach to global merchants needing local instant-pay options. Bank Zero’s cloud-native build sidesteps legacy constraints, offering free checking and under-one-second transfers to win digital natives.
Pricing remains the battleground. Capitec shaved immediate payment fees to R6 (USD 0.34) for 2025, undercutting rivals and courting value seekers. Fraud mitigation maturity differentiates players: FNB deploys AI-based anomaly detection while fintechs embed behavioural biometrics. Market share shifts will depend on the capacity to pair low fees with hardened security and broad alias interoperability inside the South Africa real time payments market.
South Africa Real Time Payments Industry Leaders
Peach Payments
PayU South Africa
iVeri Payment Technologies
Fiserv Inc.
MyGate (Wirecard SA)
- *Disclaimer: Major Players sorted in no particular order

Recent Industry Developments
- April 2025: Stitch closed a USD 55 million Series B round led by QED Investors to scale omnichannel payment APIs and fund regional acquisitions. The move positions Stitch to bundle checkout, reconciliation, and pay-by-link services for enterprise retailers.
- February 2025: Capitec Bank rolled out a streamlined 2025 tariff with a R6 immediate-payment fee, a strategic play to capture price-sensitive retail traffic and align with SARB Vision 2025 goals.
- January 2025: Stitch acquired ExiPay, adding in-person POS and tap-to-phone acceptance to its cloud wallet, giving merchants a single view of online and offline sales.
- January 2025: Volante Technologies inked a multi-year agreement with Standard Bank covering payments modernisation in 15 jurisdictions, cementing its status as a preferred PaaS engine for tier-1 African banks.


Research Methodology Framework and Report Scope
Market Definitions and Key Coverage
Our study defines the South African real-time payments (RTP) market as the total annual value of account-to-account transfers that clear in seconds on domestic, low-value rails such as PayShap and the legacy Real-Time Clearing (RTC) service. Transactions routed through card schemes, deferred-net EFT files, or cross-border settlement systems fall outside this lens.
Scope exclusion: High-value wholesale payments, card-based "push-to-card" services, and any revenues earned outside South Africa are not counted.
Segmentation Overview
- By Type of Transaction
- P2P
- P2B
- By Component
- Solutions
- Services
- By Enterprise Size
- Large Enterprises
- Small and Medium Enterprises
- By Deployment
- Cloud
- On-Premises
- By End-user Industry
- BFSI
- Retail and E-commerce
- Government and Utilities
- Healthcare
- Transportation and Education
- Other End-user Industries
Detailed Research Methodology and Data Validation
Primary Research
Mordor analysts ran structured interviews with bank payment leads, tier-two fintech gateways, merchant acquirers, and provincial consumer bodies across Gauteng, Western Cape, and KwaZulu-Natal. Conversations clarified PayShap fee strategies, SME onboarding frictions, and likely cloud-migration timelines, letting us validate secondary datapoints and refine forecast assumptions.
Desk Research
We began by harvesting transaction-level statistics and policy papers from institutional sources such as the South African Reserve Bank, BankservAfrica's monthly PayShap dashboards, Statistics South Africa household surveys, and AfricaNenda's 2024 SIIPS report. Complementary viewpoints were gathered from open reports by ACI Worldwide, IMF fintech notes, and academic journals that map cash-to-digital migration. Company filings, investor decks, reputable press articles, and paid libraries including D&B Hoovers and Dow Jones Factiva supplied financial clues, funding rounds, and competitive signals.
A second sweep captured smartphone penetration, retail e-commerce turnover, and mobile-data price trends from ICASA, GSMA Intelligence, and the Department of Communications, anchoring consumer-side elasticity estimates.
These sources are illustrative only; many additional publications informed data checks and contextual nuance.
Market-Sizing & Forecasting
The model starts top-down by reconstructing the national RTP pool from BankservAfrica volume-value feeds, then adjusts for under-reported fintech-to-fintech hops and wallet off-ramps. Selective bottom-up checks include gateway revenue roll-ups, sampled average service fee multiplied by transaction counts, and channel partner health-anchor reasonableness. Key variables include smartphone penetration, e-commerce GMV, PayShap share of cash displacement, average transaction fee compression, and SME digital-invoice adoption. A multivariate regression ties these drivers to historical value, and scenario analysis tests ranges before the forecast is locked.
Data Validation & Update Cycle
Outputs pass three filters: variance screens against historical seasonality, peer review by a senior analyst, and reconciliation with freshly gathered interview nuggets. Mordor refreshes the model each year and issues interim tweaks when material events, fee cap changes, or rail outages shift the baseline.
Why Mordor's Real Time Payments Market In South Africa Size & Share Analysis Baseline Commands Trust
Published estimates often diverge because firms slice the market along different rails, fee types, and forecast cadences, which produces wide spreads once compounded across six years.
Key gap drivers stem from (i) whether infrastructure software sales are rolled into market value, (ii) how unpriced P2P flows are monetized, (iii) the point in the PayShap ramp-up curve each analyst adopts, and (iv) refresh frequency that catches SARB fee revisions.
Benchmark comparison
| Market Size | Anonymized source | Primary gap driver |
|---|---|---|
| USD 0.57 B (2025) | Mordor Intelligence | - |
| USD 1.94 B (2024) | Global Consultancy A | Includes switch infrastructure and regional cross-border traffic; limited bottom-up validation |
| USD 0.89 M (2025) | Trade Journal B | Counts provider service fees only, excludes underlying transaction float and SME usage |
Taken together, the comparison shows that when scope is disciplined, variables are traceable, and annual updates capture PayShap traction, Mordor Intelligence delivers a balanced, transparent baseline decision-makers can rely on.


Key Questions Answered in the Report
What is the current value of the South Africa real time payments market?
It stands at USD 756.6 million in 2026 and is projected to climb to USD 3.12 billion by 2031 at a 32.74% CAGR.
Which payment segment is growing fastest?
Person-to-business transfers are expanding at 34.38% CAGR as township merchants and gig-economy platforms demand instant settlement.
How significant is cloud deployment in this space?
Cloud models hold a minority share today but are growing at 36.10% CAGR, poised to overtake on-premises systems before 2029.
Why are interchange fees considered a restraint?
Banks charge R6-10 per instant transaction versus R1-3 for EFTs, discouraging price-sensitive users and slowing mass adoption.
Which provinces lead in real-time payment penetration?
Western Cape and Gauteng top uptake at 47% and 42% respectively, thanks to robust digital infrastructure and fintech ecosystems.
What recent move did Capitec make to gain share?
Capitec slashed its immediate-payment fee to R6 in 2025, undercutting rivals and aligning with national inclusion goals.
Page last updated on:


