
South Africa Maize Market Analysis by Mordor Intelligence
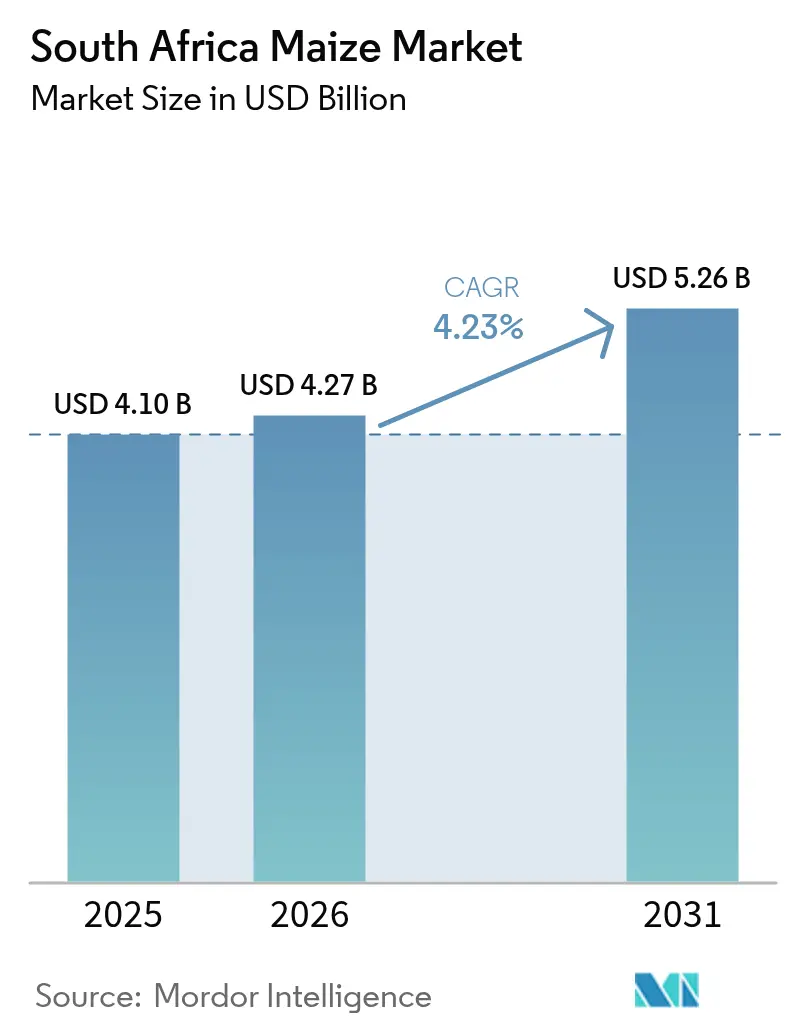
South Africa maize market size in 2026 is estimated at USD 4.27 billion, growing from 2025 value of USD 4.1 billion with 2031 projections showing USD 5.26 billion, growing at 4.23% CAGR over 2026-2031. According to the United States Department of Agriculture (USDA), South Africa's estimated maize production for 2023/24 totaled 14.5 million metric tons, including yellow maize for animal feed and white maize for human consumption. The market growth is driven by increased adoption of precision farming, expanded on-farm storage capacity, and consistent feed demand. Domestic consumption remains stable, and the country maintains a consistent exportable surplus despite increased uptake from feed and industrial processors. Government input-subsidy programs, mechanization improvements, and irrigation investments reduced average input costs, supporting producer margins. Although the market benefits from strong pricing within the Southern African Development Community, rail-freight constraints and trade policy challenges limit access to external markets.
Key Report Takeaways
- The Free State, Mpumalanga, and North West provinces produced more than 80% of South Africa's total maize output in 2025, establishing them as the country's primary maize-growing regions.
Note: Market size and forecast figures in this report are generated using Mordor Intelligence’s proprietary estimation framework, updated with the latest available data and insights as of 2026.
South Africa Maize Market Trends and Insights
Drivers Impact Analysis*
| Driver | (~) % Impact on CAGR Forecast | Geographic Relevance | Impact Timeline |
|---|---|---|---|
| Rising Demand from Food and Feed Industries | +1.2% | Free State, Mpumalanga, and North West | Medium term (2-4 years) |
| Expansion of Export Opportunities | +0.8% | Nationwide, spillover to Southern African Development Community (SADC) | Long term (≥ 4 years) |
| Government Input-Subsidy and Mechanization Schemes | +0.6% | Free State, and North West | Short term (≤ 2 years) |
| Industrial Usage for Starch and Bio-Ethanol | +0.5% | Gauteng, and KwaZulu-Natal | Medium term (2-4 years) |
| Adoption of Precision Agriculture and Digital Agronomy Tools Improving Input Efficiency | +0.7% | National, with faster adoption in commercial farming regions | Medium term (2-4 years) |
| Rapid Expansion of On-Farm Storage Silos Reducing Post-Harvest Losses | +0.4% | Major producing provinces | Medium term (2-4 years) |
| Source: Mordor Intelligence | |||
Rising Demand from Food and Feed Industries
South Africa's annual maize consumption comprises a significant amount of white maize for human consumption and yellow maize for livestock feed. The average per-capita consumption of white-maize meal is 81 kg, which remains stable during economic fluctuations. Feed manufacturers, including RCL Foods, reported sales of 330,036 metric tons in 2024, with segment revenue reaching ZAR 26 billion (USD 1.4 billion). The diverse consumption patterns across human food, animal feed, and industrial applications contribute to market stability and growth in South Africa's maize industry.
Expansion of Export Opportunities
South Africa functions as a primary regional maize supplier due to persistent crop shortages in neighboring countries. The country's maize exports attained USD 1.0 billion in 2023, securing its position among the top ten global exporters[1]Source: World Bank, “Maize exports by country 2023,” wits.worldbank.org. Africa accounts for 44% of South Africa's agricultural exports, capitalizing on reduced transportation distances and lower tariff rates. While Brazil, Russia, India, China, and South Africa (BRICS) market access offers expansion opportunities, non-tariff barriers and GMO requirements constrain immediate growth potential. The enhancement of rail and port infrastructure remains fundamental for expanding South Africa's maize market.
Government Input-Subsidy and Mechanization Schemes
The Agriculture and Agro-processing Masterplan facilitates reduced-rate financing for agricultural inputs, including seeds, fertilizers, and machinery, which is anticipated to decrease average farming costs by 10% in 2025[2] Source: Government of South Africa, “Statement on the Cabinet meeting of 11 June 2025,” gov.za. The adoption of smart irrigation systems is anticipated to expand across farms by the end of the year, improving water efficiency and crop yield predictability. While the subsidy program facilitates technological adoption, it incorporates measures to prevent sustained financial dependency. The plan's success requires the integration of financial incentives with comprehensive agricultural training initiatives to optimize farm profitability and expand South Africa's maize market.
Industrial Usage for Starch and Bio-Ethanol
The South African maize market is experiencing demand diversification through increased investments in starch production and renewable fuels[3] Source: State of the Nation, “Agriculture is a vital part of our growth story,” stateofthenation.gov.za. Pride Milling's expanded crush capacity, supported by Thebe Investment Corporation's 40% stake, has encouraged contract farming for specialty yellow maize hybrids. The development of bio-ethanol blends supports national clean-energy objectives while providing a market for off-grade grain, creating a countercyclical buffer in the market.
Restraints Impact Analysis*
| Restraint | (~) % Impact on CAGR Forecast | Geographic Relevance | Impact Timeline |
|---|---|---|---|
| Diseases and Insect Outbreaks | -0.9% | Higher risk in humid coastal areas | Short term (≤ 2 years) |
| Land Reform Uncertainty | -0.7% | National, with particular focus on commercial farming areas | Long term (≥ 4 years) |
| Climate-Change Driven Water Stress and Erratic Rainfall | -1.1% | National, with severe impact in North West, and Free State | Long term (≥ 4 years) |
| Rail-Freight Capacity Volatility and High Logistics Costs | -0.5% | Export-oriented corridors | Medium term (2–4 years) |
| Source: Mordor Intelligence | |||
Diseases and Insects Outbreaks
Goss's Wilt outbreaks and Fusarium infections pose significant threats to crop yields in South Africa's maize production, despite farmers using resistant genetically modified varieties. A comprehensive analysis of 723 fungal strains indicates increased mycotoxin risks, necessitating enhanced harvest hygiene protocols. The stabilization of yields in the South African maize market requires integrated pest management strategies that combine biotechnology, crop rotation, and continuous monitoring.
Climate-Change Driven Water Stress and Erratic Rainfall
Climate variability poses the primary long-term risk to South Africa's maize production, as yield variations correlate strongly with weather patterns and El Niño-induced droughts. Water stress impacts all major producing regions, particularly the North West and Free State provinces, where irregular rainfall disrupts planting schedules and reduces yields. La Niña rains in 2025 supported partial recovery, but planting delays in the eastern Free State highlighted persistent vulnerabilities. Despite the implementation of large-scale irrigation systems and drought-resistant varieties, the South African maize market requires continuous capital investment for climate resilience.
*Our forecasts treat driver/restraint impacts as directional, not additive. The impact forecasts reflect baseline growth, mix effects, and variable interactions.
Geography Analysis
The Free State, Mpumalanga, and North West provinces produced more than 80% of South Africa's total maize output in 2025, establishing them as the country's primary maize-growing regions. Free State Province produces the majority of South Africa's maize output, supported by deep soil quality and established logistics corridors. While western districts experience recurring drought conditions, high adoption of biotechnology and precision irrigation systems enhances yield stability. The province's large-scale farming operations enable efficient mechanization and storage infrastructure investments, reducing logistical costs and strengthening the Free State's position in the South African maize market.
Mpumalanga accounts for a significant share of national maize harvest volumes, supported by consistent rainfall patterns and proximity to industrial processing facilities. Despite delayed plantings in 2025 due to late rains, yield projections remain favorable. The province's mixed farming approach provides income diversification, while expanded silo capacity reduces moisture-related crop losses. Advanced irrigation technology adoption positions Mpumalanga to achieve the highest production compound annual growth rate among major provinces in the South African maize market.
North West Province maintains a significant contribution to national maize production, despite experiencing flood-related damage in 2024/25. Government support programs and improved drainage infrastructure help stabilize production areas, while enhanced road transportation compensates for limited rail capacity. The province's adoption rate of drought-resistant seeds accelerates recovery from adverse conditions. The implementation of digital farming advisory services enhances planting precision, supporting the province's long-term market position in South African maize production.
Regulatory Landscape
South Africa regulates maize quality and trade through the Agricultural Product Standards Act and related regulations on grading, packing, and marking. Updates published in early 2024 tightened operational requirements for marketable maize, including a maximum moisture limit of 14% and conditions on odor, cleanliness, and insect-free status. These rules shape handling practices from farm delivery to storage and milling.
Market governance also includes statutory measures under the Marketing of Agricultural Products Act and mandatory information reporting via the South African Grain Information Service (SAGIS). Manufacturers, importers, and exporters of maize products must submit monthly returns to SAGIS within 10 working days after month-end, creating a compliance checkpoint for commercial flows. Trade policy is supported by a duty-free (zero-tariff) maize import regime referenced in 2026 trade policy reporting, reinforcing maize as a food-security commodity even when other grains face tariff-trigger mechanisms.
Value Chain Analysis
The maize value chain in South Africa runs from input suppliers (seed, fertilizer, crop protection, and mechanization) to producers concentrated in the Free State, North West, and Mpumalanga, followed by aggregation at commercial silos, processing (milling, feed, and industrial users), and distribution to domestic and export channels. White maize primarily serves human consumption markets, while yellow maize feeds the animal-feed segment and industrial uses, linking farmgate prices to both staple-food and protein value chains.
Storage and primary handling act as a key control point. Commercial storage is concentrated, with major silo operators such as AFGRI, NWK, and Senwes controlling a large share of national capacity (16.3 million tons). Price discovery and risk management are supported through futures and options trading on the Randfontein grain market, while bottlenecks remain around rail-freight volatility and logistics constraints outside Gauteng. This raises delivered costs for grain movement from core producing provinces to processors and export corridors.
Market Opportunities and Future Outlook
Opportunities in the South Africa maize market increasingly center on profitability and demand diversification rather than only expanding volumes. Precision agriculture and digital decision support offer room for input-efficiency gains, supported by on-farm trials during the 2024/2025 season that used platforms such as OneSoil to guide variable-rate fertilizer and seed application. This is reinforced by government-backed digitization efforts such as the SASSAM demonstration in Mthatha, which aims to upgrade data-driven decision-making on 50 farms.
A second opportunity comes from downstream pull-through from processing and alternative demand streams during periods of surplus. Government support programming remains a lever for smallholder commercialization and extension reach, with the Department of Agriculture budget for 2026/27 at R7.84 billion and R3.28 billion directed to food security and farmer support, including a hybrid digital extension support platform. At the same time, a high-supply environment signaled by official crop estimation and supply-demand reporting increases the commercial incentive to expand export execution and to develop industrial offtake, including starch and renewable-fuels pathways already present in the market narrative, to absorb off-grade grain and help stabilize producer economics.
Recent Industry Developments
- July 2026: Premier Group reported record earnings for the year ended 31 March 2026, with its Millbake division benefiting from materially lower white maize input prices versus the prior year. The performance highlights how sharp grain price declines can improve margins for large downstream buyers, tightening procurement standards and shifting bargaining power along the maize-to-food processing chain.
- June 2026: Omnia Holdings, through a JSE SENS update, reported growth in its Agriculture segment, supported by its Nutriology approach and customer-centric execution in South Africa. The update signals continued investment and commercial focus on input and advisory solutions that can raise maize input-use efficiency at farm level during a low-price cycle.
- April 2024: UPL announced plans for a large bioethanol project in South Africa designed to use sugarcane and corn as feedstocks. The announcement underscores active interest in building industrial demand optionality for maize, even as project timelines and enabling policy detail remain key determinants of near-term offtake.


Research Methodology Framework and Report Scope
Market Definition and Coverage
For this study, the South Africa maize market is defined as the value of maize supplied and used in the country, linked to measurable production, trade flows, and pricing, and then expressed in current USD for the selected year.
Scope exclusions: It does not count downstream processed-food value addition beyond maize at the commodity level (for example, branded retail markups on finished foods).
Segmentation Overview
- By Geography
- South Africa
- Production Analysis (Volume)
- Consumption Analysis (Value and Volume)
- Import Analysis (Value and Volume)
- Export Analysis (Value and Volume)
- Price Trend Analysis
- South Africa
Data Sources, Market Sizing, and Validation
Desk Research
Desk research starts with official production and area statistics, because maize is a crop where acreage, yield, and stock changes explain most swings in market value. We relied on public datasets such as national crop estimates and market updates, FAOSTAT, UN Comtrade for trade volumes and values, and government or port-level trade statistics where available. Price direction was cross-checked through public wholesale and benchmark price publications, then corroborated with reputable press reporting on drought cycles and policy changes.
We then layered in company filings and investor presentations from large handlers, millers, and input suppliers to understand procurement patterns, seasonal timing, and typical quality splits between white and yellow maize. A paid subscription for company financials and a shipment-level trade database were used selectively to sanity-check exporter and importer activity when public series were delayed. These sources are illustrative only, and other public documents and datasets were also reviewed to clarify, validate, and fill data gaps.
Primary Interviews and Surveys
Primary interviews and surveys were used to stress-test the desk model, especially around price realization at different points in the season and the practical split of demand between food, feed, and industrial use. We spoke with participants across farming, storage and handling, trading, milling, and feed procurement so assumptions on volumes, losses, and trading behavior could be corrected where needed. Since this is a country market, coverage focused on major producing and consuming corridors inside South Africa rather than spreading effort across global regions.
Distribution of primary research fieldwork respondents
| Company type | Respondent position |
|---|---|
| Top tier: 28% | CXOs: 19% |
| Mid tier: 53% | Functional/Unit leaders: 37% |
| Smaller Players: 19% | Managers: 44% |
Market-Sizing & Forecasting
Market sizing was built using a top-down reconstruction where production volumes, opening and closing stock signals (where reported), and net trade are used to form available supply, which is then valued using observed wholesale price series adjusted for seasonality. After that structure was stable, we corroborated it with selective bottom-up checks such as sampled volume by channel and typical realized price ranges discussed in interviews, and then tuned the totals only when the checks pointed in the same direction.
Key inputs used in the model include harvested area and yield trends, domestic production volumes, import and export volumes and values, and wholesale price movements, along with demand cues tied to feed use and staple food consumption behavior. When a variable was missing for a specific year, the gap was handled through conservative interpolation anchored to adjacent years and validated through interview feedback.
Forecasting was done using scenario analysis supported by weather sensitivity discussions and planted-area intentions, followed by an overlay on price expectations based on input costs and trade parity logic. To keep outputs practical, assumptions were kept traceable to the same observable indicators used in the historical build, and then reviewed again with primary respondents before finalizing.
Data Validation & Update Cycle
Validation is done in steps so the model does not pass through a single set of assumptions unchecked. Outputs are compared against independent signals such as trade balance direction, price level shifts during surplus or deficit seasons, and whether implied consumption aligns with known demand behavior. When a variance looks unusual, the drivers are reopened, interview notes are revisited, and targeted re-contacts are triggered to confirm what changed.
Before sign-off, the work goes through an internal analyst review that focuses on arithmetic accuracy, unit consistency, and year-to-year logic, followed by a final sense check on whether the storyline matches the numbers. Reports are refreshed annually, and interim updates are made when material events occur such as major production shocks or policy changes affecting trade. Right before delivery, a fresh pass is completed so clients receive the most current view available at that time.
Mordor Intelligence's South Africa Maize Market Sizing Compared With Other Published Estimates
It is normal to see different market sizes for maize because publishers do not always value the same physical flow, and they often pick different years and price references to convert tons into USD. Differences also show up when one estimate leans more on production value, while another leans more on consumption value or includes extra downstream processing value.
By tracking wholesale price movements alongside production and net trade indicators, Mordor Intelligence keeps the 2025 value tied to the in-country commodity maize flow (white and yellow) and avoids mixing in processed-food markups or aggressive price progression assumptions. Some published estimates also anchor on 2024 and then project forward using a single CAGR, which can miss step changes driven by weather-related yield swings and trade parity shifts.
Benchmark comparison
| Source | Market Size | Gaps in Research Methodology |
|---|---|---|
| Mordor Intelligence | USD 4.10 B (2025) | |
| Global Consultancy A | USD 3.90 B (2024) | Anchors the series on a 2024 valuation and applies a smoother growth path, which can understate year-specific price and trade swings that affect maize value in USD. |
| Industry Advisory B | USD 2.93 B (2024) | Uses a narrower valuation base and segment choices that can exclude parts of the traded commodity flow, and it may rely more on stated product categories rather than reconciling production plus net trade against price benchmarks. |
Taken together, the spread is mainly explained by year selection, how tons are valued into USD, and whether adjacent downstream value is blended into the maize total. Our approach stays repeatable because the steps are tied to production, trade, and observable pricing, and then checked with field feedback before numbers are finalized.


Key Questions Answered in the Report
How large is the South Africa maize market in 2026?
The South Africa maize market size stands at USD 4.27 billion in 2026 and is projected to reach USD 5.26 billion by 2031.
Which major province leads national maize output?
The Free State, Mpumalanga, and North West provinces account for more than 80% of South Africa's total maize production, making them the country's primary maize-growing regions.
How significant are exports to regional trade?
About 44% of South Africa's farm exports go to African neighbors, with maize earning USD 1.0 billion in 2023 despite rail limits.
Which growth driver has the highest influence on CAGR?
Rising demand from food and feed industries adds the greatest uplift, contributing +1.2 percentage points to forecast CAGR.
Page last updated on:





