
Market Overview
| Study Period | 2021 - 2031 |
|---|---|
| Forecast Data Period | 2026 - 2031 |
| Historical Data Period | 2021 - 2024 |
| Market Size (2026) | USD 1.62 Billion |
| Market Size (2031) | USD 1.99 Billion |
| Growth Rate (2026 - 2031) | 4.15 % |
| Market Concentration | Medium |
Major Players *Disclaimer: Major Players sorted in no particular order Image © Mordor Intelligence. Reuse requires attribution under CC BY 4.0. | |
South Africa Battery Market Analysis by Mordor Intelligence
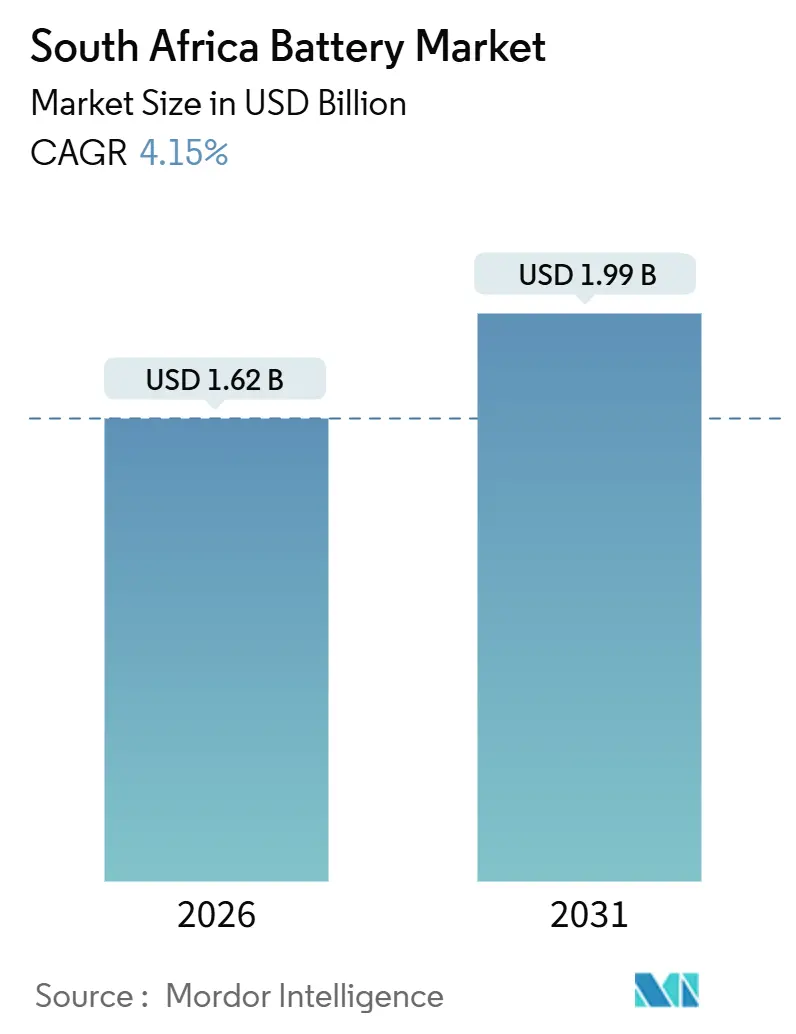
The South Africa Battery Market size is estimated at USD 1.62 billion in 2026, and is expected to reach USD 1.99 billion by 2031, at a CAGR of 4.15% during the forecast period (2026-2031).
Accelerated investment in utility-scale storage, residential solar-plus-storage, and industrial motive power underpins this expansion, while secondary chemistries displace primary cells across most end uses.[1]Department of Mineral Resources and Energy, “Integrated Resource Plan 2025,” DMRE.gov.za Eskom’s 2,173 MW battery energy storage pipeline, Ford’s plug-in-hybrid export program, and mining electrification targets collectively anchor multi-year demand visibility, insulating the South Africa battery market from cyclical swings in telecom backup purchases.[2]ESI Africa, “Eskom Announces Preferred Bidders for Battery Storage Bid Window 3,” ESI-Africa.com Competitive intensity remains moderate because domestic lead-acid capacity is concentrated in one producer, while all lithium-ion cells are imported, allowing local assemblers to differentiate through balance-of-plant engineering and service offerings.[3]First National Battery, “Products and Services,” FNB.co.za Headwinds revolve around currency depreciation, policy delays in storage licensing, and continued reliance on Asian cell suppliers, yet generous electric-vehicle assembly incentives and a 70% local-content threshold on balance-of-plant components encourage incremental localization, especially in enclosures, inverters, and integration software.
Key Report Takeaways
- By battery type, secondary batteries accounted for 78.3% of the South Africa battery market share in 2025, and are projected to grow at a 7.3% CAGR through 2031.
- By technology, lead-acid held 45.9% share of the South Africa battery market size in 2025, while solid-state is forecast to expand at a 23.6% CAGR through 2031.
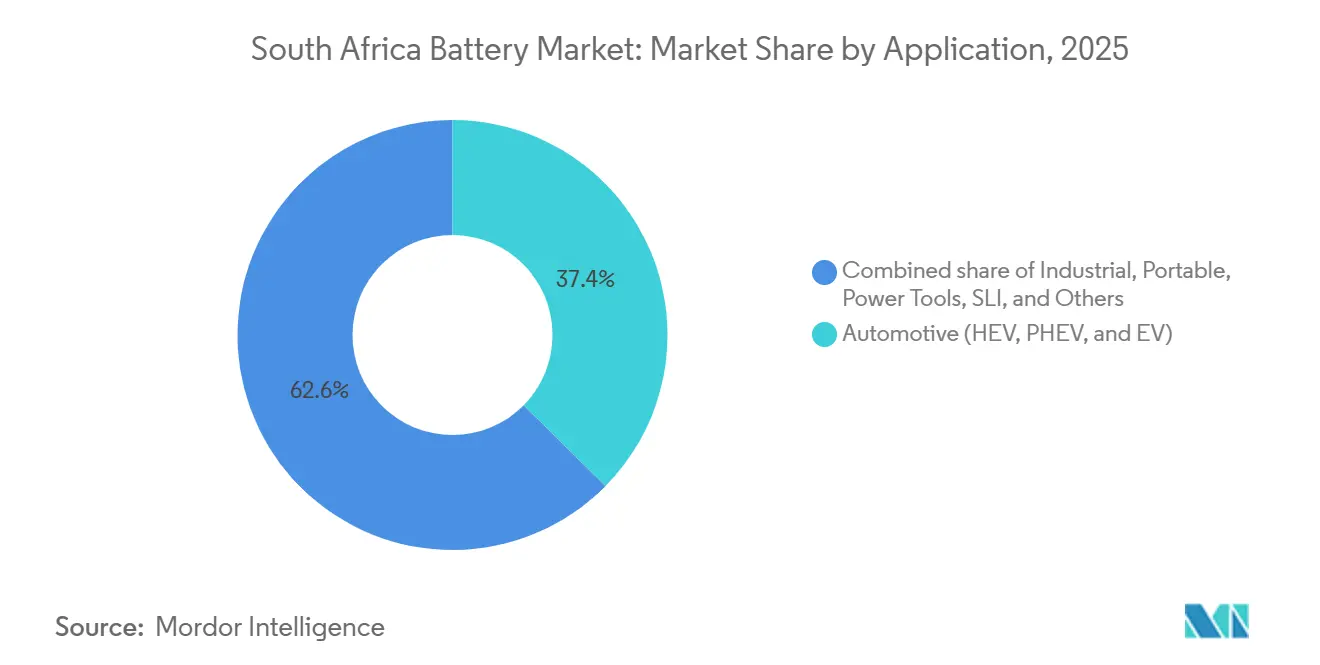
- By application, industrial uses are advancing at an 8.8% CAGR to 2031, outpacing the automotive segment, which led the market share with 37.4% in 2025.
- By geography, Gauteng captured almost 60% of 2025 revenue, reflecting the province’s concentration of automotive, data-center, and telecom activity.
- CATL, LG Energy Solution, and Samsung SDI collectively supplied more than 70% of imported lithium-ion cells in 2025, underscoring a supply chain that remains highly consolidated.
Note: Market size and forecast figures in this report are generated using Mordor Intelligence’s proprietary estimation framework, updated with the latest available data and insights as of January 2026.
South Africa Battery Market Trends and Insights
Drivers Impact Analysis*
| Driver | (~) % Impact on CAGR Forecast | Geographic Relevance | Impact Timeline |
|---|---|---|---|
| Utility-scale renewables integration mandates | 1.2% | National, with concentration in Northern Cape, Western Cape, and Free State renewable energy zones | Medium term (2-4 years) |
| Telecom tower backup demand surge | 0.6% | National, with highest density in Gauteng, Western Cape metros | Short term (≤ 2 years) |
| EV adoption & localized assembly incentives | 0.9% | National, with assembly concentrated in Gauteng (Ford Silverton, BMW Rosslyn) | Medium term (2-4 years) |
| Mining sector decarbonization targets | 0.5% | Limpopo, North West, Northern Cape mining belts | Long term (≥ 4 years) |
| Eskom BESS procurement programme | 1.3% | National grid integration, priority dispatch zones in Gauteng, KwaZulu-Natal | Short term (≤ 2 years) |
| Source: Mordor Intelligence | |||
Utility-Scale Renewables Integration Mandates
The Integrated Resource Plan 2025 embeds 8,500 MW of battery energy storage by 2039, including 3,100 MW before 2030, effectively tying every new wind or solar plant above 50 MW to four-hour storage systems.[4]Department of Mineral Resources and Energy, “Integrated Resource Plan 2025,” DMRE.gov.za Eskom’s three bid windows already secured 2,173 MW, translating to about 8,700 MWh requiring delivery between 2026 and 2029. Because of 18-to-24-month procurement lead times on cells, developers with tolling arrangements at CATL or LG Energy Solution have a sourcing edge and can lock in forward pricing. Flow batteries, represented by Bushveld Energy’s 1 MW/4 MWh vanadium project, highlight non-lithium alternatives where long cycle life compensates for higher capex. Still, lithium-ion retains cost leadership for four-hour duty cycles, keeping the South Africa battery market firmly oriented toward imported NMC and LFP cells for grid storage.
EV Adoption and Localized Assembly Incentives
A 150% tax deduction on electric-vehicle production costs, effective March 2026, aims to triple domestic plug-in-hybrid and battery-electric output by 2028, even though cell manufacturing remains outside the incentive’s scope. Ford’s Silverton plant produced sixty-two thousand Ranger PHEV packs in 2025, all earmarked for export, while BMW’s Rosslyn facility began next-generation X3 PHEV assembly in late 2024. Domestic EV sales rose from fewer than nine hundred units in 2021 to nearly five thousand in 2022, yet they still account for under 1% of the national fleet, constrained by a charging network of roughly 370 stations. Even so, predictable pack demand from export lines provides steady volume for module assembly and end-of-life recycling, strengthening the South Africa battery industry over the medium term.
Mining Sector Decarbonization Targets
Anglo American activated 84 MW of battery-electric equipment in 2024, including a 290-tonne haul truck with a 1.2 MWh pack, and plans to electrify about 400 trucks by 2030, implying over 500 MWh of cumulative demand. Lithium-ion’s two-to-three-times longer cycle life and opportunity charging yield 15%-to-20% lower total cost of ownership versus lead-acid, despite a 40% premium. Forklift and underground loader fleets are following suit, stimulating orders for modular LFP systems from BlueNova and Freedom Won. Solid-state cells promise higher tolerance to high-ambient temperatures typical of deep mining, but commercial volumes remain at least two years away. Consequently, long-term electrification plans anchor steady demand that reinforces the South Africa battery market beyond automotive cycles.
Eskom BESS Procurement Programme
Bid Windows 1 through 3 awarded 513 MW, 616 MW, and 1,044 MW, respectively, each tied to inflation-indexed twenty-year offtake agreements. Local-content rules require a 70% domestically sourced balance-of-plant components, accelerating investment in enclosures, inverters, and civil works. However, grid-connection delays caused by substation upgrades have extended commissioning by six to twelve months for early projects, compressing developer returns and nudging some sponsors toward refinancing. Despite timing slippage, the procurement guarantees multi-gigawatt-hour cell offtake and cements the South Africa battery market as a core pillar of the national energy transition.
Restraints Impact Analysis*
| Restraint | (~) % Impact on CAGR Forecast | Geographic Relevance | Impact Timeline |
|---|---|---|---|
| Import-dependent cell supply chain | -0.4% | National, affecting all lithium-ion segments | Medium term (2-4 years) |
| Limited domestic manufacturing base | -0.3% | National, with potential localization in Gauteng industrial corridors | Long term (≥ 4 years) |
| Policy delays on storage licensing | -0.2% | National, NERSA jurisdiction over grid-connected projects | Short term (≤ 2 years) |
| Source: Mordor Intelligence | |||
Import-Dependent Cell Supply Chain
South Africa imports more than 95% of its lithium-ion cells, mainly from China, South Korea, and Japan, exposing integrators to shipping disruptions, rand depreciation, and trade disputes. Although the country mines roughly 40% of global manganese ore, fewer than 5% of refined battery-grade manganese sulphate units are produced domestically, forcing two-way trade flows that inflate costs. The planned 10,000-tonne battery-grade manganese sulphate plant from Manganese Metal Company will meet only a fraction of cathode demand by the end of the decade. Each 10% slide in the rand lifts landed cell costs by about 8%, lengthening residential solar storage payback periods by one year or more, and taking some momentum out of the South Africa battery market’s near-term growth.
Policy Delays on Storage Licensing
National Energy Regulator of South Africa guidelines covering third-party-owned storage assets and behind-the-meter systems above 1 MW remain in consultation, deferring nearly 200 MW of private projects. Developers face uncertain wheeling charges and technical compliance criteria, forcing engineers to over-specify inverters to ensure grid-code compatibility, which inflates capex by up to 8%. The absence of a clear interconnection queue adds further unpredictability, with approval timelines ranging from three months to more than a year. Consequently, some investors demand higher hurdle rates, dampening the otherwise positive trajectory of the South Africa battery market.
*Our forecasts treat driver/restraint impacts as directional, not additive. The impact forecasts reflect baseline growth, mix effects, and variable interactions.
Segment Analysis
By Battery Type: Rechargeables Gain Dominance
Secondary batteries commanded 78.3% of 2025 revenue within the South Africa battery market. They are projected to advance at a 7.3% CAGR through 2031, underpinned by lithium-ion uptake in automotive export lines and Eskom’s grid-storage build-out. Ford assembles 62,000 plug-in-hybrid packs per year in Silverton, and BMW scales X3 PHEV modules in Rosslyn, reinforcing predictable demand volumes. Primary cells remain confined to consumer electronics where convenience trumps lifecycle economics.
Lead-acid continues to anchor automotive start-lighting-ignition and telecom backup thanks to a mature recycling loop that recovers 96% of content. Yet lithium-ion’s superior depth-of-discharge and high-cycle life make it the chemistry of choice for residential solar, office, uninterrupted-power-supply, and utility storage. REVOV’s second-life EV modules, priced 40% below new cells, illustrate how circular-economy models expand addressable demand for lithium-ion systems. The South Africa battery market size for rechargeable chemistries will therefore widen its lead over primary alternatives throughout the forecast horizon.




By Technology: Incumbent Lead-Acid Meets Emerging Solid-State
Lead-acid technology held 45.9% of the South Africa battery market share in 2025, yet solid-state prototypes are poised for the fastest expansion at a 23.6% CAGR. Lithium-ion remains the performance and cost benchmark today, split between LFP for stationary applications and higher-energy NMC for automotive. International Energy Agency data indicate LFP could capture half of global EV batteries by 2026, owing to cobalt-free cathodes and better thermal stability. Vanadium-redox flow batteries offer a twenty-year cycle life and inherent non-flammability; Bushveld Energy’s 1 MW/4 MWh installation validates the chemistry’s industrial potential, although capex per kilowatt-hour is still double that of lithium-ion.
Sodium-ion and zinc-air technologies remain pre-commercial but could disrupt price-sensitive stationary markets after 2028 if raw-material security becomes critical. Meanwhile, the South Africa battery market size for lead-acid will erode slowly as recycled content advantages are outweighed by lithium-ion’s superior energy density in new applications. Solid-state’s commercial arrival around 2028 may accelerate displacement if cost curves align with automotive pack targets below USD 80 per kWh.
By Application: Industrial Demand Outpaces Automotive
Industrial uses, which include telecom backup, uninterruptible power supplies, motive power, and utility-scale storage, are projected to grow at an 8.8% CAGR through 2031, eclipsing the automotive segment’s 4.1% pace. Eskom’s four-hour BESS mandate alone represents nearly 8,700 MWh of new installations, dwarfing on-road EV demand. Ford and BMW export nearly all locally assembled plug-in-hybrid packs, limiting home-market automotive volumes to fewer than 5,000 EVs in 2022.
Mining electrification reinforces the industrial narrative: Anglo American’s haul-truck prototype signals a potential 500 MWh battery requirement by 2030. Data-center developers in Johannesburg specify lithium-ion UPS systems that occupy half the floor space of valve-regulated lead-acid alternatives and last 10 to 15 years. Telecom operators, after spending R2.5 billion on backup batteries in 2023, are trialing lithium-ion units with GPS tracking to curb theft, which cost MTN R450 million in 2024. Residential demand is moving upscale: Tesla’s Powerwall 3 debuted at R181,873 and integrates with a virtual power plant program that yields bill-credit revenue streams. Collectively, diversified industrial ordering anchors multi-year growth in the South Africa battery market.
Geography Analysis
Gauteng generated nearly 60% of 2025 revenue for the South Africa battery market, driven by automotive assembly, telecom tower density, and Johannesburg’s expanding data-center clusters. Ford Silverton, BMW Rosslyn, and Nissan Rosslyn account for the bulk of localized pack assembly, while high-tech campuses in Midrand specify lithium-ion uninterrupted-power-supply systems to mitigate grid instability. Upscale suburbs in Johannesburg and Pretoria, experiencing frequent Stage 4-to-6 load-shedding, prioritize residential solar storage, underpinning premium sales of BlueNova and Freedom Won modules.
The Western Cape contributes around one-quarter of national demand, anchored by Cape Town’s early adoption of rooftop solar, Time-of-Use tariffs, and municipal incentives for home energy storage. Tesla Powerwall and BlueNova units priced between R66,450 and R181,873 gain traction among affluent households, while commercial installations in Stellenbosch wineries and Table View retail centers underscore small-business uptake. Renewable energy zones in the Western and Northern Cape host the majority of awarded utility-scale BESS projects, leveraging high solar capacity factors to shift midday generation into evening peaks.
Limpopo and North West provinces form a third node, where mining electrification is propelling demand for high-capacity lithium-ion packs in haul trucks and underground loaders. KwaZulu-Natal and Eastern Cape together account for roughly 10% to 15% of the market, driven by Durban’s port logistics and automotive component suppliers. Telecom backup orders, once concentrated in Gauteng and Western Cape, have become more regionally balanced as operators roll out solar-battery hybrids at rural tower sites to curb diesel use. This spatial distribution highlights how the South Africa battery market aligns with industrial hubs, renewable resource corridors, and electrification mandates.
Regulatory Landscape
South Africa's battery market is shaped by parallel energy-system and industrial-policy levers. On the power side, the Integrated Resource Plan 2025 embeds battery energy storage into the national capacity mix, while the state-led battery storage procurement program (BESIPPPP) and Eskom offtake structures support utility-scale deployments. Grid access and licensing remain central gating items, with NERSA decisions (including an approved 177.50 MWac/710 MWh BESS generation license in October 2024) reinforcing that large BESS projects continue to operate within formal generation and grid-connection compliance pathways.
Regulation is also reducing friction for distributed and utility projects through environmental and grid-rule changes. A 2024 exclusion framework under environmental norms provides a faster route for BESS projects in low or medium sensitivity areas, which improves permitting certainty for developers assembling multi-site portfolios. In parallel, 2025 Grid Capacity Allocation Rules explicitly recognize BESS as eligible applicants for grid capacity, while trade and industrial instruments, including ITAC and dtic notices/actions in 2026 and the 2025 Critical Minerals and Metals Strategy, link localization objectives to batteries and upstream inputs, reinforcing the push for domestic assembly and component manufacturing even as most lithium-ion cells continue to be imported.
Value Chain Analysis
South Africa's battery value chain remains import-led for lithium-ion cells, with local activity concentrated in pack and module assembly, system integration (inverters, enclosures, EMS software), EPC services, and aftermarket support. Global cell suppliers such as CATL, LG Energy Solution, and Samsung SDI dominate inbound supply, while domestic players span lead-acid manufacturing and recycling (anchored by First National Battery/Metair) and lithium-ion pack assembly and second-life repurposing for residential, C&I, and utility applications. Distribution routes split between project-led procurement for utility-scale BESS (IPP consortia, EPCs, and OEM integrators) and installer and channel networks for residential solar-plus-storage and telecom or UPS deployments.
Localization efforts are increasingly structured around industrial zones and policy-linked investment facilitation. In November 2024, Balancell expanded lithium iron phosphate battery assembly capacity (reported at 1 GWh) in Ndabeni, Cape Town, illustrating how assembly and integration are scaling ahead of cell manufacturing. In March 2026, an LSF feasibility study identified Atlantis Special Economic Zone and Coega Industrial Development Zone as candidate locations for a 5 to 10 GWh LFP cell plant, while IDC value-chain programs continue to frame batteries as a mining-to-beneficiation-to-manufacturing opportunity. The main bottlenecks remain imported cell dependence, currency and logistics exposure, and grid-connection queues that can extend delivery cycles for large BESS assets.
Competitive Landscape
Global cell makers, CATL, LG Energy Solution, Samsung SDI, BYD, and Panasonic, supply over 90% of lithium-ion cells imported into South Africa. Local integrators then assemble modules and packs tailored to residential, commercial, and utility requirements. First National Battery, owned by Metair, manufactures roughly 2.2 million lead-acid units a year and dominates the automotive start-lighting-ignition space with entrenched recycling contracts. Exide Industries supplies aftermarket lead-acid, while BlueNova, Freedom Won, and REVOV address lithium-ion and second-life niches.
Strategic moves in 2025-2026 include Tesla selecting Rubicon Energy and Segen South Africa as Powerwall 3 distributors, bolstering premium residential presence. REVOV opened a Durban facility targeting 2,000 repurposed EV battery sales in 2024, expanding the circular-economy footprint. Bushveld Minerals scaled vanadium electrolyte output to eight million liters a year, positioning itself as a flow-battery component supplier as industrial microgrid demand matures.
Eskom’s 70% local-content rule on balance-of-plant elements has spurred joint ventures between international independent power producers and South African EPCs, such as Scatec’s partnership with WBHO for civil works. BYD’s ongoing discussions with the government for a potential assembly plant underscore rising interest in capturing regional demand for both vehicles and stationary storage. Even so, the absence of a domestic gigafactory leaves the supply chain vulnerable to import logistics and currency swings, maintaining moderate rather than intense competition within the South Africa battery market.
South Africa Battery Industry Leaders
Eveready (Pty) Ltd.
Probe Group
First National Battery
Freedom Won (Pty) Ltd.
BlueNova Energy (Pty) Ltd.
- *Disclaimer: Major Players sorted in no particular order


Market Opportunities and Future Outlook
Utility-scale storage demand is increasingly complemented by private wheeling and corporate offtake structures, which broadens procurement channels across the country. In June 2026, SOLA Group's Naos-1 hybrid solar-plus-storage project in the Free State reached financial close with a 660 MWh BESS supply arrangement, and the project structure includes long-term offtake with Sasol and Air Liquide, pointing to expanding corporate-led storage demand beyond state procurement. Also in June 2026, Mulilo reached financial close for the 77 MW/308 MWh Hartebeesfontein BESS (BESIPPPP Bid Window 2), supporting bankability for standalone storage under the government program.
There is visible whitespace in local manufacturing and service layers where policy and procurement rules are already shifting spend into South Africa. Eskom-linked BESS contracting and local-content requirements on balance-of-plant components are supporting opportunities in enclosures, inverter integration, civil works, and energy management software, while the 2025 Critical Minerals and Metals Strategy and related dtic and ITAC actions create further momentum for local processing and component production tied to batteries. Operational proof points are also building for hybrid plants that bundle batteries with renewables: the 75 MW/500 MWh Hydra project near De Aar entered operation in July 2026 under a 20-year PPA with Eskom, highlighting a pathway for dispatchable renewable supply that expands demand for lithium-ion systems, EPC services, and long-term O&M capabilities.
Recent Industry Developments
- July 2026: BYD explored establishing localized battery component manufacturing in South Africa, with attention on Blade Battery components following the launch of BYD Finance. The move indicates a deeper localization pathway beyond vehicle sales, linking South Africa's incentive environment to battery-related manufacturing and supply chain development.
- June 2025: Globeleq reached commercial close on the 153 MW/612 MWh Red Sands BESS project in the Northern Cape under the Battery Energy Storage Independent Power Producer Procurement Programme (BESIPPPP). Advancing to commercial close improved delivery visibility for a large utility-scale storage asset, tightening near-term equipment and EPC demand for the BESS segment.
- December 2024: Envision Energy secured a 257 MW/1,028 MWh BESS contract with the EDF-led Oasis Consortium for South African projects scheduled to be operational by end-2026. The award reinforced the role of global BESS OEMs in supplying multi-site IPP programs and supported continued standardization around large-format, utility-scale lithium-ion systems.


Research Methodology Framework and Report Scope
Market Definition and Coverage
For this study, the market means battery revenues generated within South Africa from batteries sold for use across consumer and industrial needs, counted at the point of sale into the country market and expressed in USD.
Scope exclusions: Excludes unrelated power equipment and services such as inverters, solar panels, chargers, installation, and maintenance revenue.
Segmentation Overview
- By Battery Type
- Primary Batteries
- Secondary Batteries
- By Technology
- Lead-acid
- Li-ion
- Nickel-metal hydride
- Nickel-cadmium
- Sodium-sulfur
- Solid-state
- Flow Battery
- Emerging chemistries
- By Application
- Automotive (HEV, PHEV, and EV)
- Industrial (Motive, Stationary (Telecom, UPS, ESS), etc.)
- Portable (Consumer Electronics, etc.)
- Power Tools
- SLI
- Other Applications
Data Sources, Market Sizing, and Validation
Desk Research
Desk research starts with public data that shows how quickly end uses are changing in South Africa, and what that implies for battery demand in value terms. We relied on sources such as Statistics South Africa (Stats SA), the South African Revenue Service trade statistics, the South African Bureau of Standards for referenced product standards, International Energy Agency (IEA) energy indicators, and the International Trade Centre (ITC) Trade Map for trade direction checks.
These inputs are then supported with manufacturer and distributor disclosures like annual reports, investor decks, and public product catalogs, which help us understand shifts by chemistry and use case. Where needed, paid subscriptions were used for company financials and intelligence, news and financials screening, and patent databases to track product and supply chain movement. The desk sources listed here are illustrative, and other public documents and datasets were also used for collection, validation, and clarification.
Primary Interviews and Surveys
Primary work was used to confirm what batteries are actually being bought, where price points are moving, and how supply constraints show up in lead times and availability. We spoke with a mix of manufacturers, importers, distributors, installers, OEM-facing channels, and large end users across industrial and automotive demand. Inputs from these discussions were used to validate desk assumptions on chemistry mix, replacement cycles, and the split between new build and replacement demand.
Distribution of primary research fieldwork respondents
| Company type | Respondent position |
|---|---|
| Top tier: 34% | CXOs: 13% |
| Mid tier: 52% | Functional/Unit leaders: 31% |
| Smaller Players: 14% | Managers: 56% |
Market-Sizing & Forecasting
Sizing starts from a top-down build where import and local production signals are combined with battery use patterns to reconstruct the addressable revenue pool in South Africa. The totals are then checked using selective bottom-up approximations, such as sampled average selling prices times estimated unit demand for key uses, followed by channel discussions to close any obvious gaps.
In the model, a few practical inputs carry most of the weight, including automotive parc and replacement intensity for SLI batteries, industrial backup and telecom power reliability needs, renewable and storage project activity, chemistry-level price movement (especially lead-acid and lithium-ion), and currency timing for imported cells and finished batteries. When data is patchy for smaller applications, we use proxy indicators from trade codes and distributor mix, and then reconcile the implied market shares with interview feedback.
For forecasting, scenario analysis is used so we can reflect different paths for load-shedding intensity, renewable additions, and consumer spending, which are then translated into demand and pricing trajectories. Final growth rates are stress-tested against what suppliers and large buyers expect to see in volumes and realized pricing over the next few years.
Data Validation & Update Cycle
Outputs are validated through consistency checks across multiple angles, so totals align with trade direction, price ranges, and end-use demand signals. If a segment result looks unusual, it is rechecked by comparing implied volumes, replacement cycles, and realistic channel margins, then reviewed by another analyst before sign-off.
The report is refreshed annually, and interim updates are triggered when material events occur, such as sharp currency moves, major policy announcements, or meaningful changes in local supply. Before delivery, we run a final update pass so clients receive the latest view based on the most recent public data and fresh expert feedback.
Mordor Intelligence's South Africa Battery Market Sizing Compared With Other Published Estimates
Published market values for South Africa batteries often do not match because the scope can shift in small but important ways, and because pricing and currency timing assumptions are not always aligned. Differences also show up when one estimate leans more on installed base replacement logic, while another leans more on project announcements or import headlines.
In particular, inverter and solar hardware revenue can be bundled into a battery number, which makes some totals look higher even when battery unit demand is unchanged, and then the gap widens if aggressive storage build-out scenarios are used. Some sources also use a different year for their constant dollar conversion, or they apply a faster price decline curve for lithium-ion without validating realized prices in local channels.
Benchmark comparison
| Source | Market Size | Gaps in Research Methodology |
|---|---|---|
| Mordor Intelligence | USD 1.62 B (2026) | |
| Industry Data Publisher A | USD 1.02 B (2024) | Reports a current value for an earlier year and uses a broader application list that can pull in adjacent power-system spending, which lifts the total when storage projects are discussed. |
| Trade Journal B | USD 1.25 B (2026) | Leans on a narrower set of end uses and applies a faster ASP decline for lithium-ion, which can reduce the value total even if unit volumes grow. |
Inverter and solar kit revenue sits outside Mordor Intelligence's scope, so the market total stays tied to battery sales only, not the full cost of a backup power package. The remaining spread in the table is mainly explained by year alignment, price curve choices by chemistry, and how replacement demand is checked through channel discussions.


Key Questions Answered in the Report
How fast is demand for battery growing in South Africa?
How fast is demand for batteries growing in South Africa?
Which chemistry leads residential solar storage sales?
Lithium-ion, particularly LFP modules from BlueNova, Freedom Won and Tesla, dominates because of high cycle life and compact form factors.
What share did secondary batteries hold in 2025?
Secondary chemistries captured 78.3% of market revenue thanks to lithium-ion adoption in automotive export lines and grid storage.
Why is domestic cell production still limited?
Incentives focus on vehicle assembly rather than cell manufacturing, and investors are deterred by scale uncertainty and grid reliability challenges.
Which province generates the most battery demand?
Gauteng accounts for almost 60% of national revenue due to its concentration of automotive plants, data-center clusters and telecom infrastructure.
How big is the opportunity in mining electrification?
Anglo American alone expects to deploy battery packs exceeding 500 MWh by 2030 as it converts diesel haul fleets to electric power.
Page last updated on:


 Your data is secure and never sold or shared.


