Market Overview
| Study Period | 2021 - 2031 |
|---|---|
| Market Size (2026) | USD 9.54 Billion |
| Market Size (2031) | USD 11.71 Billion |
| Growth Rate (2026 - 2031) | 4.19% CAGR |
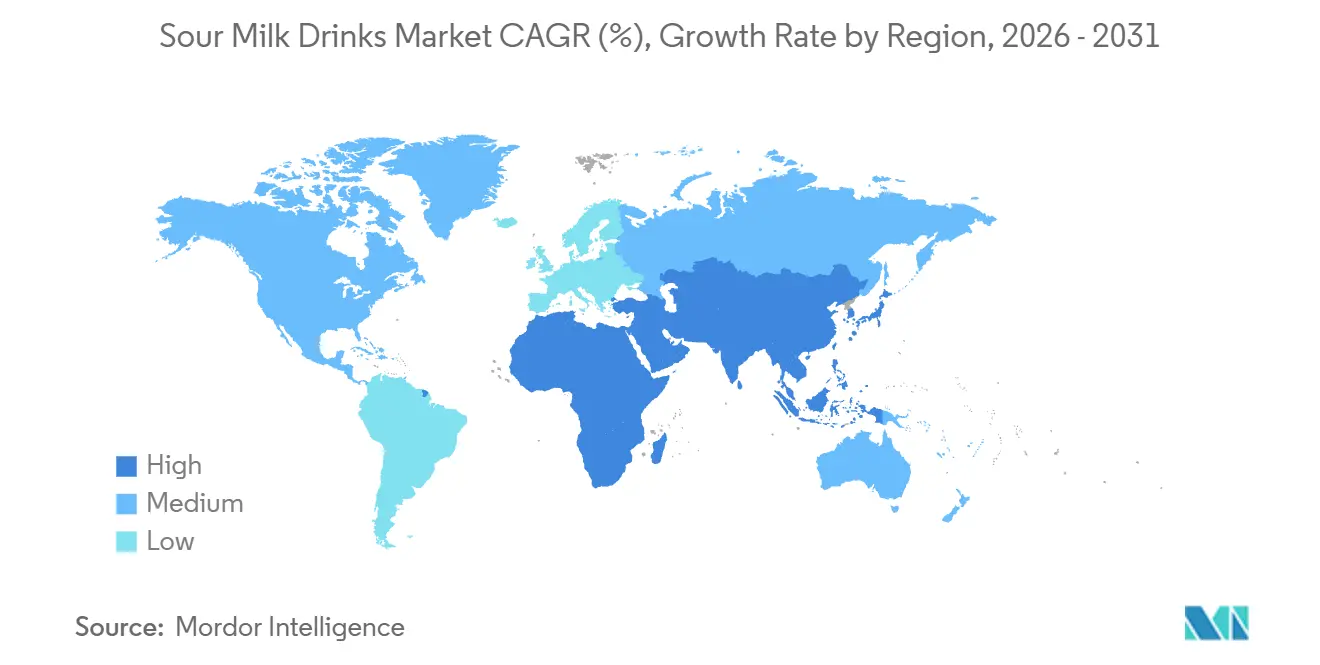
| Fastest Growing Market | Asia Pacific |
| Largest Market | Europe |
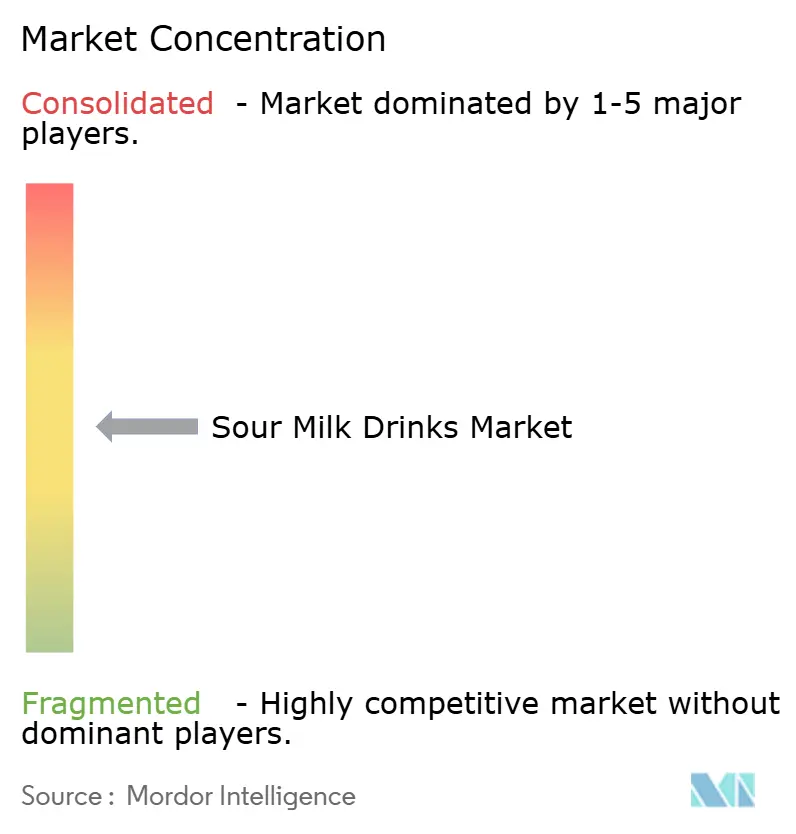
| Market Concentration | Medium |
Major Players *Disclaimer: Major Players sorted in no particular order Image © Mordor Intelligence. Reuse requires attribution under CC BY 4.0. | |
Sour Milk Drinks Market Analysis by Mordor Intelligence
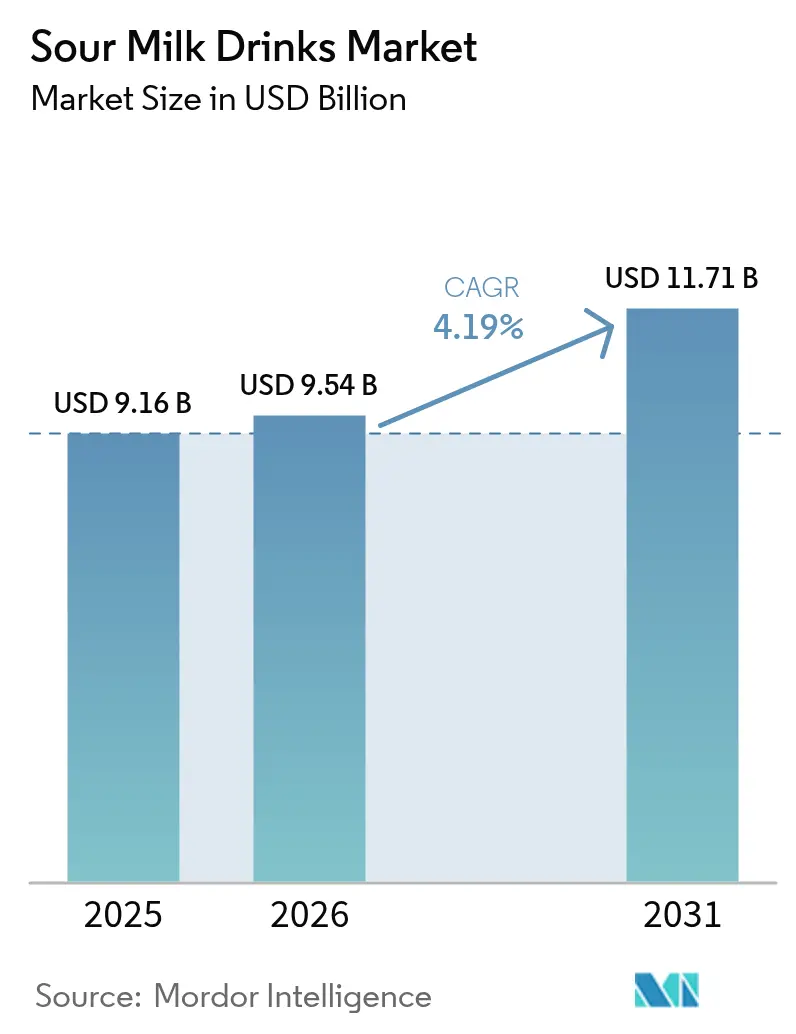
The sour milk drinks market size is projected to expand from USD 9.16 billion in 2025 and USD 9.54 billion in 2026 to USD 11.71 billion by 2031, registering a CAGR of 4.19% between 2026 to 2031. Continuous migration away from sugar-sweetened carbonated drinks, growing acceptance of probiotic health benefits, and corporate investments, such as PepsiCo’s acquisition of Poppi, are driving demand for fermented dairy beverages. Europe continues to lead global revenues due to established kefir consumption habits, while the Asia-Pacific region is experiencing the fastest growth, supported by improved cold-chain infrastructure in China and India. Flavor innovation, including the use of botanicals, spice blends, and savory profiles, supports premium pricing, while aseptic packaging is expanding geographic reach by extending shelf life without compromising live cultures. Growing competition from plant-based fermented beverages is encouraging traditional players to diversify their portfolios, although the high live-culture density in conventional dairy formats remains a significant competitive advantage.
Key Report Takeaways
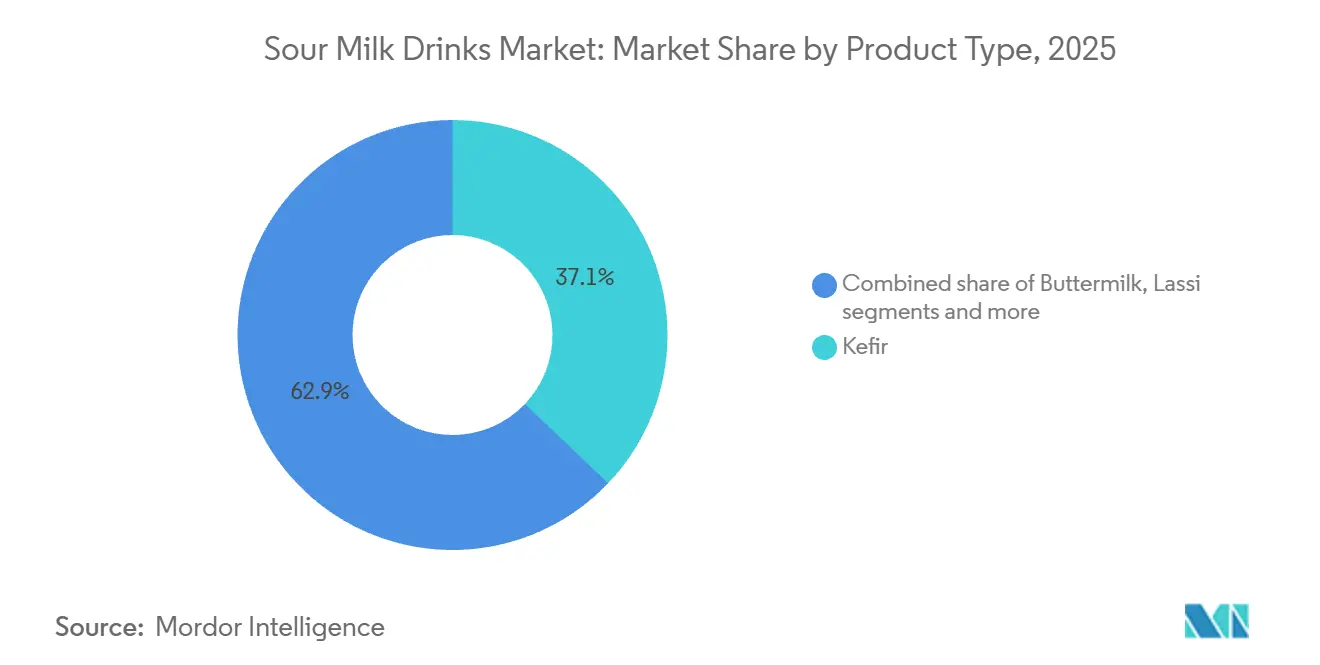
- By product type, kefir led with 37.11% revenue in 2025, while probiotic drinks are projected to deliver the fastest 7.17% CAGR through 2031.
- By flavor, flavored variants secured 63.42% of 2025 sales; unflavored options are expanding more quickly at a 5.98% CAGR to 2031.
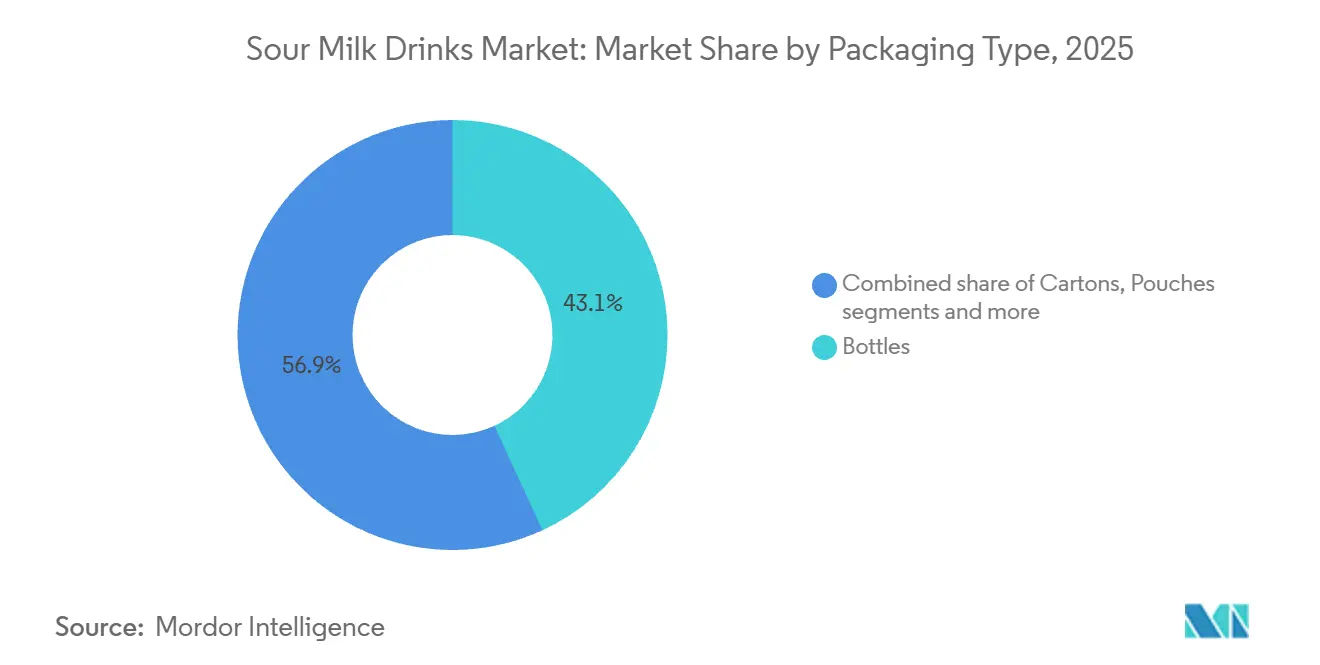
- By packaging, bottles retained 43.13% volume in 2025, yet cartons are accelerating at 6.39% CAGR thanks to aseptic advances.
- By distribution channel, off-trade outlets controlled 80.72% of 2025 value, whereas on-trade venues are growing at 5.71% CAGR as cafés and juice bars curate functional menus.
- By geography, Europe accounted for 57.72% of 2025 global value; Asia-Pacific is forecast to rise at 6.96% CAGR, outpacing all other regions.
Note: Market size and forecast figures in this report are generated using Mordor Intelligence’s proprietary estimation framework, updated with the latest available data and insights as of 2026.
Global Sour Milk Drinks Market Trends and Insights
Drivers Impact Analysis*
| Driver | (~) % Impact on CAGR Forecast | Geographic Relevance | Impact Timeline |
|---|---|---|---|
| Rising consumer focus on gut health and digestive wellness, increasing interest in probiotic beverages | +1.2% | Global, with strongest uptake in North America and Europe | Medium term (2-4 years) |
| Growing awareness of broader health benefits of fermented dairy | +0.9% | Global, particularly Asia-Pacific and Middle East | Long term (≥ 4 years) |
| Shift away from sugar-sweetened carbonated soft drinks toward better-for-you beverages | +0.8% | North America and Europe, emerging in Latin America | Short term (≤ 2 years) |
| Increasing penetration of kefir as mainstream product in Europe and North America | +0.6% | Europe and North America | Medium term (2-4 years) |
| Strong cultural acceptance and routine consumption of lassi, ayran, doogh, and buttermilk | +0.5% | Asia-Pacific, Middle East and Africa | Long term (≥ 4 years) |
| Product innovation in flavors, textures, and fat levels | +0.4% | Global | Short term (≤ 2 years) |
| Source: Mordor Intelligence | |||


Rising consumer focus on gut health and digestive wellness, increasing interest in probiotic beverages
Microbiome science has transitioned from academic research to mainstream wellness discussions, with the majority of consumers showing interest in gut health and 88% reporting familiarity with probiotics as of 2024 [1]Source: International Food Information Council, “2024 Food & Health Survey,” foodinsight.org. This growing awareness is reflected in purchasing behavior, particularly in the functional beverage market, which is largely driven by probiotic-enriched dairy and plant-based drinks. Fermented dairy beverages deliver live Lactobacillus and Bifidobacterium strains that survive gastric transit and colonize the intestinal lumen, influencing immune responses and metabolic pathways. The United States Food and Drug Administration's March 2024 qualified health claim regarding yogurt and its potential to reduce Type 2 diabetes risk provides regulatory support, allowing brands to highlight clinical benefits without risking enforcement actions [2]Source: U.S. Food & Drug Administration, “Qualified Health Claims: Letters of Enforcement Discretion,” fda.gov. Kefir, with its multi-strain composition that often contains over 30 distinct bacterial and yeast species, stands out as a premium choice for consumers seeking greater microbial diversity compared to single-strain supplements.
Growing awareness of broader health benefits of fermented dairy
Clinical evidence highlights benefits that extend beyond digestive health. A meta-analysis published in the Journal of Nutrition in the year 2024 linked the consumption of fermented milk to a significant reduction in the incidence of cardiovascular disease, attributing this outcome to bioactive peptides produced during the fermentation process. Additionally, calcium bioavailability improves as lactose hydrolysis lowers intestinal pH levels, which enhances the absorption of essential nutrients. These diverse health benefits strongly appeal to aging populations in regions such as Europe and North America, driving the adoption of these products in pharmacies and retail outlets that specifically cater to senior citizens. In the Asia-Pacific region, traditional beverages such as lassi, a yogurt-based drink popular in South Asia, and doogh, a fermented dairy beverage commonly consumed in the Middle East, are being reframed as sources of bone-strengthening nutrients. This strategic repositioning integrates these heritage products into modern functional food categories, thereby broadening the market for sour milk drinks.
Shift away from sugar-sweetened carbonated soft drinks toward better-for-you beverages
The United States carbonated soft drink market generated significant revenue in 2024. However, volume sales experienced a decline for the eighth consecutive year as consumers increasingly shifted toward beverages perceived as healthier options. PepsiCo's acquisition of Poppi, a prebiotic soda brand, for a substantial amount in 2024 highlights how major companies are adapting their product portfolios to align with evolving consumer preferences. Fermented dairy beverages hold a strategic position by offering indulgence through creamy textures and a variety of flavor profiles, while also providing functional benefits that carbonated drinks are unable to deliver. Flavored kefir and probiotic drinks compete directly with kombucha and functional waters in refrigerated retail spaces, taking advantage of dairy's well-established cold-chain infrastructure. Furthermore, regulatory pressure on added sugars, such as front-of-pack warning labels in countries including Chile, Mexico, and Uruguay, creates an additional advantage for fermented dairy products. Their natural lactose content and fermentation-derived acidity help reduce the need for added sweeteners.
Increasing penetration of kefir as mainstream product in Europe and North America
Kefir evolved from being an ethnic specialty to becoming a widely accepted refrigerated product in Western markets during the period from 2020 to 2025. This shift was driven by the expansion of retailer categories and the influence of social media campaigns led by prominent individuals. Major grocery retailers in the United States and the United Kingdom now provide dedicated shelf space for kefir alongside yogurt and milk, highlighting the maturity of this category. Lifeway Foods, a key producer of kefir in North America, experienced significant revenue growth in 2024, which was attributed to increased distribution in conventional supermarkets and membership-based warehouse clubs. In Europe, consumption is primarily concentrated in countries such as Germany, France, and the Netherlands, where kefir's Eastern European roots appeal to both immigrant communities and health-conscious individuals. Innovations in product offerings, including options that are low in fat, free of lactose, and certified organic, address a variety of dietary preferences. Additionally, single-serve pouches and drinkable formats provide convenience for consumers with busy lifestyles. This widespread acceptance of kefir contrasts with buttermilk, which remains largely restricted to use in baking applications in North America, despite offering similar probiotic benefits.
Restraints Impact Analysis*
| Restraint | (~) % Impact on CAGR Forecast | Geographic Relevance | Impact Timeline |
|---|---|---|---|
| High storage and preservation costs due to continuous refrigeration | -0.7% | Global, acute in emerging markets with unreliable power grids | Medium term (2-4 years) |
| Competition from plant-based fermented beverages and dairy alternatives | -0.5% | North America and Europe, emerging in Asia-Pacific | Long term (≥ 4 years) |
| Short shelf life and temperature sensitivity leading to wastage | -0.4% | Global, particularly affecting small retailers | Short term (≤ 2 years) |
| Regulatory scrutiny and differing standards around probiotic claims | -0.3% | Europe (EFSA), North America (FDA), fragmented in emerging markets | Long term (≥ 4 years) |
| Source: Mordor Intelligence | |||
High storage and preservation costs due to continuous refrigeration
Fermented dairy beverages require continuous cold-chain maintenance from production to retail display, which significantly increases logistics costs compared to shelf-stable beverages. Refrigerated trucking, cold storage in warehouses, and in-store coolers consume substantial energy, with electricity representing a major portion of cold-chain operating expenses in developed markets. Emerging economies face additional challenges, such as unreliable power grids in regions like India, Nigeria, and Indonesia, which necessitate the use of backup generators. Additionally, fragmented retail landscapes, primarily consisting of small-format stores without modern refrigeration systems, limit the distribution reach of these products. Temperature fluctuations during transit or display can compromise the viability of probiotics and accelerate spoilage, forcing brands to maintain buffer inventory that ties up working capital. Although aseptic packaging technologies, such as ultra-high-temperature processing combined with sterile filling, can extend shelf life to several months without refrigeration, consumer perception often associates ambient-stable dairy products with reduced freshness, which limits broader adoption. This cost structure places fermented dairy beverages at a disadvantage compared to carbonated soft drinks and shelf-stable juices, particularly in markets where price sensitivity is a key factor.
Competition from plant-based fermented beverages and dairy alternatives
Oat-based kefir, coconut yogurt drinks, and almond-milk probiotic beverages captured an estimated eight percent of the fermented beverage market in North America and Europe by the year 2025, rising from a negligible share in the year 2020. These products are designed to meet the needs of lactose-intolerant consumers, vegans, and flexitarians who are looking to reduce their consumption of animal-based products for environmental or ethical reasons. Between the years 2023 and 2025, companies such as Oatly, Chobani, and Danone introduced plant-based fermented product lines. They leveraged their existing distribution networks and brand recognition to promote both dairy and non-dairy product portfolios. Plant-based fermented beverages often come with premium pricing due to the higher costs of ingredients and the specialized processing required. However, they benefit from positive perceptions related to sustainability and allergen-friendliness. Dairy producers face a strategic challenge in this context. Investing in plant-based alternatives risks reducing sales of traditional dairy products, while ignoring this growing segment allows specialized competitors to capture market growth. Hybrid products, such as blends of dairy and oat-based ingredients, provide a potential middle ground. However, these products introduce complexities in labeling and may dilute the distinct positioning of the category.
*Our forecasts treat driver/restraint impacts as directional, not additive. The impact forecasts reflect baseline growth, mix effects, and variable interactions.
Segment Analysis
By Product Type: Probiotic Drinks Outpace Traditional Formats
Kefir accounted for 37.11% of the projected 2025 revenue, reflecting its strong presence in European and North American refrigerated sections. Meanwhile, probiotic drinks are expected to grow at a compound annual growth rate (CAGR) of 7.17% through 2031, driven by brands developing high-colony-forming unit (CFU) formulations aimed at specific health benefits. Probiotic drinks distinguish themselves through strain specificity, such as Lactobacillus rhamnosus GG for immune support and Bifidobacterium lactis for digestive health. These drinks often incorporate prebiotic fibers like inulin to enhance bacterial colonization. Yakult and Actimel were early pioneers in this category during the 1990s, but newer entrants emphasize clean-label formulations and innovative delivery formats, including shot-sized bottles and powder sachets.
Traditional formats like buttermilk and lassi account for the remaining market share. Buttermilk remains primarily used in baking applications in Western markets despite its probiotic properties. Lassi, on the other hand, enjoys high per-capita consumption in India, where companies like Amul and regional dairies offer both sweet and salted variants. However, export volumes of lassi remain limited due to its short shelf life and lack of familiarity in Western retail markets. The "Others" segment includes emerging products such as drinkable quark and fermented whey beverages, which appeal to protein-conscious consumers but face challenges in achieving mainstream market penetration due to limited marketing efforts. Flavor innovation continues to drive premiumization within the kefir category, with options like mango-turmeric and cold-brew coffee gaining popularity. Probiotic drinks are increasingly targeting specific demographics, such as children and seniors, by offering age-specific strain blends and fortified formulations.


By Flavor: Clean-Label Momentum Drives Unflavoured Growth
Flavored variants accounted for 63.42% of projected 2025 sales, while unflavored options are growing at an annual rate of 5.98%, driven by clean-label consumers who avoid added sugars, artificial colors, and flavor enhancers. Unflavored kefir and probiotic drinks are increasingly used in culinary applications, such as smoothies, salad dressings, and baking recipes, broadening their usage beyond direct consumption. The flavor segment includes fruit blends such as strawberry, blueberry, and mango, as well as botanical infusions like elderflower and lavender, which cater to premium-focused consumers.
Savory flavors, including cucumber-dill and beet-ginger, remain niche but are gaining traction in specialty retail and foodservice channels, where chefs explore fermented dairy as a culinary ingredient. Sugar content serves as a key differentiator; naturally sweetened products using stevia, monk fruit, or date syrup command higher price points compared to traditionally sweetened alternatives. Meanwhile, no-added-sugar variants rely on fermentation-derived acidity and fruit purees for flavor. In mature markets, flavor fatigue presents a challenge, prompting retailers to limit stock-keeping unit (SKU) proliferation to optimize shelf space. This forces brands to streamline their portfolios and focus innovation on core flavors with strong sales performance.
By Packaging Type: Aseptic Cartons Gain Share
Bottles are expected to account for 43.13% of the 2025 packaging volume, driven by their resealability and premium perception. However, cartons are anticipated to grow at a rate of 6.39%, supported by aseptic technologies that extend shelf life and reduce the need for refrigeration. Polyethylene terephthalate (PET) bottles dominate single-serve formats due to their transparency, which highlights product quality and facilitates on-shelf differentiation through label design. Glass bottles cater to the ultra-premium segment, appealing to environmentally conscious consumers despite challenges such as higher weight and the risk of breakage.
Cartons, particularly those using Tetra Pak and SIG Combibloc systems, offer multi-layer barriers that protect against oxygen and light, ensuring probiotic viability and flavor integrity for up to 90 days under refrigeration. Pouches, often equipped with spouts or straws, are targeted at pediatric and on-the-go consumers, though their 2025 market share remains limited due to restricted retailer acceptance and consumer concerns regarding product quality. The "Others" category includes packaging formats such as cups, tubs, and bulk containers, which are primarily used in foodservice settings where portion control and dispensing convenience take precedence over packaging aesthetics.
By Distribution Channel: On-Trade Venues Capture Premiumization
Off-trade channels accounted for 80.72% of the distribution in 2025, primarily driven by supermarkets and hypermarkets that offer refrigerated shelf space and promotional support. In contrast, on-trade venues such as cafés, juice bars, and quick-service restaurants recorded a growth rate of 5.71% as operators introduced functional beverage menus. Supermarkets and hypermarkets benefit from high foot traffic and the convenience of one-stop shopping. However, competition from private-label products has intensified as retailers develop their own kefir and probiotic drink brands to increase profit margins. Convenience stores, particularly in urban areas, focus on single-serve formats aimed at commuters and impulse buyers, although limited refrigeration capacity restricts the variety of stock-keeping units.
Online retail, which grew significantly during the COVID-19 pandemic, maintained its momentum through 2025. Subscription models, such as monthly kefir deliveries, have helped build customer loyalty and reduce customer turnover. Specialist retailers, including natural food stores and ethnic grocers, cater to niche segments seeking organic, artisanal, or culturally specific fermented dairy products, though their overall volume remains limited. The "Others" category includes direct-to-consumer channels, farmers' markets, and institutional sales to schools and hospitals.
Geography Analysis
Europe accounted for 57.72% of the global market value in 2025, driven by well-established kefir consumption in countries such as Germany, France, and the Netherlands, where the product is as widely accepted as yogurt. Germany's kefir market benefits from a strong organic food movement and retailer support for functional dairy products. In France, the tradition of fermented dairy products, including crème fraîche and fromage blanc, fosters cultural familiarity, making it easier for consumers to adopt kefir. The Netherlands acts as a production and export hub, with companies like Royal FrieslandCampina and other cooperatives utilizing advanced fermentation technologies and efficient logistics networks. Poland and Sweden are also experiencing significant growth, supported by health-conscious millennials and government nutrition campaigns promoting probiotic intake. However, Europe's mature market status limits volume expansion, with growth primarily dependent on premiumization through organic, grass-fed, and A2 protein variants that command higher price points.
The Asia-Pacific region is expected to grow at a compound annual growth rate (CAGR) of 6.96% through 2031, driven by urbanization in China and India, which has normalized refrigerated dairy logistics and expanded modern retail penetration. In China, the fermented milk market, led by Yili Group and China Mengniu Dairy, reached USD 8.5 billion in 2025, with probiotic drinks positioned as daily wellness rituals rather than occasional treats. In India, lassi consumption remains largely traditional, but companies like Amul and private dairies are increasingly offering Tetra Pak variants that extend shelf life and enable distribution beyond major metropolitan areas. Japan's mature probiotic drink market, dominated by Yakult and Meiji Holdings, emphasizes strain-specific health benefits and pediatric formulations, with per-capita consumption among the highest globally. Indonesia and other Southeast Asian markets present untapped potential, although infrastructure gaps and price sensitivity limit near-term growth. Australia and New Zealand benefit from strong dairy industries and health-conscious populations, with Fonterra Cooperative Group and local brands offering kefir and probiotic drinks in mainstream retail channels.
North America, South America, and the Middle East and Africa collectively represent the remaining share of the global market value. In North America, the United States and Canada are experiencing steady growth, driven by immigrant communities familiar with kefir and ayran, as well as native consumers increasingly adopting functional foods. In Mexico, traditional fermented dairy products such as jocoque and búlgaros provide a cultural foundation for modern probiotic drinks, although fragmented distribution remains a challenge. Brazil, which has the largest dairy market in South America, is witnessing growing interest in kefir and probiotic beverages among urban middle-class consumers, although affordability constraints limit broader penetration.

Competitive Landscape
The global sour milk drinks market is moderately fragmented, characterized by a competitive environment where multinational dairy cooperatives and regional specialists coexist without significant consolidation. Companies such as Nestlé, Groupe Lactalis, and Danone utilize extensive global distribution networks and research and development capabilities to introduce probiotic drinks and kefir variants across diverse markets. Meanwhile, regional players like Gujarat Cooperative Milk Marketing Federation (Amul) in India, Almarai in Saudi Arabia, and Hochwald Foods in Germany leverage local market expertise and cultural connections to maintain their market share.
Strategic approaches vary between premiumization and volume-driven models. Western companies focus on organic certification, grass-fed sourcing, and strain-specific health claims to support premium pricing. In contrast, producers in emerging markets emphasize affordability and ambient-stable packaging to expand rural distribution. Opportunities are emerging in hybrid products such as dairy-oat kefir blends that combine traditional and plant-based elements, and in functional additives like collagen, omega-3 fatty acids, and adaptogens, which position fermented dairy products as wellness solutions beyond gut health. Regulatory compliance, particularly under the European Food Safety Authority (EFSA), plays a critical role in shaping market strategies, as its stringent health-claim substantiation requirements favor established players with the resources to conduct clinical trials [3]Source: European Food Safety Authority, “Nutrition,” efsa.europa.eu.
Technological advancements are centered on fermentation optimization. Precision strain selection and controlled fermentation processes ensure consistent probiotic counts and flavor profiles, addressing the batch variability that has historically challenged artisanal producers. Emerging disruptors include direct-to-consumer (DTC) brands that bypass traditional retail channels, utilizing subscription models and social media marketing to build loyal customer bases around specific health benefits, such as autoimmune support or athletic recovery. These brands often rely on contract manufacturers to reduce capital investment, focusing instead on brand development and customer engagement.
Sour Milk Drinks Industry Leaders
Danone S.A.
Gujarat Co-operative Milk Marketing Federation Ltd (Amul)
Nestlé S.A.
Lactalis Group
Dairy Farmers of America Inc.
- *Disclaimer: Major Players sorted in no particular order

Recent Industry Developments
- August 2025: Lifeway Foods, Inc. has expanded its ProBugs product line by launching ProBugs Kefir made with conventional whole milk, available in three new flavors tailored for children. These products are packaged in the company's signature no-spill pouches.
- April 2025: Müller United Kingdom and Ireland acquired the kefir brand Biotiful Gut Health to enhance its market position and expand its presence in the growing functional health yogurt and drinks segment.
- September 2024: Parle Agro introduced SMOODH Lassi, enhancing its dairy product portfolio. This beverage blends traditional lassi with rose flavoring, catering to consumers looking for a refreshing option for snacks and social gatherings.
- June 2024: Amul launched Kathiyawadi Chaas, a buttermilk variant traditionally consumed in the Saurashtra and Kutch regions of Gujarat. This introduction aligns with Amul's goal of expanding its presence in the buttermilk market.


Global Sour Milk Drinks Market Report Scope
The sour milk drinks market encompasses commercially produced fermented dairy beverages, including kefir, buttermilk, and drinking yogurt. These products are recognized for their tangy flavor, probiotic content, and contribution to digestive and functional health. They are distributed through a variety of retail and foodservice channels. The market is segmented based on product type, which includes kefir, buttermilk, lassi, probiotic drinks, and others; flavor, categorized into flavored and unflavored; packaging type, such as bottles, cartons, pouches, and others; distribution channel, divided into on-trade and off-trade, with off-trade further segmented into supermarkets and hypermarkets, convenience stores, online retail, specialist retailers, and others; and geography, covering North America, Europe, Asia-Pacific, South America, and the Middle East and Africa. The market sizing has been done in value terms in USD and volume in Liters for all the abovementioned segments.
By Product Type
| Kefir |
| Buttermilk |
| Lassi |
| Probiotic Drink |
| Others |
By Flavor
| Flavoured |
| Unflavoured |
By Packaging Type
| Bottles |
| Cartons |
| Pouches |
| Others |
By Distribution Channel
| On-trade | |
| Off-trade | Supermarkets/Hypermarkets |
| Convenience Stores | |
| Online Retail | |
| Specialist Retailers | |
| Others |
By Geography
| North America | United States |
| Canada | |
| Mexico | |
| Rest of North America | |
| Europe | Germany |
| United Kingdom | |
| Italy | |
| France | |
| Spain | |
| Netherlands | |
| Poland | |
| Belgium | |
| Sweden | |
| Rest of Europe | |
| Asia-Pacific | China |
| India | |
| Japan | |
| Australia | |
| Indonesia | |
| Rest of Asia-Pacific | |
| South America | Brazil |
| Argentina | |
| Colombia | |
| Chile | |
| Peru | |
| Rest of South America | |
| Middle East and Africa | South Africa |
| Saudi Arabia | |
| United Arab Emirates | |
| Nigeria | |
| Egypt | |
| Morocco | |
| Turkey | |
| Rest of Middle East and Africa |
| By Product Type | Kefir | |
| Buttermilk | ||
| Lassi | ||
| Probiotic Drink | ||
| Others | ||
| By Flavor | Flavoured | |
| Unflavoured | ||
| By Packaging Type | Bottles | |
| Cartons | ||
| Pouches | ||
| Others | ||
| By Distribution Channel | On-trade | |
| Off-trade | Supermarkets/Hypermarkets | |
| Convenience Stores | ||
| Online Retail | ||
| Specialist Retailers | ||
| Others | ||
| By Geography | North America | United States |
| Canada | ||
| Mexico | ||
| Rest of North America | ||
| Europe | Germany | |
| United Kingdom | ||
| Italy | ||
| France | ||
| Spain | ||
| Netherlands | ||
| Poland | ||
| Belgium | ||
| Sweden | ||
| Rest of Europe | ||
| Asia-Pacific | China | |
| India | ||
| Japan | ||
| Australia | ||
| Indonesia | ||
| Rest of Asia-Pacific | ||
| South America | Brazil | |
| Argentina | ||
| Colombia | ||
| Chile | ||
| Peru | ||
| Rest of South America | ||
| Middle East and Africa | South Africa | |
| Saudi Arabia | ||
| United Arab Emirates | ||
| Nigeria | ||
| Egypt | ||
| Morocco | ||
| Turkey | ||
| Rest of Middle East and Africa | ||


Market Definition
- Butter - Butter is a yellow-to-white solid emulsion of fat globules, water, and inorganic salts produced by churning the cream from cows’ milk
- Dairy - Dairy product include milk and any of the foods made from milk, including butter, cheese, ice cream, yogurt, and condensed and dried milk.
- Frozen Desserts - Frozen dairy dessert means and includes products containing milk or cream and other ingredients which are frozen or semi-frozen prior to consumption, such as ice milk or sherbet, including frozen dairy desserts for special dietary purposes, and sorbet
- Sour Milk Drinks - Sour milk is thick, curdled milk, with a sour taste, obtained from the fermentation of milk. Sour milk drinks such as kefir, laban, buttermilk have been considered in the study
| Keyword | Definition |
|---|---|
| Cultured Butter | Cultured butter is prepared by having the raw butter go through chemical processing and has been added with certain emulsifiers and foreign ingredients. |
| Uncultured Butter | This type of butter is one which has not been processed in any way |
| Natural Cheese | The type of cheese in its most natural form. It is made from natural and simple products and ingredients, including fresh and natural salts, natural colors, enzymes, and high-quality milk. |
| Processed Cheese | Processed cheese undergoes the same processes as natural cheese; however, it requires more steps and many different forms of ingredients. Making processed cheese involves melting natural cheese, emulsifying it, and adding preservatives and other artificial ingredients or colorings. |
| Single Cream | Single cream contains around 18% fat. It’s a single layer of cream that appears over boiled milk. |
| Double Cream | Double cream contains 48% fat, more than double the amount of fat of single cream. It’s heavier and thicker than single cream |
| Whipping Cream | This has a much higher fat percentage than single cream (36%). Used to top cakes, pies, and puddings and as a thickener for sauces, soups, and fillings. |
| Frozen Desserts | Desserts that are meant to be eaten in frozen condition. E.g., sherbets, sorbets, frozen yogurts |
| UHT Milk (Ultra-high temperature milk) | Milk heated at a very high temperature. Ultra-high-temperature processing (UHT) of milk involves heating for 1–8 sec at 135–154°C. which kills the spore-forming pathogenic microorganism, resulting in a product with a shelf-life of several months. |
| Non-dairy butter/Plant-based butter | Butter made from plant-derived oil such as coconut, palm, etc. |
| Non-dairy Yogurt | Yogurt made from typically made from nuts, like almonds, cashews, coconuts, and even other foods like soybeans, plantains, oats, and peas |
| On-trade | It refers to restaurants, QSRs, and bars. |
| Off-trade | It refers to supermarkets, hypermarkets, on-line channels, etc. |
| Neufchatel cheese | One of the oldest kinds of cheese in France. It is a soft, slightly crumbly, mold-ripened, bloomy-rind cheese made in the Neufchâtel-en-Bray region of Normandy. |
| Flexitarian | It refers to a consumer preferring a semi-vegetarian diet, that is centered on plant foods with limited or occasional inclusion of meat. |
| Lactose Intolerance | Lactose intolerance is a reaction in digestive system to lactose, the sugar in milk. It causes uncomfortable symptoms in response to the consumption of dairy products. |
| Cream Cheese | Cream cheese is a soft and creamy fresh cheese with a tangy taste made from milk and cream. |
| Sorbets | Sorbet is a frozen dessert made using ice combined with fruit juice, fruit purée, or other ingredients, such as wine, liqueur, or honey. |
| Sherbet | Sherbet is a sweetened frozen dessert made with fruit and some sort of dairy product such as milk or cream. |
| Shelf stable | Foods that can be safely stored at room temperature, or "on the shelf," for at least one year and do not have to be cooked or refrigerated to eat safely. |
| DSD | Direct Store Delivery is the process in supply chain management wherein the product is delivered from manufacturing plant directly to the retailer. |
| OU Kosher | Orthodox Union Kosher is a kosher certification agency based in New York City. |
| Gelato | Gelato is a frozen creamy dessert made with milk, heavy cream and sugar. |
| Grass-fed Cows | Grass-fed cows are allowed to graze in pastures, where they eat a variety of grasses and clover. |


Research Methodology
Mordor Intelligence follows a four-step methodology in all our reports.
- Step-1: Identify Key Variables: In order to build a robust forecasting methodology, the variables and factors identified in Step 1 are tested against available historical market numbers. Through an iterative process, the variables required for market forecast are set, and the model is built on the basis of these variables.
- Step-2: Build a Market Model: Market-size estimations for the forecast years are in nominal terms. Inflation is not a part of the pricing, and the average selling price (ASP) is kept constant throughout the forecast period for each country.
- Step-3: Validate and Finalize: In this important step, all market numbers, variables, and analyst calls are validated through an extensive network of primary research experts from the market studied. The respondents are selected across levels and functions to generate a holistic picture of the market studied.
- Step-4: Research Outputs: Syndicated Reports, Custom Consulting Assignments, Databases & Subscription Platforms


