Almond Milk Market Size and Share
Market Overview
| Study Period | 2021 - 2031 |
|---|---|
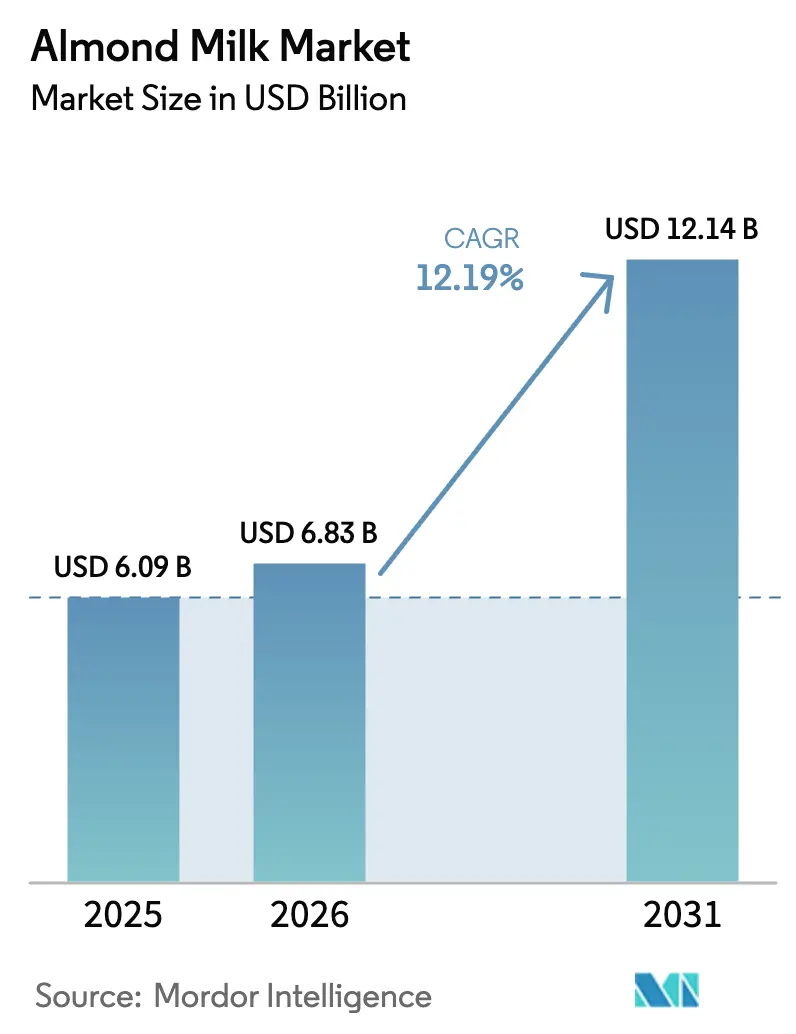
| Market Size (2026) | USD 6.83 Billion |
| Market Size (2031) | USD 12.14 Billion |
| Growth Rate (2026 - 2031) | 12.19% CAGR |
| Fastest Growing Market | Asia Pacific |
| Largest Market | North America |
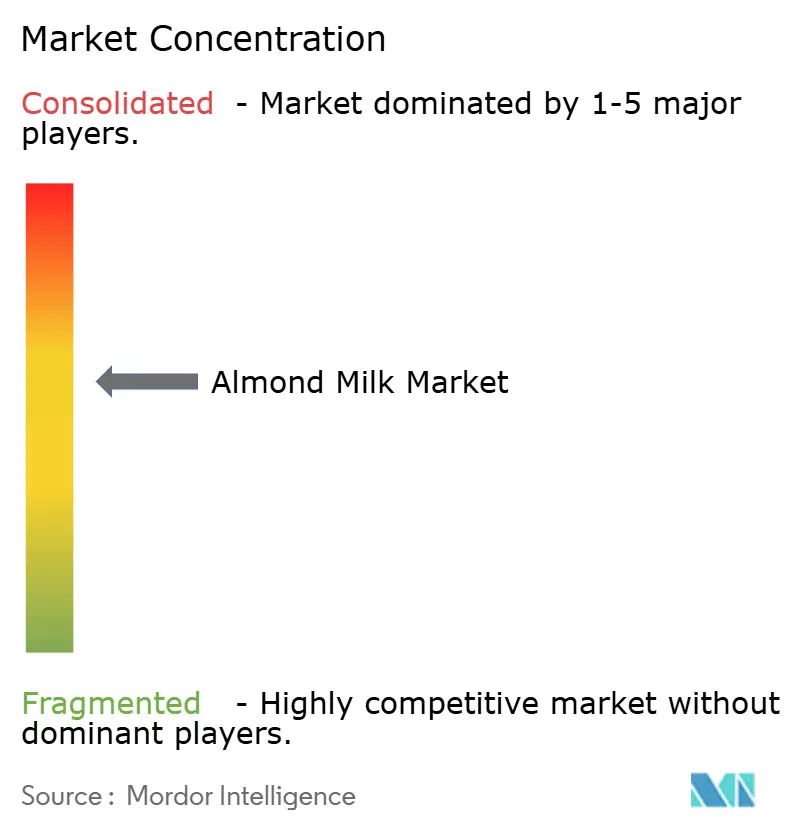
| Market Concentration | Medium |
Major Players *Disclaimer: Major Players sorted in no particular order Image © Mordor Intelligence. Reuse requires attribution under CC BY 4.0. | |
Almond Milk Market Analysis by Mordor Intelligence
The almond milk market size is expected to grow from USD 6.09 billion in 2025 to USD 6.83 billion in 2026 and is forecast to reach USD 12.14 billion by 2031 at 12.19% CAGR over 2026-2031. Consumers are increasingly choosing plant-based beverages as they become more conscious about their health, animal welfare, and environmental impact. The market continues to expand as more people discover their lactose intolerance, experiment with flexible dietary choices, and find almond milk readily available in restaurants and cafes. Manufacturers have introduced improved packaging solutions, such as flat-pack glass and aseptic cartons, which not only make transportation more efficient but also appeal to environmentally conscious consumers. The market structure, characterized by moderate consolidation, creates opportunities for innovative companies to establish themselves through new flavor developments, increased protein content in their products, and carefully planned expansion into new geographical regions.
Key Report Takeaways
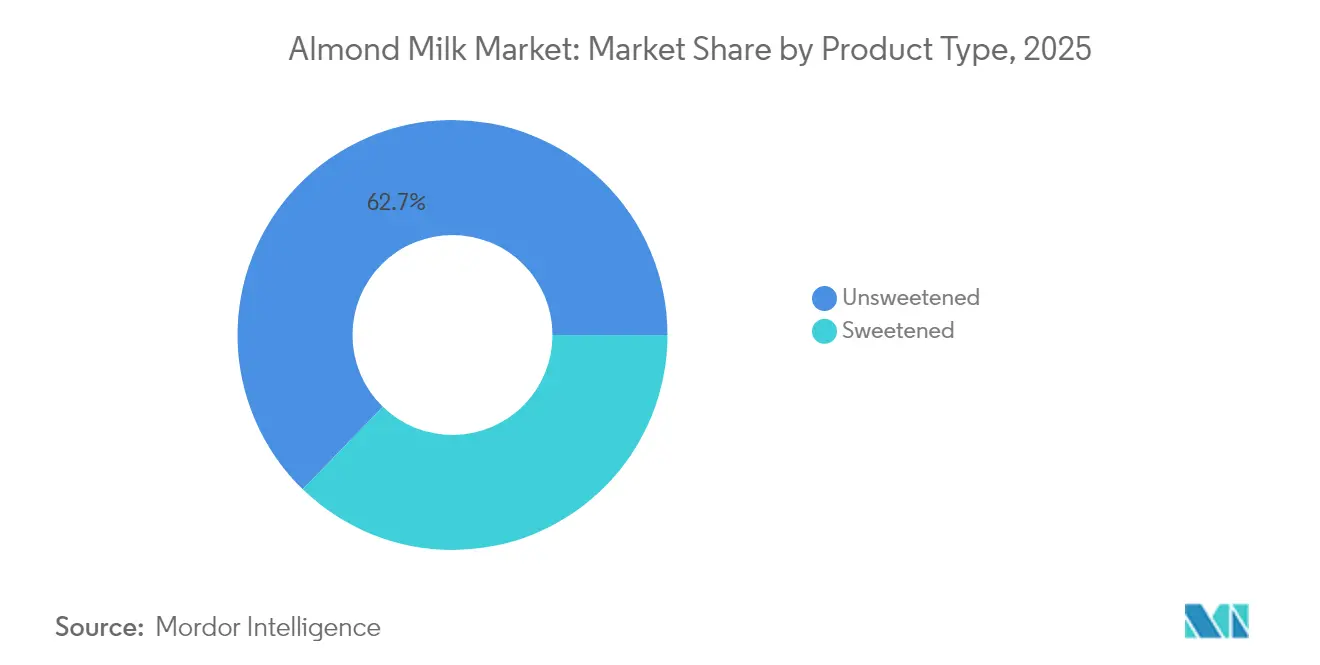
- By product type, unsweetened variants led with 62.74% of almond milk market share in 2025, while sweetened products are on track for a 13.62% CAGR through 2031.
- By packaging type, cartons held 64.10% of the almond milk market size in 2025; glass bottles are projected to climb at a 13.21% CAGR to 2031.
- By flavor, unflavored products accounted for 66.85% of the almond milk market size in 2025 and flavored lines are set to grow at 12.71% CAGR over the same horizon.
- By distribution channel, off-trade captured 77.90% revenue share in 2025, while on-trade is forecast to deliver the fastest 13.75% CAGR to 2031.
- By geography, North America commanded 34.10% almond milk market share in 2025; Asia-Pacific is expanding the fastest at 13.18% CAGR to 2031
Note: Market size and forecast figures in this report are generated using Mordor Intelligence’s proprietary estimation framework, updated with the latest available data and insights as of 2026.
Global Almond Milk Market Trends and Insights
Drivers Impact Analysis*
| Driver | (~) % Impact on CAGR Forecast | Geographic Relevance | Impact Timeline |
|---|---|---|---|
| Growing prevalence of lactose intolerance and milk allergies | +2.1% | Global, with higher impact in Asia-Pacific and MEA | Long term (≥ 4 years) |
| Rising adoption of vegan, flexitarian, and plant-based diets globally | +1.8% | North America & EU core, expanding to APAC | Medium term (2-4 years) |
| Demand for low-calorie, low-fat beverage alternatives | +1.6% | Global, concentrated in developed markets | Medium term (2-4 years) |
| Enhanced shelf life and storage ease compared to conventional dairy | +1.4% | Emerging markets, rural distribution networks | Long term (≥ 4 years) |
| Focus on sustainability and ethical food sourcing among consumers | +1.2% | North America & EU, spreading to urban APAC | Medium term (2-4 years) |
| Inclusion of almond milk in foodservice, cafés, and specialty drinks | +0.9% | Urban centers globally, premium foodservice | Short term (≤ 2 years) |
| Source: Mordor Intelligence | |||


Growing Prevalence of Lactose Intolerance and Milk Allergies
The high prevalence of lactose intolerance among adults worldwide has created a robust market for plant-based alternatives, primarily driven by health requirements rather than lifestyle choices. In the Asia-Pacific region, this condition is especially common, with most East Asian adults unable to digest lactose, unlike their Northern European counterparts. This widespread digestive condition maintains a steady demand for almond milk as an essential alternative. The market further expands due to milk protein allergies in children, prompting parents to seek reliable and nutritious substitutes. Since these alternatives address specific health needs rather than casual preferences, companies can maintain premium pricing while ensuring customer loyalty. In Finland specifically, milk protein allergies affect an estimated 1 in 60,000 newborns, while across East Asia, lactose intolerance impacts up to 90% of the population, with global statistics indicating that about 65% of adults worldwide cannot properly digest lactose [1]Source: Proveg International, “The Plant Milk Report: moving towards a healthy and sustainable diet,” proveg.org.
Rising Adoption of Vegan, Flexitarian, and Plant-Based Diets Globally
The plant-based food market has evolved significantly, moving beyond its traditional vegan consumer base to encompass a broader audience of flexitarian consumers who actively choose to reduce their animal product consumption without completely eliminating it. This fundamental shift has created substantial market expansion opportunities. The transformation is particularly evident among Millennials and Generation Z consumers, who demonstrate increased consciousness about their food choices, placing significant emphasis on environmental sustainability, ethical treatment of animals, and personal health benefits. Market momentum continues to build through widespread social media presence, endorsements from influential public figures, and growing adoption across various institutional channels, including educational institutions, healthcare facilities, and corporate dining environments [2]Source: Metabolic Support, “Lactose Intolerance,” metabolicsupportuk.org. The flexitarian consumer segment emerges as the primary driver of market growth, as these individuals strategically incorporate plant-based options into their regular dietary patterns while maintaining the flexibility to consume conventional products. These consumers exhibit a demonstrated willingness to invest in premium-priced alternatives that deliver comparable taste and nutritional benefits to traditional dairy products, as they conduct direct quality comparisons rather than viewing plant-based options as a compromise.
Demand for Low-Calorie, Low-Fat Beverage Alternatives
The global increase in obesity rates and heightened health consciousness have fundamentally changed how consumers evaluate their beverage choices, with particular attention to caloric content and fat levels. Unsweetened almond milk, containing only 30-50 calories per 8-ounce serving compared to whole milk's 150 calories, has emerged as a practical solution for consumers managing their weight. This substantial caloric difference holds particular significance in developed markets, where obesity rates surpass 30% and consumers actively seek ways to reduce caloric intake while maintaining their regular beverage consumption patterns. The absence of saturated fat in almond milk, contrasting with whole milk's 4.6 grams per serving, addresses growing concerns about cardiovascular health among consumers. The implementation of comprehensive nutritional labeling requirements has empowered consumers to make direct comparisons between beverage options, resulting in informed purchasing decisions that increasingly favor almond milk for its health benefits.
Enhanced Shelf Life and Storage Ease Compared to Conventional Dairy
Shelf-stable almond milk formulations extend storage life to 12-18 months without refrigeration, compared to 5-7 days for fresh dairy milk, creating distribution advantages in emerging markets with limited cold chain infrastructure. This storage stability reduces inventory risks for retailers and enables penetration into rural markets where refrigeration access remains inconsistent. The United Nations Environment Programme identifies cold chain gaps as a critical barrier to dairy distribution in developing economies, where 40-50% of dairy products spoil before reaching consumers etra Pak innovations in aseptic packaging further extend shelf life while maintaining nutritional integrity, enabling global distribution without quality degradation. Temperature stability reduces transportation costs and enables bulk purchasing by consumers, particularly in markets where shopping frequency is constrained by distance or economic factors.
Restraints Impact Analysis*
| Restraint | (~) % Impact on CAGR Forecast | Geographic Relevance | Impact Timeline |
|---|---|---|---|
| Taste and texture acceptance issues in certain consumer segments | -1.3% | Global, particularly in traditional dairy-consuming cultures | Medium term (2-4 years) |
| Allergen concerns—almonds are a tree nut, limiting market for some | -0.8% | Global, regulated markets with allergen labeling requirements | Long term (≥ 4 years) |
| Limited penetration in cultures with high dairy consumption habits | -0.7% | South Asia, Middle East, parts of Europe and Latin America | Long term (≥ 4 years) |
| Transport and storage challenges in emerging markets | -0.5% | Sub-Saharan Africa, rural Latin America, Southeast Asia | Medium term (2-4 years) |
| Source: Mordor Intelligence | |||
Taste and Texture Acceptance Issues in Certain Consumer Segments
Taste and texture differences between almond milk and dairy milk continue to pose significant challenges in consumer adoption. Almond milk's thinner consistency and distinctive flavor characteristics deviate from dairy milk's neutral taste profile and creamy texture, which consumers have come to expect in their daily routines, particularly when using milk in cereal, coffee, and various cooking applications. Consumer research consistently demonstrates that taste and texture remain the primary factors influencing purchasing decisions for plant-based milk alternatives. The substantial difference in protein content between almond milk and traditional dairy milk impacts both the nutritional benefits and cooking performance of the product. While manufacturers implement various solutions, including stabilizers, emulsifiers, and protein fortification to enhance these attributes, such improvements lead to higher production costs and can introduce unexpected flavor variations in the final product.
Allergen Concerns—Almonds are a Tree Nut, Limiting Market for Some
Tree nut allergies affect approximately 0.5-1.0% of the global population, making almond milk consumption unsafe for affected individuals and requiring their households to maintain nut-free environments. Food safety regulations require manufacturers to implement clear allergen labeling protocols, with several regions mandating prominent "Contains Tree Nuts" warnings on packaging, which often leads potential consumers to avoid these products due to perceived health risks. Manufacturing facilities face significant operational challenges when processing multiple allergens, as cross-contamination concerns not only affect consumer safety but also limit production flexibility and increase operational costs [3]Source: U.S. Food & Drug Administration, “Food Allergen Labeling and Consumer Protection Act,” fda.gov. The widespread implementation of nut-free policies in schools and childcare facilities has effectively eliminated these institutional markets, while simultaneously reducing product exposure among young consumers who might otherwise develop preferences for plant-based milk alternatives. These safety-driven restrictions have created substantial barriers to market expansion, particularly in segments focused on vulnerable populations and institutional environments where risk mitigation is a primary concern.
*Our forecasts treat driver/restraint impacts as directional, not additive. The impact forecasts reflect baseline growth, mix effects, and variable interactions.
Segment Analysis
By Product Type: Sweetened Variants Drive Future Growth
Unsweetened almond milk holds a dominant position with a 62.74% market share in 2025. This substantial market presence reflects the increasing number of health-conscious consumers who actively seek products without added sugars to support their dietary requirements and weight management objectives. The growing consumer awareness about the health implications of added sugars has positioned unsweetened almond milk as a preferred choice in the plant-based beverage market.
The sweetened almond milk segment demonstrates strong growth potential, with projections indicating a 13.62% CAGR through 2031. This growth trajectory is primarily attributed to manufacturers investing in research and development to create sophisticated flavor profiles that closely replicate the natural sweetness of traditional dairy milk. The market evolution signals a transition from early adopters, who primarily focused on health benefits, to mainstream consumers who demand products that balance nutritional value with appealing taste characteristics.


By Packaging Type: Glass Innovation Commands Premium
Carton packaging dominates the market with a substantial 64.10% share in 2025. This significant market presence stems from its inherent cost advantages, reliable shelf stability characteristics, and deep integration within existing supply chain networks that facilitate broad market distribution. The industry benefits particularly from Tetra Pak's aseptic carton technology, which provides products with a 12-month shelf life without requiring refrigeration, making it invaluable for global distribution and emerging market access where cold chain infrastructure remains underdeveloped.
Glass bottles are experiencing robust growth with a 13.21% CAGR, carving out an expanding position in premium market segments. This growth trajectory is driven by the material's strong sustainability credentials, superior taste preservation qualities, and reusability features. These attributes resonate strongly with environmentally conscious consumers who demonstrate willingness to invest in products that align with their values, despite the higher price points associated with glass packaging.
By Flavor: Unflavored Foundation Supports Flavored Expansion
Unflavored almond milk maintains its dominant position with a 66.85% market share in 2025, establishing itself as an essential product across various food applications. Its neutral flavor profile makes it particularly suitable for cooking, breakfast cereals, and coffee preparations, offering consumers the versatility they need in their daily routines. The segment's strong market presence reflects consumer behavior, where almond milk primarily functions as a dairy alternative rather than a distinct beverage category. This market dynamic has created a stable foundation, enabling efficient manufacturing processes and supporting the broader market structure.
The flavored segment demonstrates significant growth potential, with projections indicating a 12.71% CAGR through 2031. This growth is fueled by continuous product innovation that has successfully transformed almond milk from a simple dairy substitute into a diverse beverage category. Manufacturers are introducing vanilla, chocolate, and seasonal variants, creating opportunities for product differentiation and premium pricing strategies. These flavored options have successfully attracted consumers who might otherwise avoid plant-based alternatives, expanding the market reach. A notable example is MALK Organics' strategic move into coffee creamer formulations, which demonstrates how targeted product development can effectively compete with traditional dairy-based products in specialized market segments.

By Distribution Channel: Foodservice Integration Accelerates
Off-trade channels dominate the almond milk market with a substantial 77.90% share in 2025, operating through an extensive network of supermarkets, hypermarkets, convenience stores, and online retail platforms. The strategic placement of almond milk products in refrigerated dairy sections across supermarkets effectively positions them as direct alternatives to traditional milk, while carefully planned display arrangements and competitive pricing strategies encourage first-time purchases. The expansion of online retail has transformed purchasing patterns by introducing subscription-based models and bulk buying options, which not only boost regular consumption but also strengthen customer loyalty. These digital platforms serve as valuable information hubs, educating consumers about the nutritional advantages and environmental sustainability of almond milk products.
On-trade channels are experiencing remarkable growth at a 13.75% CAGR, primarily driven by increased integration within the foodservice industry. This channel creates valuable opportunities for consumers to experience almond milk products in social settings, contributing to their mainstream acceptance. A notable example is Califia Farms' strategic approach to the foodservice sector, where they have developed specialized barista formulations. This targeted product development demonstrates how the on-trade channel serves as a crucial platform for building brand recognition and expanding market presence, particularly in the competitive plant-based beverage segment.
Geography Analysis
North America maintains its position as the market leader, commanding a substantial 34.10% share in 2025. This dominance stems from well-established consumer acceptance of plant-based alternatives, backed by sophisticated distribution networks that ensure widespread product availability. The region benefits from robust regulatory frameworks that facilitate product innovation while protecting consumer interests. North American manufacturers leverage their market maturity to successfully position products in premium segments through organic certifications and advanced functional formulations, resulting in higher profit margins compared to conventional alternatives. California's dominant position in almond production provides North American manufacturers with significant supply chain advantages, although ongoing concerns about drought conditions and increasingly stringent water usage regulations pose potential long-term supply risks. The regulatory landscape continues to evolve, as evidenced by Canada's proposed guidelines for plant-based food labeling, which emphasize greater transparency and nutritional disclosure, potentially reshaping marketing practices while building stronger consumer trust through standardized requirements.
The Asia-Pacific region stands out as the most dynamic market, achieving an impressive growth rate of 13.18% CAGR through 2031. This remarkable expansion is fueled by rapid urbanization, substantial increases in middle-class disposable income, and evolving dietary preferences that create significant market opportunities. China emerges as the primary growth engine in the region, with urban consumers increasingly prioritizing food safety, environmental sustainability, and health benefits in their purchasing decisions, despite higher price points compared to traditional dairy products. India presents a unique market landscape, characterized by high rates of lactose intolerance coupled with deep-rooted cultural connections to dairy products, requiring carefully crafted market strategies that respect traditional preferences while addressing specific functional needs. The region's exceptional growth potential has attracted substantial investments, with companies actively expanding their manufacturing capabilities and distribution networks to establish strong market positions during this crucial adoption phase.
Europe, South America, and Middle East & Africa represent diverse market opportunities, each requiring carefully tailored approaches to market development. European markets demonstrate strong environmental consciousness that aligns well with sustainability-focused messaging, although deeply ingrained dairy traditions necessitate a gradual approach to market development rather than rapid product substitution. South American markets, particularly in urban centers, show increasing receptiveness to plant-based alternatives, driven by rising disposable incomes and growing awareness of global dietary trends. However, market penetration in rural areas remains challenged by distribution limitations and higher import-related costs, creating a distinct urban-rural market divide that requires strategic consideration for effective market expansion.


Competitive Landscape
The almond milk market maintains a moderate concentration, where established companies benefit from scale advantages while specialty brands carve out niches through premium products, organic certifications, and functional formulations. Major players like Danone use their broad product range and strong distribution channels to serve mainstream consumers, generating EUR 6.785 billion from their Essential Dairy & Plant-Based division in H1 2024, even while managing challenges such as a Silk product recall that affected their supply chain operations.
Blue Diamond Growers has built a strong market position through its end-to-end control from almond farming to distribution, enabling efficient private label and branded product strategies. Newer companies are making their mark through innovative approaches and premium positioning, with Califia Farms growing through strategic business purchases and partnerships with food service providers to build consumer awareness. SunOpta's investment of USD 26 million in its Modesto facility shows confidence in future market growth while adding to available market supply.
Companies are setting themselves apart by embracing new technologies for better product formulations, modern packaging solutions like flat-pack formats, and improved processing methods that enhance product quality. The market shows promise in developing regions, specialized products for baristas, and functional beverages that meet specific health and dietary requirements beyond simple dairy replacement options.
Almond Milk Industry Leaders
Blue Diamond Growers
Califia Farms LLC
Campbell Soup Company
Danone SA
Ecotone
- *Disclaimer: Major Players sorted in no particular order

Recent Industry Developments
- September 2024: Glico has launched Almond Koka, Japan’s best-selling almond milk, in Singapore, marking its entry into the Southeast Asian almond milk market. This expansion responds to rising demand for nutritious plant-based beverages among regional health-conscious consumers.
- July 2024: Califia Farms has expanded its plant-based milk portfolio by introducing two new varieties, further strengthening its presence in the almond milk market and catering to rising consumer demand for innovative dairy alternatives.
- February 2024: Califia Farms has launched Califia Farms Complete, a plant-based milk nutritionally comparable to dairy, expanding options in the almond milk market and highlighting consumer health trends, protein focus, and innovation in plant-based beverages for U.S. retail.


Global Almond Milk Market Report Scope
| Sweetened |
| Unsweetened |
| Carton |
| Plastic Bottle |
| Glass Bottle |
| Others |
| Flavored |
| Un-Flavored |
| Off-Trade | Convenience Stores |
| Online Retail | |
| Specialist Retailers | |
| Supermarkets and Hypermarkets | |
| Others | |
| On-Trade |
| North America | United States |
| Canada | |
| Mexico | |
| Rest of North America | |
| Europe | Germany |
| United Kingdom | |
| Italy | |
| France | |
| Spain | |
| Netherlands | |
| Poland | |
| Belgium | |
| Sweden | |
| Rest of Europe | |
| Asia-Pacific | China |
| India | |
| Japan | |
| Australia | |
| Indonesia | |
| South Korea | |
| Thailand | |
| Singapore | |
| Rest of Asia-Pacific | |
| South America | Brazil |
| Argentina | |
| Colombia | |
| Chile | |
| Peru | |
| Rest of South America | |
| Middle East and Africa | South Africa |
| Saudi Arabia | |
| United Arab Emirates | |
| Nigeria | |
| Egypt | |
| Morocco | |
| Turkey | |
| Rest of Middle East and Africa |
| By Product Type | Sweetened | |
| Unsweetened | ||
| By Packaging Type | Carton | |
| Plastic Bottle | ||
| Glass Bottle | ||
| Others | ||
| By Flavor | Flavored | |
| Un-Flavored | ||
| By Distribution Channel | Off-Trade | Convenience Stores |
| Online Retail | ||
| Specialist Retailers | ||
| Supermarkets and Hypermarkets | ||
| Others | ||
| On-Trade | ||
| By Geography | North America | United States |
| Canada | ||
| Mexico | ||
| Rest of North America | ||
| Europe | Germany | |
| United Kingdom | ||
| Italy | ||
| France | ||
| Spain | ||
| Netherlands | ||
| Poland | ||
| Belgium | ||
| Sweden | ||
| Rest of Europe | ||
| Asia-Pacific | China | |
| India | ||
| Japan | ||
| Australia | ||
| Indonesia | ||
| South Korea | ||
| Thailand | ||
| Singapore | ||
| Rest of Asia-Pacific | ||
| South America | Brazil | |
| Argentina | ||
| Colombia | ||
| Chile | ||
| Peru | ||
| Rest of South America | ||
| Middle East and Africa | South Africa | |
| Saudi Arabia | ||
| United Arab Emirates | ||
| Nigeria | ||
| Egypt | ||
| Morocco | ||
| Turkey | ||
| Rest of Middle East and Africa | ||


Market Definition
- Dairy Alternatives - Dairy alternatives are foods that are made from plant-based milk/oils instead of their usual animal products, such as cheese, butter, milk, ice cream, yogurt, etc. Plant-based or non-dairy milk alternative is the fast-growing segment in the newer food product development category of functional and specialty beverage across the globe.
- Non-Dairy Butter - Non dairy butter is a vegan butter alternative that is made from a mixture of plant oils. With an increase in alternative diets like vegetarianism, veganism, and gluten intolerance, plant butter is a healthy non-dairy substitute for normal butter.
- Non-Dairy Ice Cream - Plant based ice cream is a growing category. Non-dairy ice cream is a type of dessert made without any animal ingredients. This is typically considered a substitute for regular ice cream for those who cannot or do not eat animal or animal-derived products, including eggs, milk, cream, or honey.
- Plant-Based Milk - Plant based milks are milk substitutes that are made from nuts (e.g., hazelnuts, hemp seeds), seeds (e.g., sesame, walnuts, coconuts, cashews, almonds, rice, oats, etc.) or legumes (e.g., soy). Plant-based milk such as soy milk and almond milk have been popular in East Asia and the Middle East for centuries.
| Keyword | Definition |
|---|---|
| Cultured Butter | Cultured butter is prepared by having the raw butter go through chemical processing and has been added with certain emulsifiers and foreign ingredients. |
| Uncultured Butter | This type of butter is one which has not been processed in any way |
| Natural Cheese | The type of cheese in its most natural form. It is made from natural and simple products and ingredients, including fresh and natural salts, natural colors, enzymes, and high-quality milk. |
| Processed Cheese | Processed cheese undergoes the same processes as natural cheese; however, it requires more steps and many different forms of ingredients. Making processed cheese involves melting natural cheese, emulsifying it, and adding preservatives and other artificial ingredients or colorings. |
| Single Cream | Single cream contains around 18% fat. It’s a single layer of cream that appears over boiled milk. |
| Double Cream | Double cream contains 48% fat, more than double the amount of fat of single cream. It’s heavier and thicker than single cream |
| Whipping Cream | This has a much higher fat percentage than single cream (36%). Used to top cakes, pies, and puddings and as a thickener for sauces, soups, and fillings. |
| Frozen Desserts | Desserts that are meant to be eaten in frozen condition. E.g., sherbets, sorbets, frozen yogurts |
| UHT Milk (Ultra-high temperature milk) | Milk heated at a very high temperature. Ultra-high-temperature processing (UHT) of milk involves heating for 1–8 sec at 135–154°C. which kills the spore-forming pathogenic microorganism, resulting in a product with a shelf-life of several months. |
| Non-dairy butter/Plant-based butter | Butter made from plant-derived oil such as coconut, palm, etc. |
| Non-dairy Yogurt | Yogurt made from typically made from nuts, like almonds, cashews, coconuts, and even other foods like soybeans, plantains, oats, and peas |
| On-trade | It refers to restaurants, QSRs, and bars. |
| Off-trade | It refers to supermarkets, hypermarkets, on-line channels, etc. |
| Neufchatel cheese | One of the oldest kinds of cheese in France. It is a soft, slightly crumbly, mold-ripened, bloomy-rind cheese made in the Neufchâtel-en-Bray region of Normandy. |
| Flexitarian | It refers to a consumer preferring a semi-vegetarian diet, that is centered on plant foods with limited or occasional inclusion of meat. |
| Lactose Intolerance | Lactose intolerance is a reaction in digestive system to lactose, the sugar in milk. It causes uncomfortable symptoms in response to the consumption of dairy products. |
| Cream Cheese | Cream cheese is a soft and creamy fresh cheese with a tangy taste made from milk and cream. |
| Sorbets | Sorbet is a frozen dessert made using ice combined with fruit juice, fruit purée, or other ingredients, such as wine, liqueur, or honey. |
| Sherbet | Sherbet is a sweetened frozen dessert made with fruit and some sort of dairy product such as milk or cream. |
| Shelf stable | Foods that can be safely stored at room temperature, or "on the shelf," for at least one year and do not have to be cooked or refrigerated to eat safely. |
| DSD | Direct Store Delivery is the process in supply chain management wherein the product is delivered from manufacturing plant directly to the retailer. |
| OU Kosher | Orthodox Union Kosher is a kosher certification agency based in New York City. |
| Gelato | Gelato is a frozen creamy dessert made with milk, heavy cream and sugar. |
| Grass-fed Cows | Grass-fed cows are allowed to graze in pastures, where they eat a variety of grasses and clover. |


Research Methodology
Mordor Intelligence follows a four-step methodology in all our reports.
- Step-1: Identify Key Variables: In order to build a robust forecasting methodology, the variables and factors identified in Step 1 are tested against available historical market numbers. Through an iterative process, the variables required for market forecast are set, and the model is built on the basis of these variables.
- Step-2: Build a Market Model: Market-size estimations for the forecast years are in nominal terms. Inflation is not a part of the pricing, and the average selling price (ASP) is kept constant throughout the forecast period for each country.
- Step-3: Validate and Finalize: In this important step, all market numbers, variables, and analyst calls are validated through an extensive network of primary research experts from the market studied. The respondents are selected across levels and functions to generate a holistic picture of the market studied.
- Step-4: Research Outputs: Syndicated Reports, Custom Consulting Assignments, Databases & Subscription Platforms


