
Market Overview
| Study Period | 2021 - 2031 |
|---|---|
| Forecast Data Period | 2026 - 2031 |
| Base Year Market Size (2025) | USD 2.98 Billion |
| Market Size (2026) | USD 3.12 Billion |
| Market Size (2031) | USD 4.18 Billion |
| Growth Rate (2026 - 2031) | 6.01 % |
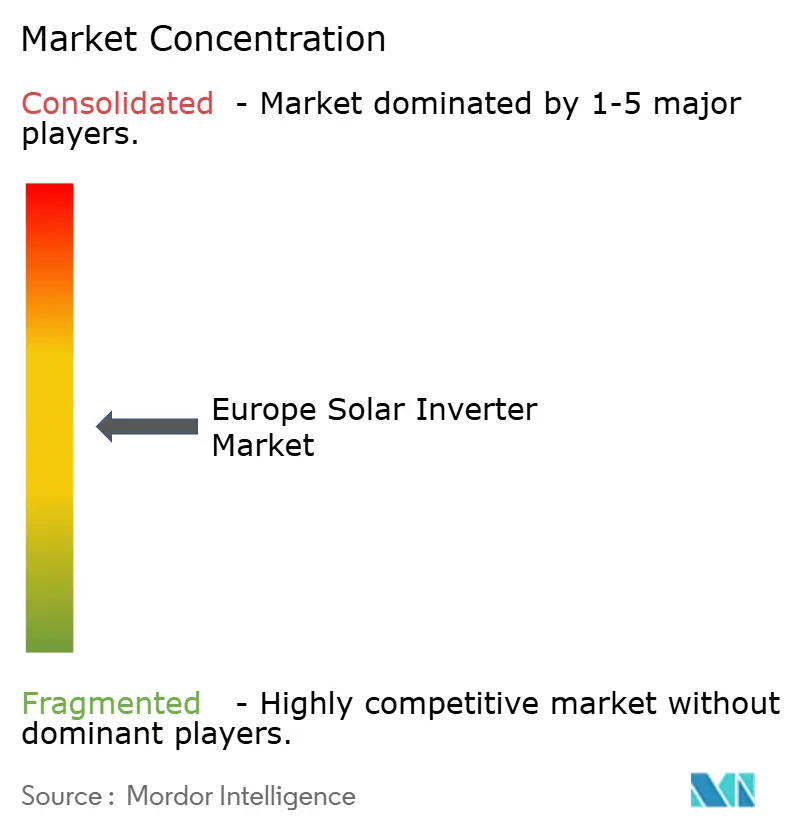
| Market Concentration | Medium |
Major Players *Disclaimer: Major Players sorted in no particular order Image © Mordor Intelligence. Reuse requires attribution under CC BY 4.0. | |
Europe Solar Inverter Market Analysis by Mordor Intelligence
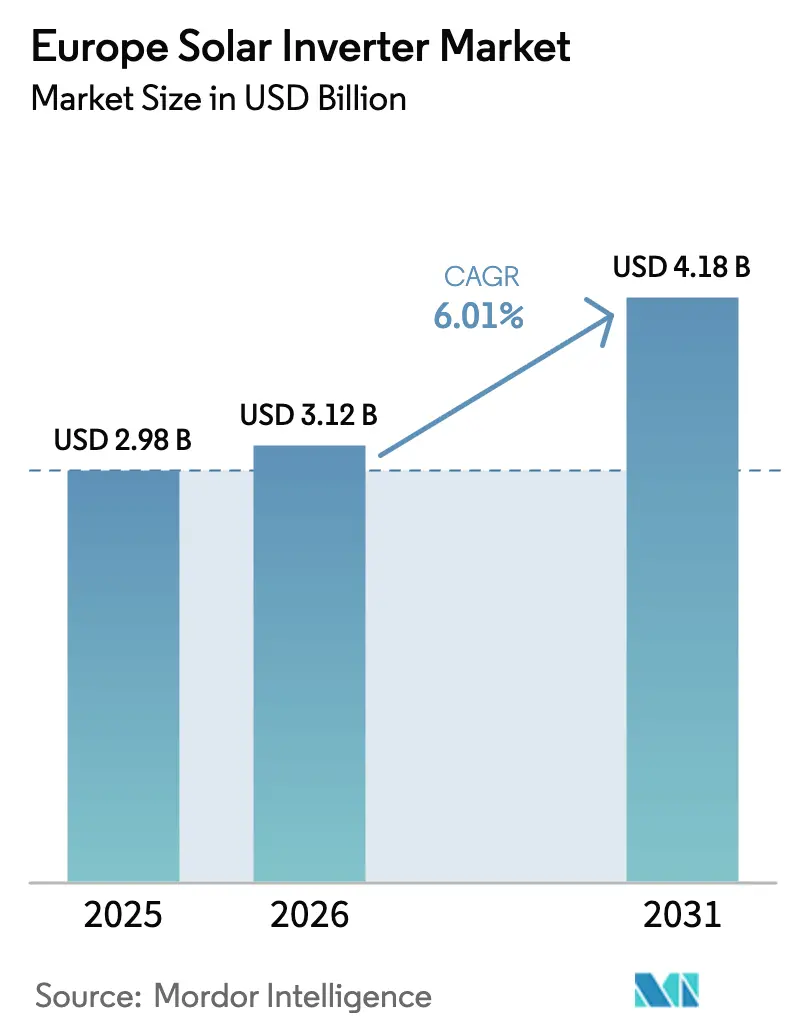
The Europe Solar Inverter Market size is expected to increase from USD 2.98 billion in 2025 to USD 3.12 billion in 2026 and reach USD 4.18 billion by 2031, growing at a CAGR of 6.01% over 2026-2031.
The surge reflects accelerated photovoltaic build-out under REPowerEU, the continued rooftop boom fed by high retail electricity prices, and a regulatory pivot toward grid-forming functionality that is reshaping product design and supplier strategies. Central inverters retained dominance because of Spain’s and Portugal’s utility-scale pipelines, while microinverters gained momentum in shade-prone northern roofs. Semiconductor supply constraints moderated price erosion but did not derail demand, as suppliers re-tooled firmware to comply with ENTSO-E’s 2026 grid-forming mandates. Competitive intensity stayed moderate; the top five firms captured roughly 55-60% revenue, leaving space for cost-driven Chinese challengers and software-oriented niche specialists.
Key Report Takeaways
- By inverter type, central inverters led with 48.6% revenue share in 2025; microinverters are projected to expand at a 7.3% CAGR through 2031.
- By phase, three-phase products accounted for 73.4% of demand in 2025; single-phase units will rise at a 6.4% CAGR, mirroring the rooftop surge.
- By connection type, on-grid designs held 80.7% share in 2025, whereas off-grid inverters are forecast to climb at a 7.7% CAGR as islanded microgrids gain traction.
- By application, utility-scale systems commanded 59.1% of the European solar inverters market share in 2025, while residential installations are expected to grow at a 6.8% CAGR during the forecast period.
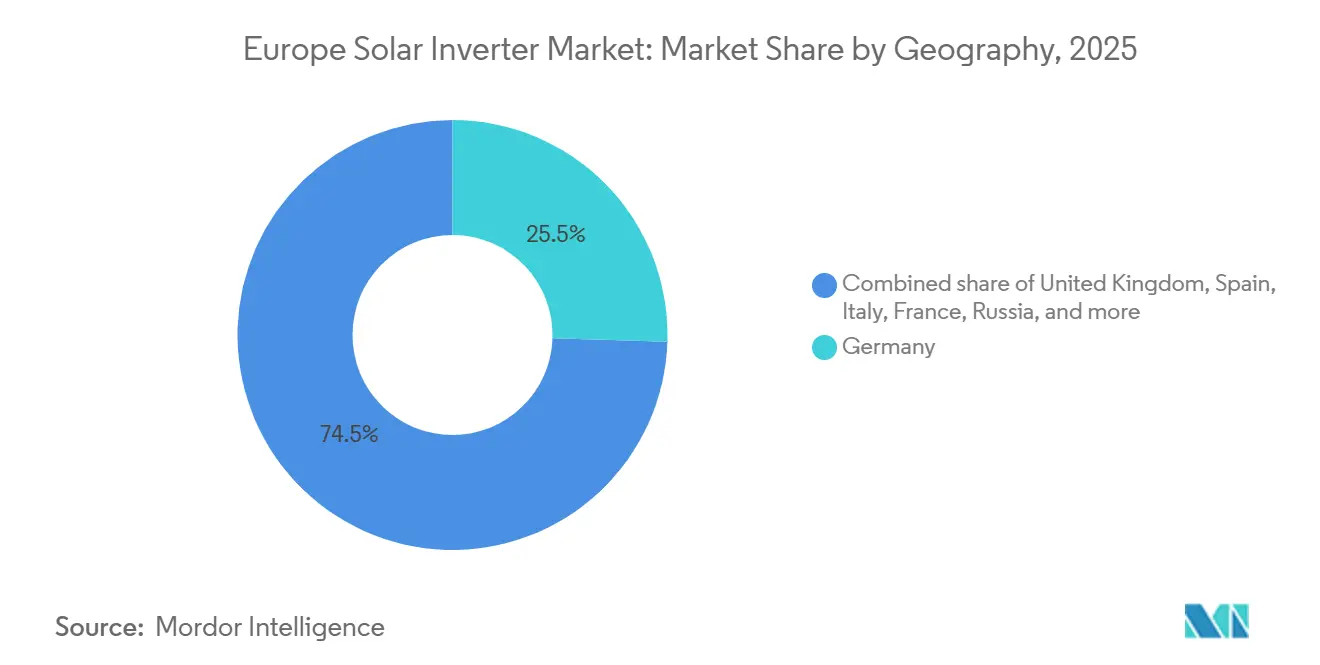
- By geography, Germany captured 25.5% revenue in 2025; Italy is poised for the fastest 11.1% CAGR thanks to streamlined permitting and record 2024 additions.
Note: Market size and forecast figures in this report are generated using Mordor Intelligence’s proprietary estimation framework, updated with the latest available data and insights as of January 2026.
Market Trends and Insights
Drivers Impact Analysis of Europe Solar Inverter Market*
| Driver | (~) % Impact on CAGR Forecast | Geographic Relevance | Impact Timeline |
|---|---|---|---|
| EU Fit-for-55 & REPowerEU deployment targets | 1.80% | EU-wide, led by Germany, Spain, Italy, France | Medium term (2-4 years) |
| Rooftop self-consumption boom amid high retail electricity prices | 1.50% | Germany, Netherlands, Belgium, Denmark | Short term (≤ 2 years) |
| Declining $/W of string & hybrid inverters | 1.20% | Southern and Eastern Europe | Medium term (2-4 years) |
| Utility-scale PPA pipeline acceleration across Spain, Portugal & Greece | 1.00% | Iberian Peninsula, Greece | Medium term (2-4 years) |
| Mandatory grid-forming “smart inverter” codes (NC RfG 2026 update) | 0.60% | Germany, Netherlands, France, Italy | Long term (≥ 4 years) |
| IPCEI-backed reshoring of European inverter manufacturing | 0.40% | Germany, France, Italy, Spain | Long term (≥ 4 years) |
| Source: Mordor Intelligence | |||
EU Fit-for-55 & REPowerEU Deployment Targets
Binding 42.5% renewable-energy legislation and the EU Solar Strategy lift average annual installations to 60-70 GW, more than double the 2019-2023 pace.[1] Faster rooftop approvals under Council Regulation 2022/2577 compressed permitting to three months, steering demand toward string and microinverters. Germany added 14.6 GW and Italy 5.3 GW in 2024, underscoring early policy traction.[2] The Iberian pipeline illustrates geographic concentration where high irradiance and PPAs intersect. Collectively, these factors underpin the 6.01% CAGR projected for the European solar inverters market.
Rooftop Self-Consumption Boom Amid High Retail Electricity Prices
EU household tariffs averaged EUR 0.28 per kWh in 2025, about 40% above pre-2021 levels, sustaining sub-7-year payback for solar-plus-storage.[3] Germany’s EUR 0.32 per kWh retail price drove a rooftop wave that relied on hybrid inverters capable of battery arbitrage. The Netherlands accelerated battery adoption by phasing out net metering in 2025.[4] Microinverters benefited from shade mitigation in dense urban roofs, while software features such as dynamic tariff response became key differentiators. The residential up-trend explains why the European solar inverters market is tilting toward premium, software-rich products.
Declining $/W of String & Hybrid Inverters
Average selling prices for 10-50 kW string units fell from USD 0.12 to USD 0.10 per watt between 2023 and 2025 as Chinese scale-up improved silicon-carbide yields. Hybrid models saw even steeper drops, narrowing the cost gap versus basic string devices and lifting attach rates for residential batteries. Price erosion expanded access in Southern and Eastern Europe, where project IRRs are tight. Western incumbents countered margin pressure by emphasizing grid services and long warranties. Notably, grid-forming variants still carry an 8-12% premium, reflecting higher-rated power electronics.
Utility-Scale PPA Pipeline Acceleration Across Spain, Portugal & Greece
Spain’s 62 GW pipeline and Portugal’s successive auctions create a deep order book through 2031. Central inverters benefit from low balance-of-system cost at scale, yet developers increasingly specify 100-250 kW string units to optimize bifacial tracker arrays. Greece’s National Energy and Climate Plan lifts solar ambition to 7.7 GW by 2030. PPA structures with partial merchant exposure reward advanced inverter controls that enhance capture rates, favoring suppliers with proven ancillary-service firmware. The European solar inverters market, therefore, rewards both low-cost central architectures and premium string solutions that unlock grid-service revenue.
Restraints Impact Analysis of Europe Solar Inverter Market*
| Restraint | (~) % Impact on CAGR Forecast | Geographic Relevance | Impact Timeline |
|---|---|---|---|
| Semiconductor supply bottlenecks for IGBTs & SiC MOSFETs | -0.9% | EU-wide, with acute effects in Germany, France, Italy (high-volume markets) | Short term (≤ 2 years) |
| Grid-connection delays & curtailment risks in DE/NL/IT | -0.7% | Germany, Netherlands, Italy (high-penetration grids) | Medium term (2-4 years) |
| Cyber-security scrutiny on imported inverters (ENISA guidelines) | -0.4% | EU-wide, particularly affecting non-EU manufacturers and importers | Medium term (2-4 years) |
| Sunset of net-metering incentives in key markets | -0.5% | Netherlands, Belgium, Austria, with potential spillover to Denmark and Sweden | Short term (≤ 2 years) |
| Source: Mordor Intelligence | |||
Semiconductor Supply Bottlenecks for IGBTs & SiC MOSFETs
Lead times for 1200 V SiC devices averaged 26-32 weeks in 2025, double pre-pandemic norms, as electric-vehicle demand competed for wafers. SMA reported shipment delays totalling 1.5 GW in its 2024 filings. Substituting lower-spec IGBTs reduces efficiency and raises thermal losses, squeezing project margins. New fabs from Infineon and Wolfspeed will ease scarcity after 2027, but short-term friction persists, trimming expected growth in the European solar inverters market.
Grid-Connection Delays & Curtailment Risks in DE/NL/IT
Germany’s connection queue exceeded 40 GW in 2025, with average waits of 18-24 months, while curtailment hit 8.2 TWh in 2024. Similar bottlenecks plague the Netherlands and Italy, where transmission upgrades lag generation growth. A 10% curtailment rate can shave 150 basis points off project IRR, discouraging near-term procurement. Developers respond by co-locating batteries, which favors hybrid inverters, yet connection uncertainty tempers the overall European solar inverters market expansion in congested regions.
*Our forecasts treat driver/restraint impacts as directional, not additive. The impact forecasts reflect baseline growth, mix effects, and variable interactions.
Europe Solar Inverter Market Segment Analysis
By Inverter Type:
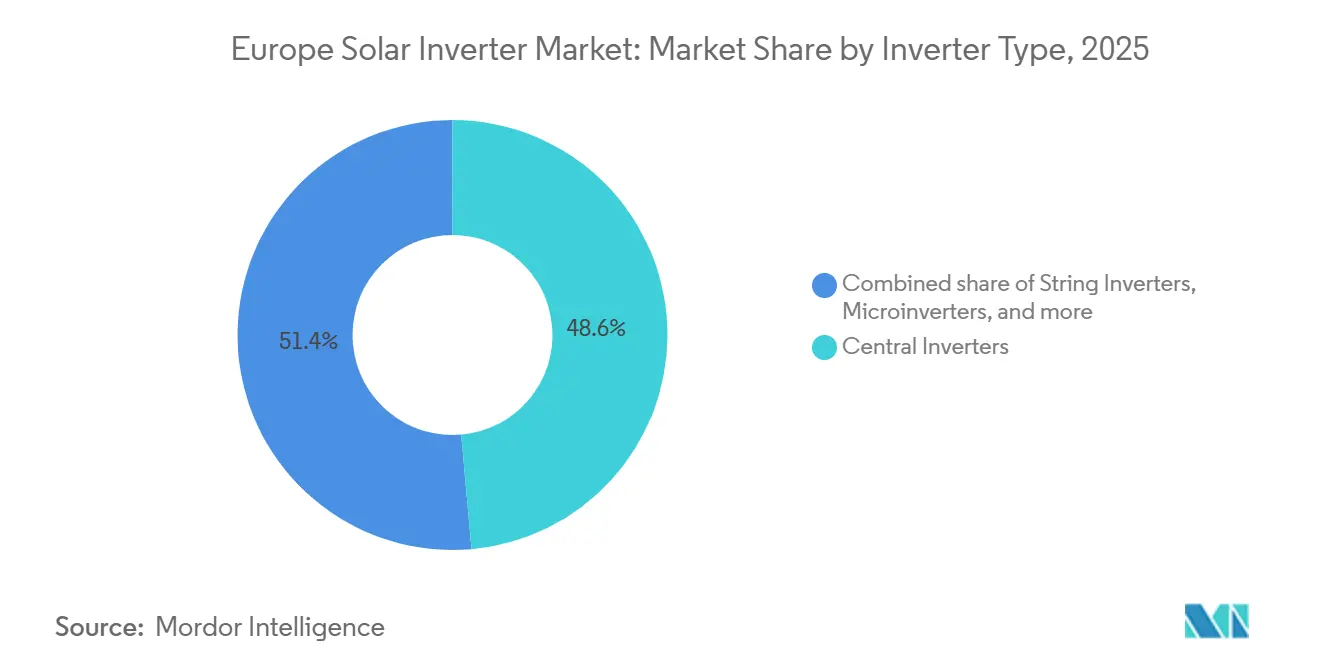
Central Dominance Meets Microinverter MomentumCentral units controlled 48.6% of 2025 revenue, riding Spain’s and Portugal’s utility pipelines where single 1-5 MW blocks minimize balance-of-system expense. String designs, at roughly 35% share, gained in commercial rooftops and terrain-complex solar fields that need finer MPPT granularity. Hybrid variants lifted their slice amid rising prosumer storage demand. Microinverters held just under 10% but will outpace all others at a 7.3% CAGR through 2031 as rooftops in Germany and the Netherlands favor module-level optimization.
Regulation magnifies differentiation. Grid-forming mandates above 1 MW threaten legacy central designs that lack virtual-synchronous capability, steering developers toward compliant string products or next-generation central architectures. Microinverters remain exempt due to small unit size, yet benefit from heightened safety codes that require rapid shutdown and arc-fault detection. Consequently, the European solar inverters market rewards suppliers able to juggle cost-competitive central units and premium micro or hybrid lines with advanced firmware.

By Phase:
Three-Phase Supremacy with Single-Phase UpswingThree-phase equipment represented 73.4% of revenue in 2025, omnipresent in C&I rooftops and utility arrays where balanced load flow is mandatory. Modular 20-100 kW three-phase strings allow factories to scale generation without oversizing. Single-phase devices, linked to systems below 10 kW, are set for a 6.4% CAGR in line with residential growth. Italy’s 5.3 GW 2024 rooftop tally underlines single-phase momentum.
Compliance drives product roadmaps: national codes such as VDE-AR-N 4105 require firmware updates that smaller suppliers sometimes lag. Hybrid single-phase inverters with battery ports and blackout protection strengthen supplier lock-in at the household level, adding stickiness to the European solar inverters market.
By Connection Type:
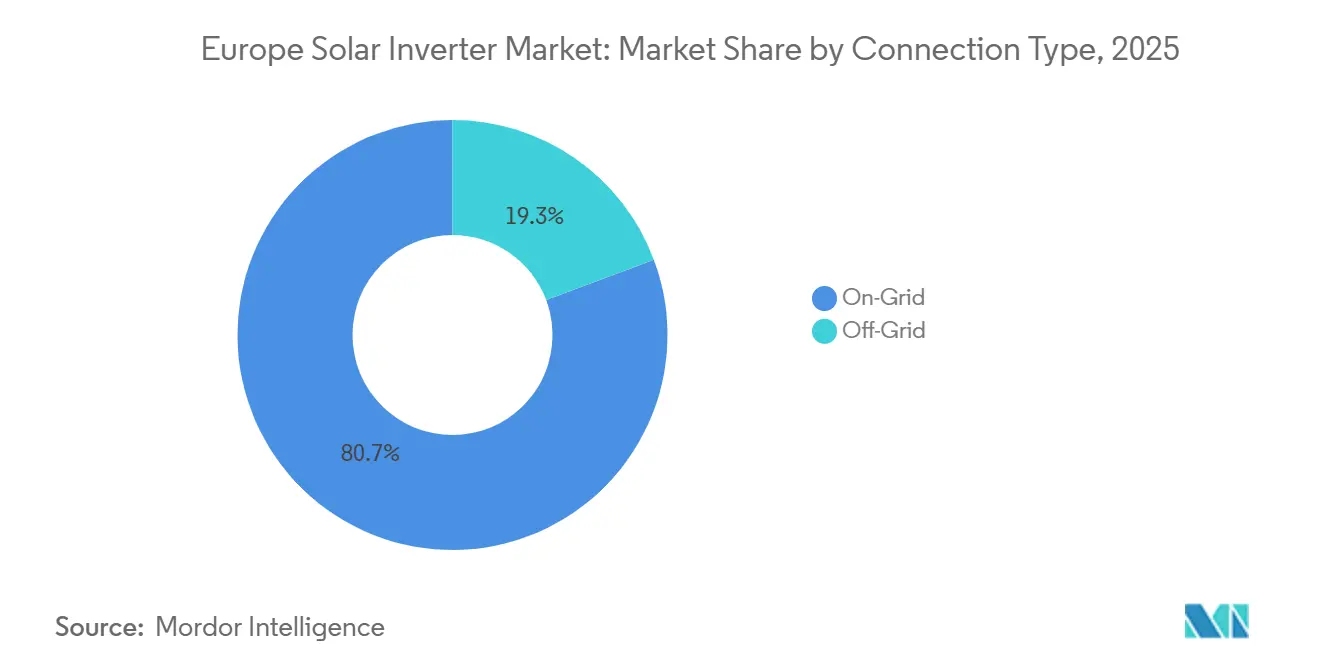
On-Grid Core, Off-Grid Niche WidensOn-grid products covered 80.7% of 2025 sales, reflecting mature European grids and export-oriented PPA models. Yet off-grid solutions will rise at a 7.7% CAGR through 2031, catalyzed by island communities in Italy and Greece replacing diesel generation. Victron and SMA lead with inverter-chargers that handle load surges and generator sync.
Hybrid units blur boundaries, enabling on-grid households to island during outages and to maximize self-use when net metering fades. The distinction between on- and off-grid therefore softens, but both modes expand overall demand within the European solar inverters market size forecasts.
By Application:
Utility-Scale Leads, Residential Races AheadUtility-scale systems held 59.1% of 2025 demand, supported by Iberian PPAs and Greece’s tender schedule. These plants favor high-capacity three-phase blocks for their lower LCOE. Residential demand, however, is set to expand at a 6.8% CAGR as retail tariffs stay high and permitting accelerates under Council Regulation 2022/2577. Single-phase hybrid inverters dominate this segment, boosting attach rates for batteries and EV chargers.
Commercial and industrial rooftops, roughly 25-30% share, grow more slowly because lower business tariffs stretch payback periods. Yet demand-charge management and ESG targets keep this slice relevant, especially where dynamic tariffs reward peak shaving. Overall, application mix shifts gradually but meaningfully, keeping the European solar inverters market diversified across value pools.
Geography Analysis
Germany and Italy Solar Inverter Market
Germany retained a 25.5% share in 2025 on the back of 14.6 GW additions and cumulative 95 GW installed, yet faces 40 GW in connection queues and rising curtailment. Stringent VDE codes and cybersecurity scrutiny favor domestic champions with deep engineering support. Italy is forecast to post an 11.1% CAGR, the fastest across the bloc, helped by Decreto Semplificazioni’s six-month permitting cap and a 3.5 GW FER-X auction in 2024. Rooftop, agrivoltaic, and hybrid projects diversify demand beyond utility-scale plants, tilting purchasing toward flexible string and hybrid designs.
Broader European Markets
Spain and Portugal together accounted for about 18-20% in 2025, propelled by a 62 GW Spanish pipeline and Portugal’s successive auctions. High-irradiance sites coupled with merchant-heavy PPAs keep cost discipline front and center, opening doors for value-priced Chinese central inverters. France, the UK, and the Netherlands made up 15-17%; France’s PPE aims for 40 GW by 2028, the UK targets 50 GW by 2030, while the Dutch net-metering sunset accelerated battery-ready sales. Scandinavia and Eastern Europe combined supplied the remaining share, ripe for suppliers able to tailor products to cold climates and nascent codes. Overall geographic fragmentation mandates localized go-to-market strategies across the European solar inverters market.
Regulatory Landscape
Europe’s solar inverter requirements are increasingly shaped by EU-level grid-connection rules and product-safety compliance. The Network Code on Requirements for Generators (NC RfG, Commission Regulation (EU) 2016/631) provides the technical framework that TSOs/DSOs transpose into national grid codes. ENTSO-E issued Phase II grid-forming guidance in November 2025, supporting the report’s 2026 shift toward grid-forming functionality for larger plants. At the same time, product compliance for equipment placed on the EU market tightens under Regulation (EU) 2026/1189, which requires compliance with EN IEC 62109-3:2026 for imported inverters from July 15, 2026.
Industrial policy and security-driven procurement constraints are also moving from guidance to funding conditions. In March 2026, the European Commission proposed “made-in-EU” requirements for key solar components, including inverters, for projects using public funds (within a multi-year implementation horizon). This reinforces localization themes already reflected in supplier strategies. Separately, public-funding restrictions for “high-risk” inverters were introduced in April 2026 and implemented in May 2026 for new, publicly supported projects, adding procurement screening and documentation burdens for developers and importers while leaving the installed base unchanged.
Competitive Landscape
The top five suppliers, SMA Solar, Huawei, Sungrow, SolarEdge, and FIMER, controlled about 55-60% in 2025, reflecting moderate concentration. SMA kept leadership through grid-forming central units and strong O&M services. Huawei and Sungrow climbed on aggressive pricing, in-house device manufacture, and AI-enabled monitoring platforms. SolarEdge dominated rooftops via DC-optimized architectures, although its 2024 restructuring hinted at margin strain. FIMER re-entered contention after its 2025 recapitalization.
Vertical integration and software differentiation surfaced as key strategies. Huawei and Sungrow invested in SiC fabs to secure chips, while SMA and Fronius bought software firms to add tariff optimization and EV-charging orchestration. Off-grid niches saw Victron and Schneider Electric winning telco towers and island microgrids due to inverter-charger expertise.
Emergent disruptors include Enphase, whose IQ8 microinverter gained IEC 62109 certification for grid-forming operation, and GoodWe, which opened a Rotterdam service hub to cut warranty lead times. The market thus bifurcates into a low-cost tier and a premium grid-services tier, a split likely to widen as ENTSO-E codes tighten. The European solar inverters market, therefore, rewards continual firmware evolution and local service depth just as much as hardware cost.
Europe Solar Inverter Industry Leaders
-
FIMER SpA
-
SMA Solar Technology AG
-
Huawei Technologies
-
Sungrow Power Supply
-
SolarEdge Technologies
- *Disclaimer: Major Players sorted in no particular order
Europe Solar Inverter Market Companies Covered in this Report
- SMA Solar Technology AG
- Huawei Technologies Co. Ltd.
- Sungrow Power Supply Co. Ltd.
- SolarEdge Technologies Inc.
- FIMER SpA
- Fronius International GmbH
- Schneider Electric SE
- Siemens AG
- Delta Energy Systems Inc.
- GoodWe Power Supply Co. Ltd.
- Growatt New Energy
- Enphase Energy Inc.
- KACO new energy GmbH
- Power Electronics España
- Ingeteam S.A.
- Omron Corporation
- General Electric Company
- Victron Energy B.V.
- Ginlong Technologies (Solis)
- Mitsubishi Electric Corporation
Market Opportunities and Future Outlook
Procurement shifts tied to public funding create whitespace for suppliers that can qualify and support trusted supply chains. The European Commission’s March 2026 proposal for “made-in-EU” requirements for solar inverters (for projects using public funds) and the April 2026 decision to implement public-funding restrictions for “high-risk” inverters in May 2026 are already forcing EPCs and developers to revisit approved vendor lists, documentation, and serviceability. For suppliers, this points to concrete value in Europe-based manufacturing and service footprints, as well as in providing auditable cybersecurity posture and compliance documentation alongside hardware.
The grid-code transition toward grid-forming behavior and tighter safety compliance also raises the importance of higher-value controls and software layers over commodity-only offerings. ENTSO-E’s Phase II grid-forming guidance (November 2025) and the July 15, 2026 effectiveness of EN IEC 62109-3:2026 for imported inverters bring advanced controls, certification readiness, and lifecycle support into purchase decisions, particularly for projects above 1 MW and for storage-coupled solar. Supplier actions reinforce that focus, including FIMER’s five-year framework agreement with Esmann Group and its approved supplier relationship with Gotion, both formalized in June 2026, which point to demand for bankable inverter platforms that integrate with storage and meet evolving grid-service and compliance needs across Europe.
Recent Industry Developments in Europe Solar Inverter Market
- June 2026: Huawei Digital Power upgraded its ESS solution brand from LUNA to LUTERRA and launched a next-generation Smart String Grid-Forming ESS Platform. The update reinforces its inverter-plus-storage proposition for European projects that are increasingly specified around grid-support functions and system-level controls.
- February 2026: Sungrow announced a EUR 230 million manufacturing investment in the Wałbrzych Special Economic Zone, Poland, with a planned 65,400 m2 facility designed for 20 GW/year inverter capacity and 12.5 GWh/year ESS capacity. Localized manufacturing supports delivery timelines, after-sales logistics, and public-procurement localization requirements that are becoming more prominent in parts of Europe.
- December 2025: Schneider Electric acquired a 25% stake in Energy Team to add dynamic tariff response capabilities to its EcoStruxure platform. The deal reinforces the shift toward software-led energy management around distributed PV and hybrid inverters as European consumers and C&I sites optimize self-consumption and price signals.
Europe Solar Inverter Market Report Scope and Research Methodology
Market Definition and Coverage
This market covers revenues earned from solar PV inverters sold for installations across Europe, where DC electricity from panels is converted into grid or usable AC power for homes, businesses, and utility-scale plants.
Scope exclusions: It excludes solar panels, mounting structures, standalone transformers, and broader EPC and O&M services, unless they are bundled into the inverter selling price.
Segments Covered in This Report
- By Inverter Type
- Central Inverters
- String Inverters
- Microinverters
- Hybrid/Battery-Ready Inverters
- By Phase
- Single-Phase
- Three-Phase
- By Connection Type
- On-Grid
- Off-Grid
- By Application
- Residential
- Commercial and Industrial
- Utility-Scale
- Geography
- Germany
- United Kingdom
- Spain
- Italy
- France
- NORDIC Countries
- Netherlands
- Russia
- Rest of Europe
Data Sources, Market Sizing, and Validation
Desk Research
Desk research was used to set the Europe boundary, align the definition with how the value chain reports revenues, and anchor the model with repeatable public signals. We referenced sources such as Eurostat energy statistics, the European Commission and national energy agencies for renewable targets and support schemes, ENTSO-E grid publications, IEA PVPS country notes, and SolarPower Europe updates on manufacturing and deployment context.
To translate those signals into a workable sizing sheet, we reviewed import and export trade statistics, product certification and safety standards notes, and public tenders where relevant for utility projects. Company annual reports and investor presentations were used to understand product mix shifts (string, central, hybrid, micro), route to market, and pricing direction. Select paid subscriptions that track company financials and patents were used to cross-check product launches and to reduce blind spots in shipment timing. The sources listed above are illustrative, and other public documents and data tables were also reviewed for collection, validation, and clarification.
Primary Interviews and Surveys
Primary work focused on interviews and short surveys with inverter supply chain participants and solar project stakeholders, including manufacturers, distributors, installers, and utility and C&I buyers. Inputs were used to confirm country-level demand drivers, typical system configurations (single-phase versus three-phase), and realistic price bands by power class, then to stress-test desk-source assumptions that were weak on shipments and pricing timing.
Distribution of primary research fieldwork respondents
| Company type | Respondent position |
|---|---|
| Top tier: 35% | CXOs: 18% |
| Mid tier: 44% | Functional/Unit leaders: 38% |
| Smaller Players: 21% | Managers: 44% |
Market-Sizing & Forecasting
Sizing started from a top-down build that links Europe solar additions and replacement activity to inverter demand, then split the demand by application and typical system design. Because the final market is a value measure, unit needs were translated into revenues through country-level average selling price ranges, and the totals were then aggregated to the regional level.
Key inputs in the model included annual PV installation volumes by major European countries, the mix of residential versus commercial and industrial versus utility projects, the share of single-phase versus three-phase systems, the adoption rate of on-grid versus off-grid setups, and pricing movement tied to power electronics cost direction and warranty and service packaging. Where published data was not granular enough, we added selective bottom-up checks, such as sampled ASP timing versus estimated shipments for key channels and distributor feedback on order patterns, to adjust totals. For forecasting, we ran scenario analysis around permitting and grid-connection pace, incentive continuity, and replacement cycles, and aligned the final path to what interviewed experts described as the most likely case.
Data Validation & Update Cycle
Outputs were validated through triangulation across multiple angles, including alignment with PV deployment trajectories, trade flows for relevant equipment categories, and interview-based channel signals on stock levels and delivery lead times. When the model showed sharp jumps, we reviewed drivers again country by country, and rechecked assumptions until the variance could be explained in operational terms.
Before sign-off, a second analyst reviewed calculations, scope mapping, and the main sensitivities so that errors do not pass through quietly. Reports refresh annually, and interim updates are triggered when material events occur, such as policy shifts, supply disruptions, or major price resets. Right before delivery, a final scan is run so clients receive the latest updated view.
Mordor Intelligence's Europe Solar Inverter Market Estimate Compared With Other Published Estimates
Published market sizes for Europe solar inverters do not always line up, mainly because the counting rules change by source, and even small differences in what is included can move the total. Currency timing, the treatment of hybrid units, and whether replacement demand is modeled explicitly are also common reasons for the spread.
The benchmark table shows that the gap is largely explained by scope and pricing logic, because in Mordor Intelligence's model the value is counted for inverter hardware sold into residential, commercial and industrial, and utility PV projects across Europe, and battery storage systems sit outside scope unless the revenue is booked as part of a PV inverter shipment.
Benchmark comparison
| Source | Market Size | Gaps in Research Methodology |
|---|---|---|
| Mordor Intelligence | USD 2.98 B (2025) | |
| Trade Journal B | USD 4.80 B (2024) | Appears to use a wider definition that can include additional power-conversion and balance-of-system revenue, and it applies a different currency timing, which lifts the reported value versus inverter-only counting. |
| Regional Consultancy A | USD 4.10 B (2025) | Likely folds battery inverter and retrofit storage-ready power conversion into the total, and it uses a different country coverage and averaging method for ASPs across power classes, which changes the final sum. |
Overall, the comparison indicates that scope alignment and repeatable inputs are the main drivers behind a usable total. By tying the value build to installation and replacement signals, and then checking pricing bands with channel feedback, the estimate stays traceable to clear steps that can be repeated when new country data becomes available.
Key Questions Answered in the Report
How large will the Europe solar inverters market be by 2031?
The market is projected to reach USD 4.18 billion by 2031 on a 6.01% CAGR.
Which inverter type is growing fastest across Europe?
Microinverters are expected to rise at a 7.3% CAGR through 2031, led by rooftop installations in high-price electricity markets.
Why are grid-forming capabilities becoming mandatory?
ENTSO-E's 2026 code update requires large projects to supply synthetic inertia and voltage support to stabilize frequency as fossil generators retire.
Which country offers the highest growth potential to 2031?
Italy shows the fastest outlook, with an 11.1% CAGR driven by streamlined permitting and aggressive FER-X auctions.
How are semiconductor shortages influencing inverter prices?
Limited IGBT and SiC MOSFET supply lengthens lead times and sustains an 8-12% cost premium for grid-forming models, partly offsetting broader price declines.
What role do hybrid inverters play in residential adoption?
Hybrid units enable battery integration and self-consumption during net-metering phase-outs, making them the default choice in Germany and the Netherlands.