
Small Molecules Contract Development And Manufacturing Organization Market Size and Share
Market Overview
| Study Period | 2020 - 2031 |
|---|---|
| Market Size (2026) | USD 207.16 Billion |
| Market Size (2031) | USD 290.32 Billion |
| Growth Rate (2026 - 2031) | 6.98 % |
| Fastest Growing Market | North America |
| Largest Market | Asia Pacific |
| Market Concentration | Medium |
Major Players *Disclaimer: Major Players sorted in no particular order Image © Mordor Intelligence. Reuse requires attribution under CC BY 4.0. | |
Small Molecules Contract Development And Manufacturing Organization Market Analysis by Mordor Intelligence
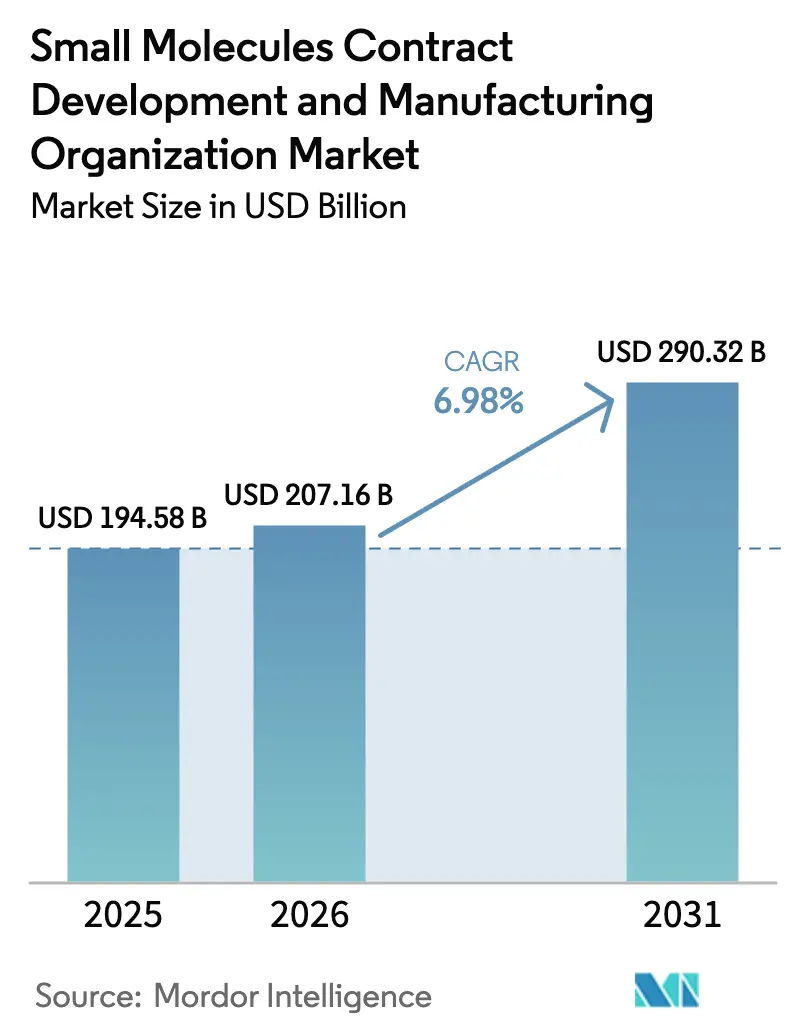
The Small Molecules Contract Development And Manufacturing Organization Market size is expected to increase from USD 194.58 billion in 2025 to USD 207.16 billion in 2026 and reach USD 290.32 billion by 2031, growing at a CAGR of 6.98% over 2026-2031.
Active pharmaceutical ingredient (API) outsourcing keeps accelerating as patent expiries threaten USD 150 billion in branded revenue through 2027, pushing originators toward asset-light production strategies that favor external manufacturing partners. Consolidation remains brisk Novo Holdings’ USD 16.5 billion purchase of Catalent typifies scale-driven plays yet capacity bottlenecks linger, with clinical-phase slots booked 18-24 months ahead as of late 2025. Biotech funding bounced back strongly, deploying USD 12 billion in venture capital in 2024 and reviving demand for flexible development capacity that can compress timelines by up to 40%. Simultaneously, geopolitical risk and the 2024 US BIOSECURE Act spur a realignment of supply chains away from single-country dependence and toward multi-node networks spanning North America, India, and Europe.
Key Report Takeaways
- By service type, API manufacturing accounted for 41.02% of the small-molecule CDMO market share in 2025, while formulation & analytical services are projected to expand at a 7.29% CAGR through 2031.
- By scale of operation, commercial-scale manufacturing led with a 34.27% revenue share in 2025, whereas clinical Phase III capacity is advancing at a 9.93% CAGR to 2031.
- By therapeutic area, oncology accounted for 55.12% of 2025 revenue, and CNS pipelines are forecast to grow at an 8.43% CAGR through 2031.
- By client type, small & mid-size pharma captured 37.08% of 2025 turnover, while biotech firms represent the fastest-growing cohort at an 8.68% CAGR to 2031.
- By geography, North America contributed 39.63% to 2025 value, yet Asia-Pacific is poised to accelerate at an 11.63% CAGR during 2026-2031.
Note: Market size and forecast figures in this report are generated using Mordor Intelligence’s proprietary estimation framework, updated with the latest available data and insights as of 2026.
Market Trends and Insights
Drivers Impact Analysis of Small Molecules Contract Development And Manufacturing Organization Market*
| Driver | (~) % Impact on CAGR Forecast | Geographic Relevance | Impact Timeline |
|---|---|---|---|
| Rising outsourcing of API & FDF manufacturing by Big Pharma | +1.8% | Global, with concentration in North America & Europe | Medium term (2-4 years) |
| Surge in small-molecule oncology approvals post-2025 | +1.2% | North America & EU regulatory markets, manufacturing globally | Long term (≥ 4 years) |
| Cost-advantaged capacity expansions in APAC CDMO clusters | +1.4% | APAC core, with spillover benefits to global supply chains | Medium term (2-4 years) |
| AI-driven process-optimization platforms reducing CMC timelines | +1.1% | North America & EU early adopters, expanding to APAC | Long term (≥ 4 years) |
| HPAPI demand for targeted therapeutics (under-supplied sub-scale) | +0.9% | Global, with specialized facilities concentrated in North America & Europe | Long term (≥ 4 years) |
| Source: Mordor Intelligence | |||
Rising Small-Molecule R&D Pipeline Outsourcing
Sponsors now outsource 73% of API development and 65% of dose manufacturing, up from 68% and 60% in 2023, as in-house footprints shrink by 15-20%.[1]Boston Consulting Group Analysts, “Pharmaceutical Outsourcing: Cost Optimization and Strategic Partnerships,” BCG, bcg.com Venture-backed biotechs flock to contingent payment models that tie cash outflow to regulatory milestones, intensifying competition for preclinical and Phase I slots. Virtual pharma firms, which own 40% of Phase II-III assets as of 2025, have no physical plants, so lead times hinge entirely on CDMO availability. Capacity utilization already exceeds 85% in Phase III, forcing early reservations that lock sponsors into multi-year, multi-service agreements. Integrated campuses that co-locate synthesis, formulation, and testing increasingly win these tenders by eliminating analytical transfer delays.
Pharma Cost-Containment Accelerating CDMO Adoption
Manufacturing consumes 25% of pharma revenue on average, yet yield optimization and supply chain rationalization can reduce COGS by up to 25%. Between 2024 and early 2026, originators divested 18 plants, redeploying capital toward biologics while routing small molecules to external partners with leaner fixed costs. Upcoming patent cliffs for Eliquis and Keytruda amplify urgency, prompting tiered-pricing contracts pegged to volume commitments. Integrated CDMO-CRO models now shave 30-40% off development time, improving asset NPV for cash-constrained biotechs. Energy-intensive syntheses are migrating to India, where industrial power averages USD 0.07 per kWh versus USD 0.13 in Western Europe, reinforcing the small-molecule CDMO market’s global dispersion.
Surge in High-Potency API (HPAPI) Demand
Antibody–drug conjugates and targeted oncology agents drive demand for containment suites capable of OEL band 5 operations. Lonza, Siegfried, and Carbogen Amcis invested more than USD 300 million in new HPAPI lines during 2024-2025. FDA scrutiny tightened, issuing Form 483 observations to 12 HPAPI sites in 2024 for cross-contamination risks.[2]FDA Communications Office, “FDA Warning Letters to CDMO Facilities,” FDA, fda.gov Smaller specialists exploit shortages in ultra-potent capacity, commanding 40-60% pricing premiums. Continuous-flow reactors and closed-transfer solids handling are mandatory features for winning oncology programs in the small-molecule CDMO market.
AI-Driven Process Intensification for Micro-Batch APIs
Machine-learning algorithms now cut reaction-optimization times by 60-70%, trimming development cycles to roughly 12 months. Flow-chemistry installations shrink batch size by 80% yet lift yield consistency, while real-time PAT enables immediate release. FDA’s Emerging Technology Program granted eight continuous-manufacturing designations in 2024-2025, signaling regulatory comfort with data-rich control strategies. Consequently, CDMOs equipped with digital twins and data science teams secure long-term contracts, driving higher asset utilization.
Restraints Impact Analysis of Small Molecules Contract Development And Manufacturing Organization Market*
| Restraint | (~) % Impact on CAGR Forecast | Geographic Relevance | Impact Timeline |
|---|---|---|---|
| US–EU export-control tightening on dual-use synthesis equipment | -0.9% | Global, with primary impact on US-EU to APAC technology transfers | Short term (≤ 2 years) |
| Global shortage of senior QC chemists inflating labour costs | -0.7% | Global, with acute impacts in North America and Western Europe | Medium term (2-4 years) |
| Rising ESG-linked financing premiums for solvent-intensive CDMOs | -0.6% | Global, with particular impact on European and North American markets | Medium term (2-4 years) |
| Source: Mordor Intelligence | |||
Capacity Crunch & Long CDMO Lead Times
Clinical manufacturing slots operated at 85% utilization in late 2025, inflating lead times to as long as 24 months. COVID-19-era redeployments toward vaccines left a structural deficit in small-molecule suites that new builds will not fully close until 2027. Dual-sourcing mitigates schedule risk but lifts tech-transfer costs by up to 50% and complicates comparability filings.[3]European Medicines Agency Inspectors, “EMA GMP Inspections of Asian CDMO Facilities,” EMA, ema.europa.eu Prefabricated plants shorten timelines to 12-18 months, yet demand USD 50-80 million per 500-kg annual capacity, a barrier for smaller entrants in the small-molecule CDMO market.
Regulatory Non-Compliance / FDA Warning Letters
FDA warning letters to Gland Pharma, Fresenius Kabi, and Intas Pharma in 2024 disrupted 15-20 finished-drug lines and boosted sponsor audit outlays by roughly 25%. EMA flagged eight Asian facilities for GMP lapses in 2025, foreshadowing tighter import scrutiny. Compliance spending now absorbs up to 12% of CDMO operating budgets, crowding out discretionary CapEx for technology upgrades and an overhang for margin expansion.
*Our forecasts treat driver/restraint impacts as directional, not additive. The impact forecasts reflect baseline growth, mix effects, and variable interactions.
Small Molecules Contract Development And Manufacturing Organization Market Segment Analysis
By Service Type:
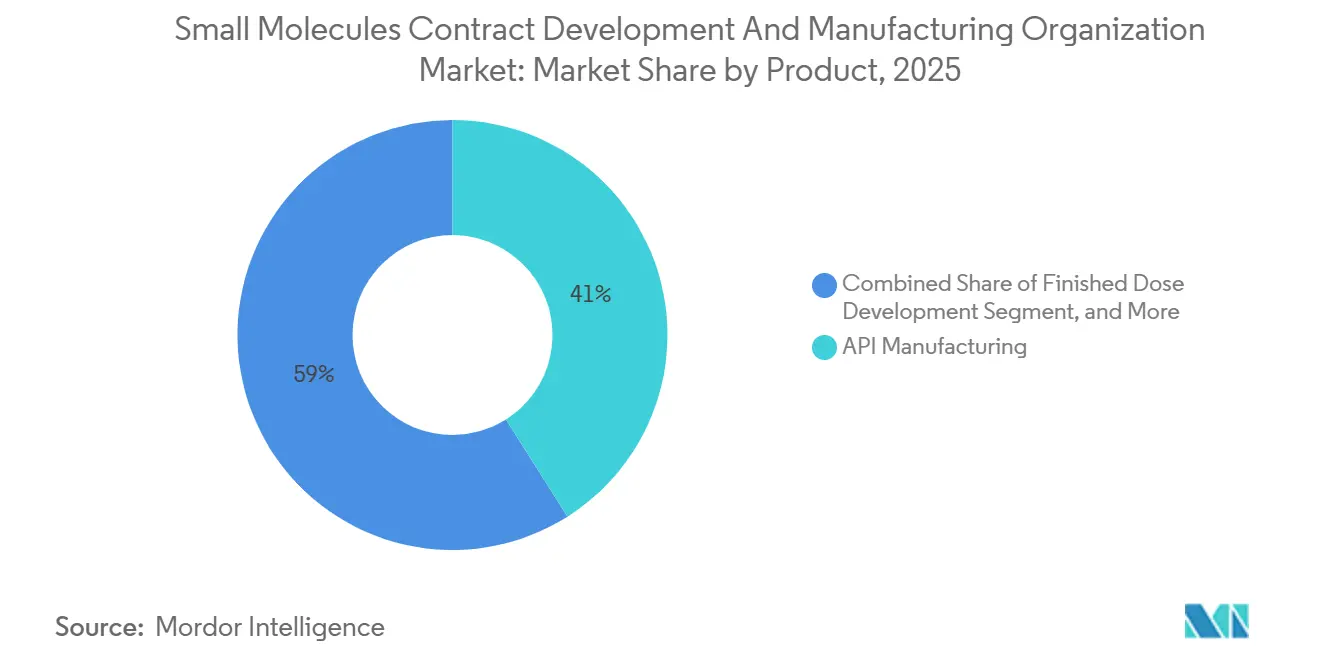
Integrated Formulation Demand EscalatesFormulation & analytical services accelerated at a 7.29% CAGR to 2031, outpacing API manufacturing’s 6.5% climb. In 2025, API work still accounted for 41.02% of the small-molecule CDMO market, underscoring how core synthesis remains central despite commoditization pressure from low-cost Asian plants. The premium now pivots to seamless hand-offs: co-located synthesis, formulation, and QC can chop 30-40% from development calendars, lifting early-revenue capture. Continuous-flow setups further blur boundaries, as real-time granulation feeds directly from the API output, eliminating the need for expensive intermediate storage.
Integrated campuses help sponsors trim validation cycles, thereby curbing the overall drag on the small-molecule CDMO market from delays. CDMOs specializing in spray-dried dispersions, hot-melt extrusion, or lipid-based systems capture 25-40% pricing mark-ups because they unlock solubility for otherwise shelved compounds. Meanwhile, finished-dose manufacturing continues to grow at a 6.8% CAGR, buoyed by lifecycle-management reformulations.



By Scale of Operation:
Phase III Capacity Under StrainCommercial operations led revenue with a 34.27% stake in 2025; yet clinical Phase III activities clock the fastest 9.93% CAGR, reflecting a maturing biotech cohort eager to avoid greenfield CapEx. Phase III utilization exceeded 85% in 2025, with sponsors reserving slots 2 years out, inflating deposit requirements, and further tightening the small-molecule CDMO market pipeline. Lonza’s USD 1.2 billion Vacaville campus adds 500 kg of late-stage capacity annually, but the industrywide shortfall still totals 200-300 metric tons.
Automation upgrades shrink changeovers by up to 50% for commercial suites, boosting throughput without new bricks-and-mortar. Preclinical and Phase I work also expands, thanks to a rebound in discovery grants, yet remains less capital-intensive.
By Therapeutic Area:
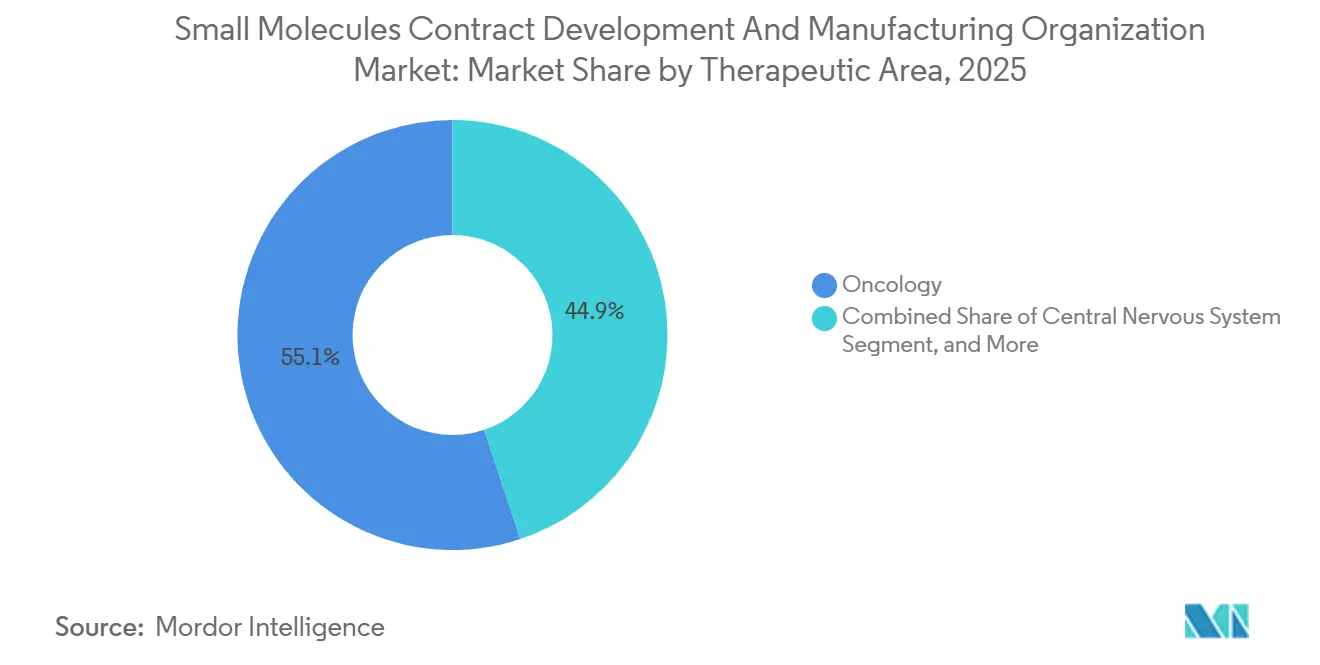
Oncology Still King, CNS GainingOncology accounted for 55.12% of 2025 turnover, leveraging 180 ADC programs in active development and stringent HPAPI containment that yield fat margins. Controlled-substance CNS drugs grow faster at 8.43% CAGR, with specialized vaulting and DEA-quota compliance raising barriers to entry. Cardiovascular and infectious-disease APIs each hover near 6.5-6.8% growth, while GLP-1 agonists inflate metabolic-disorder demand above 7%.
CNS projects leverage nanoparticle, prodrug, and blood-brain-barrier expertise, fostering niche offerings that diversify the small-molecule CDMO market. Oncology’s continued dominance guarantees steady HPAPI investment, although rising competition may erode premiums over time.
By Client Type:
Biotech Drives Volume UpsideBiotech firms are driving revenue growth at an 8.68% CAGR, adopting milestone-based contracts that align CDMO cash flows with clinical progress. Small & mid-size pharma retained the largest 37.08% slice in 2025, outsourcing up to 85% of needs to protect capital for launches. Big Pharma grows modestly at 6.2%, yet its long-term, preferred-supplier frameworks anchor capacity utilization. Generic players lift baseline volumes but remain price sensitive, often steering orders to India or China unless governance rules dictate otherwise.
Hybrid CRO-CDMO bundles now pitch combined toxicology, CMC, and regulatory dossiers, trimming IND timelines by four to six months and adding resilience to the small molecules CDMO market.
Geography Analysis
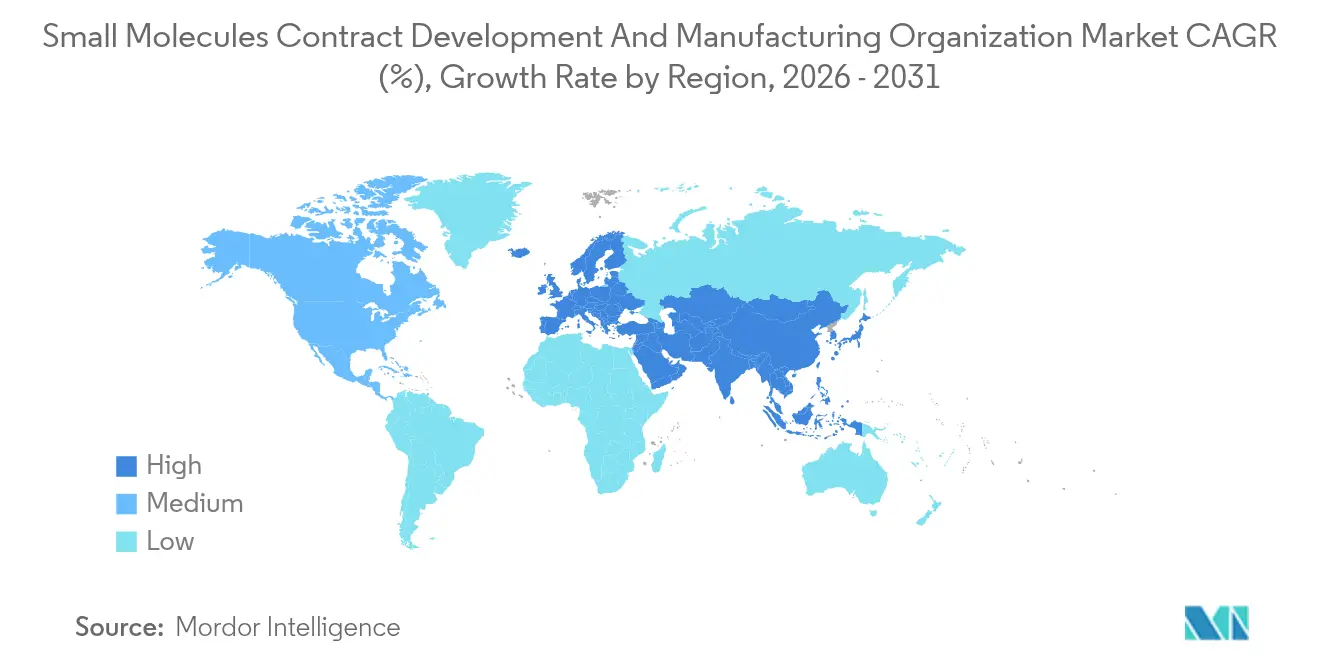
North America Small Molecules Contract Development and Manufacturing Organization Market
North America accounted for 39.63% of the 2025 value and should expand at a 6.4% CAGR through 2031, driven by USD 500 million in new onshoring projects and supply re-routing induced by the BIOSECURE Act. ACG’s Atlanta capsule plant and Cambrex’s Iowa API expansion exemplify the tilt toward domestic resilience, while Canada and Mexico absorb spillover clinical demand under streamlined USMCA filings. Heightened FDA vigilance translated to 15 warning letters across domestic and foreign sites in 2025, raising compliance thresholds and marginal costs.
Europe and APAC Small Molecules Contract Development and Manufacturing Organization Market
Germany, Switzerland, and Italy dominate capacity; Lonza, Siegfried, and Olon collectively funneled USD 400 million into HPAPI and continuous-flow upgrades during 2024-2025. Brexit-related dual filings push certain projects toward Ireland and the Netherlands, while Eastern Europe offers 30-40% labor savings but faces talent shortages. EMA’s 42 GMP inspections in Asia during 2025 intensify quality scrutiny, nudging sponsors back to regional suppliers.
APAC Small Molecules Contract Development and Manufacturing Organization Market
Asia-Pacific is the growth engine, sprinting at an 11.63% CAGR and expanding its small-molecule CDMO market amid India’s emergence as a China alternative. Syngene, Laurus Labs, and Neuland locked USD 300 million in new U.S. contracts across 2024-2025, even as WuXi AppTec’s export momentum cooled to 8.5% CAGR. Japan and South Korea invest in higher-margin, tech-driven API lines, with Samsung Biologics expected to branch into small molecules by 2027. Australia captures early-phase clinical work supported by R&D incentives.

Regulatory Landscape
Global small-molecule CDMO operations fall under the same GMP and Pharmaceutical Quality System expectations that apply to sponsors, with regulators reinforcing that outsourcing does not transfer ultimate accountability for product quality. In 2026, US oversight included a June 2026 Drug Enforcement Administration (DEA) Federal Register notice tied to controlled-substance import authorization for clinical-trial use, and a July 2026 FDA Form 483 issued to Catalent at its Bloomington site citing quality-system and contamination-control observations. These enforcement actions can disrupt supply and drive additional client audits.
In Europe, implementation of the updated EU GMP Annex 1 in July 2026 lifts the compliance bar for sterile manufacturing controls relevant to small-molecule injectables and associated fill-finish outsourcing. Separately, EMA inspection planning for 2026-2028 emphasizes tighter supervision and continued scrutiny of international supply chains, keeping pressure on data integrity controls and oversight models across sponsor-CDMO interfaces, particularly for multi-site, multi-region manufacturing networks.
Competitive Landscape
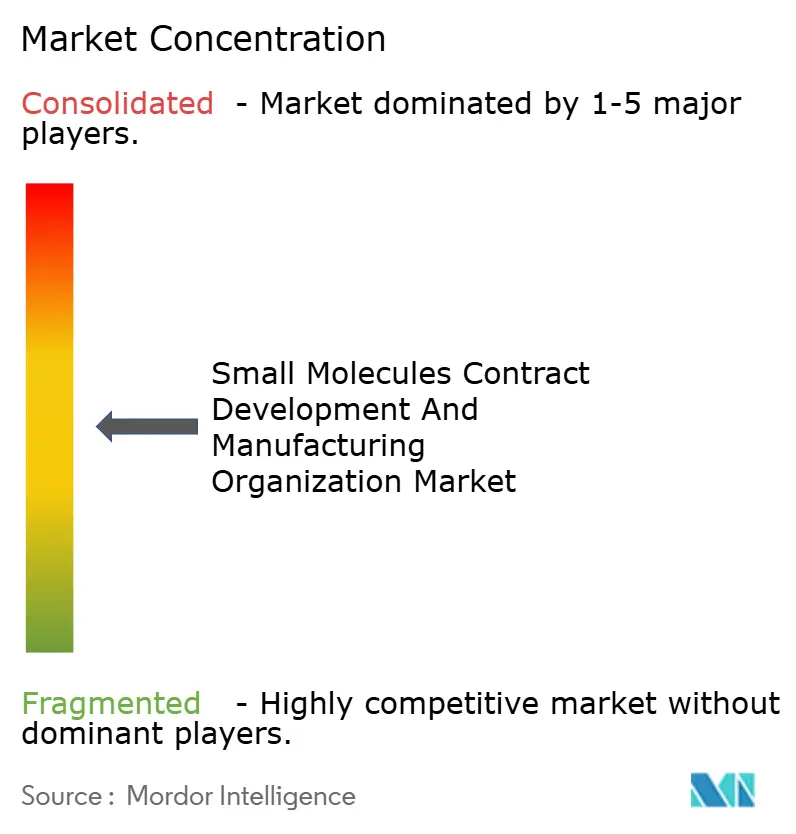
The small-molecule CDMO market is moderately fragmented: Lonza, Catalent (now under Novo Holdings), Patheon, WuXi STA, and Siegfried collectively account for a significant portion of global revenue. Novo’s 2024 Catalent buyout signals a push to secure GLP-1 capacity while monetizing excess bandwidth through external contracts. Leaders differentiate via AI-enabled process optimization, continuous-flow chemistry, and real-time analytics that slash waste and boost margins. Lonza’s 2024 split into Integrated Biologics, Advanced Synthesis, and Specialized Modalities freed capital for HPAPI and bioconjugate niches after exiting commoditized capsules.
Patent filings underscore innovation heft: Lonza and Siegfried lodged 42 applications for flow and green-chemistry methods between 2024-2025. Smaller disruptors carve out ultra-potent APIs with OEL thresholds below 0.1 µg/m³, and modular GMP boxes that deploy in under 18 months appeal to sponsors seeking agile capacity. Regulatory missteps remain career-limiting; FDA sanctions on Gland Pharma and peers in 2024 spooked clients, underscoring the premium on bulletproof quality systems. Further consolidation is likely as customers prioritize partners blending scale, compliance, and tech sophistication.
Small Molecules Contract Development And Manufacturing Organization Industry Leaders
Thermo Fisher Scientific, Inc
Labcorp Drug Development
Cambrex Corporation
Catalent Inc.
Lonza Group AG
- *Disclaimer: Major Players sorted in no particular order
Small Molecules Contract Development And Manufacturing Organization Market Companies Covered in this Report
- Ajinomoto Bio-Pharma Services
- Alcami
- Cambrex
- Catalent
- Corden Pharma International
- Delpharm
- Dottikon ES Holdings AG
- Eurofins CDMO
- Evonik Industries
- Fareva
- Jubilant Pharmova Ltd.
- Lonza Group
- LabCorp
- Olon S.p.A
- Piramal Group
- Recipharm
- Siegfried Holding AG
- Sterling Pharma Solutions
- Thermo Fisher Scientific
- WuXi STA
Read Analysis of Small Molecules Contract Development And Manufacturing Organization Companies

Market Opportunities and Future Outlook
White space is visible where sponsors need specialized capacity that reduces technical and compliance risk, including high-containment operations for potent compounds and integrated development-to-commercial packages that avoid analytical work and tech-transfer delays. The latest investment signals where capacity and process competence are being added: Cambrex advanced US and European expansions in March 2026, including engineering for a new large-scale API plant at Charles City, Iowa (140,000-liter capacity referenced as part of its expansion plan) and a USD 30 million R&D expansion in Milan, Italy, aimed at scalable API manufacturing plus faster CMC problem-solving. These projects also support regionalization strategies that diversify sourcing across North America and Europe.
Opportunities also center on late-phase and commercial supply programs that couple manufacturing execution with regulatory readiness and quality oversight. Catalent expanded its partnership with Nanoscope Therapeutics in July 2026 to support late-phase development and commercial supply of MCO-010, alongside an ongoing rolling BLA submission to the FDA, showing how CDMOs can increase share-of-wallet by connecting development services to downstream commercial supply commitments. Industry proposals for shared-risk models and longer-term contracting structures, including multi-year commitments discussed by API-industry bodies, point to a contracting environment where CDMOs with validated capacity, strong data integrity programs, and multi-node networks can win longer-duration agreements rather than relying on transactional spot work.
Recent Industry Developments in Small Molecules Contract Development And Manufacturing Organization Market
- July 2026: Thermo Fisher Scientific Inc. (Patheon) announced an exclusive agreement with AustinPx to install and operate KinetiSol technology at oral solid dose sites in Bend, Oregon and Cincinnati, Ohio. The collaboration expands advanced manufacturing capabilities for complex small molecules. The move reinforces reshoring and capacity growth in US API production and strengthens HPAPI and solubility technology footprint to bolster supply chain resilience.
- July 2026: Thermo Fisher Scientific Inc. (Patheon) and AustinPx have sealed an exclusive agreement to deploy KinetiSol technology at Bend and Cincinnati sites. The initiative advances flexible manufacturing for high potency and challenging formulations. It broadens capacity to support demand for complex small molecules and improves market flexibility in the CDMO landscape.
- March 2026: Cambrex Corporation completed initial engineering studies for a new large scale API manufacturing plant at Charles City, Iowa as part of a 120 million investment to add capacity. The project expands US API manufacturing footprint to meet rising demand in small molecule CDMO services. It signals scale driven capacity additions to strengthen market position and supply security.


Small Molecules Contract Development And Manufacturing Organization Market Report Scope and Research Methodology
Market Definition and Coverage
This market covers outsourced contract services used to develop, scale up, and manufacture small-molecule drug substances and drug products, across clinical and commercial supply. The value is counted as the service revenue earned by contractors for development work, manufacturing runs, and related testing support.
Scope exclusions: In this sizing, in-house manufacturing done by pharmaceutical companies and pure distribution margins are excluded.
Segments Covered in This Report
- By Service Type
- API Development
- API Manufacturing
- Finished Dose Development
- Finished Dose Manufacturing
- Formulation & Analytical Services
- By Scale of Operation
- Preclinical
- Clinical – Phase I
- Clinical – Phase II
- Clinical – Phase III
- Commercial
- By Therapeutic Area
- Oncology
- Cardiovascular
- Infectious Diseases
- Central Nervous System
- Metabolic Disorders
- Others
- By Client Type
- Big Pharma
- Small & Mid-size Pharma
- Biotech Firms
- Generic Drug Companies
- By Geography
- North America
- United States
- Canada
- Mexico
- Europe
- Germany
- United Kingdom
- France
- Italy
- Spain
- Rest of Europe
- Asia-Pacific
- China
- Japan
- India
- Australia
- South Korea
- Rest of Asia-Pacific
- Middle East & Africa
- GCC
- South Africa
- Rest of Middle East & Africa
- South America
- Brazil
- Argentina
- Rest of South America
- North America
Data Sources, Market Sizing, and Validation
Desk Research
Desk research was used to set the market boundary and to build a realistic demand map for outsourcing in small molecules. We relied on public and official sources such as the US FDA (drug approvals, inspections, and quality guidance), the EMA, ClinicalTrials.gov for clinical pipeline signals, the WHO for essential medicines context, and OECD or World Bank macro series to normalize multi-country spending patterns.
To make assumptions measurable, we also reviewed company filings and investor presentations, association publications, and reputable press coverage on capacity additions and service mix changes. In a few places, paid subscriptions were used only for company financial intelligence, patent databases, and shipment-level import-export checks where public trade tables were too aggregated. The sources listed above are illustrative, and we also used additional public references to support collection, cross-checks, and clarification.
Primary Interviews and Surveys
Primary work focused on validating how outsourcing is split between API and finished dose, and how pricing shifts when projects move from preclinical to commercial. We spoke with a mix of contract manufacturers, procurement and technical operations teams at sponsors, and subject matter experts covering major outsourcing corridors across APAC, EMEA, and the Americas.
These conversations helped confirm utilization trends, how batch sizes typically move between phases, the share of high potency work routed to specialist sites, and the practical pace of price resets in new contracts. We then adjusted model assumptions in places where desk research was not specific enough for service-level or phase-level detail.
Distribution of primary research fieldwork respondents
| Company type | Respondent position | Region |
|---|---|---|
| Top tier: 35% | CXOs: 13% | APAC: 44% |
| Mid tier: 48% | Functional/Unit leaders: 39% | EMEA: 29% |
| Smaller Players: 17% | Managers: 48% | Americas: 27% |
Market-Sizing & Forecasting
Market sizing was built from the demand pool outward, where clinical pipeline activity and commercial small-molecule volumes were converted into outsourced work using phase-wise outsourcing rates and typical service mixes. A top-down approach was used once to reconstruct demand by mapping trial starts and commercial supply needs into development batches, validation runs, and ongoing production lots, which were then valued using service-specific pricing.
To keep the totals realistic, we corroborated the outputs using selective bottom-up approximations such as sampled provider revenue disclosures, capacity and utilization checks for key chemistry and finished dose lines, and indicative price bands for API versus drug product work. The model used a small set of repeatable inputs such as trial counts by phase, the share of oral solids versus sterile or specialized forms, average project duration from process development into tech transfer, typical batch sizes and campaign frequency for commercial supply, and inflation-driven and mix-driven ASP movement.
For forecasting, scenario analysis was applied with a base case that reflects interview feedback on outsourcing intensity, capacity additions, and customer pushback on pricing. Where bottom-up data could not be observed for smaller privately held providers, gaps were handled through conservative revenue-to-capacity proxies and then re-checked against regional demand indicators.
Data Validation & Update Cycle
Outputs were validated through multiple checks, including cross-verifying growth against independent signals like clinical trial momentum, regulatory activity, and reported capacity expansion announcements. When a region or service line showed a sharp jump, the underlying drivers were reviewed, assumptions were challenged, and follow-up outreach was triggered to confirm whether the change was structural or timing related.
Before sign-off, the model goes through analyst peer review, with variance checks at the service and region level, and with currency conversions aligned to the year being reported. Reports are refreshed annually, and interim updates are made when material events occur that can shift pricing, capacity, or demand. Before delivery, an analyst performs a fresh pass so clients receive the latest updated view.
Mordor Intelligence's Small Molecules Contract Development and Manufacturing Organization Market Estimate Compared With Other Published Estimates
Published market numbers for small-molecule CDMO services often vary because the scope boundary is not consistent and the timing of price and currency updates can differ by publisher. Differences also show up when one estimate treats development services as a small add-on, while another counts them fully across phases and then applies a higher blended rate.
In this study, the refresh cadence is tied to annual model resets with interim checks for major pricing moves, and currency conversion is aligned to the stated year so the ASP logic stays consistent by service and phase. As a result, the resulting total can differ from some quicker roll-ups, including approaches described by Mordor Intelligence.
Benchmark comparison
| Source | Market Size | Gaps in Research Methodology |
|---|---|---|
| Mordor Intelligence | USD 194.58 B (2025) | |
| Trade Journal B | USD 50.58 B (2024) | Uses a narrower framing that reads closer to small-molecule CMO/CDMO core manufacturing and may undercount development, formulation, and analytical services, and it also anchors to a different base year with a shorter forecast window. |
| Regional Consultancy A | USD 47.80 B (2022) | Starts from an older base year and appears to apply a tighter definition of CDMO revenue, which can exclude parts of finished dose development and some clinical phase support that are counted in broader outsourcing value. |
The comparison shows that the spread is mainly driven by scope and timing rather than arithmetic. When service coverage is clearly defined and year-specific pricing and currency steps are kept consistent, the market total becomes easier to trace back to a few observable demand and capacity signals.


Key Questions Answered in the Report
How large is the small-molecule CDMO market in 2026?
The small molecules CDMO market size is estimated at USD 207.16 billion for 2026.
What CAGR is forecast for Small Molecules CDMO services between 2026 and 2031?
The market is projected to register a 6.98% CAGR over the 2026-2031 period.
Which service segment is expanding the fastest?
Formulation & analytical services are forecast to grow at a 7.29% CAGR through 2031 owing to demand for integrated development models.
Which region will see the highest growth?
Asia-Pacific is expected to grow the fastest, at an 11.63% CAGR, fueled by India’s rise as a China-alternative supplier.
Why are Phase III manufacturing slots under pressure?
Late-stage biotech pipelines and prior underinvestment have pushed Phase III capacity utilization above 85%, stretching lead times to up to 24 months.
Page last updated on:


 Your data is secure and never sold or shared.


