Fill Finish Pharmaceutical Contract Manufacturing Market Size and Share
Market Overview
| Study Period | 2020 - 2031 |
|---|---|
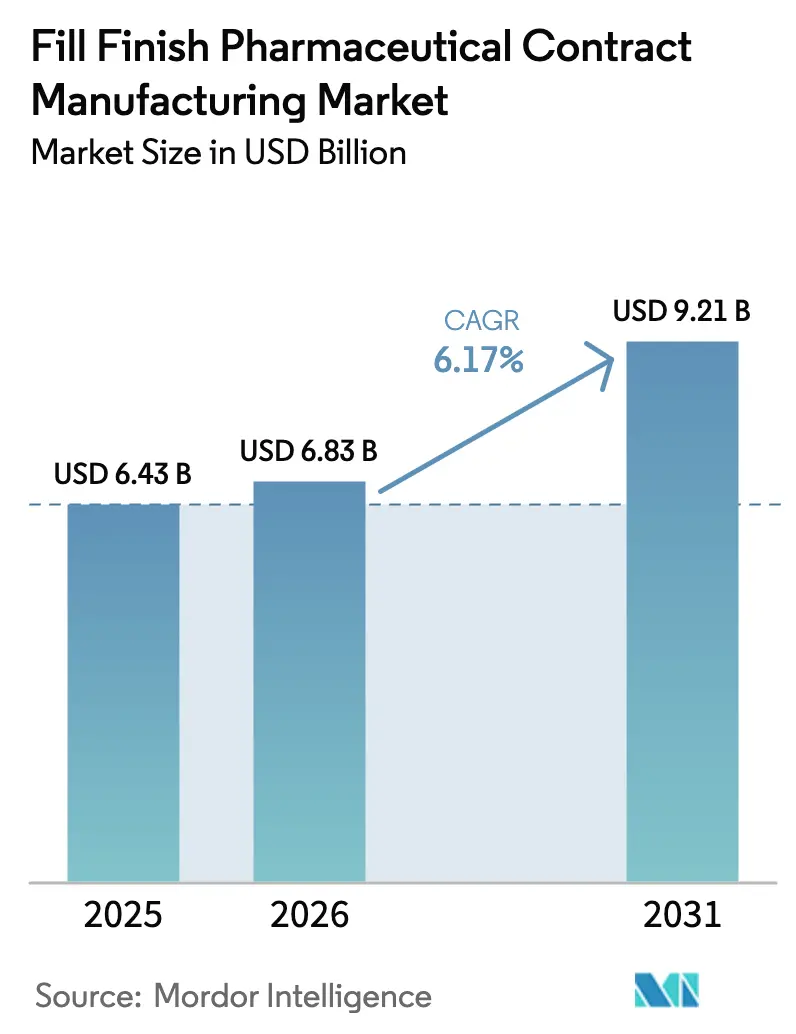
| Market Size (2026) | USD 6.83 Billion |
| Market Size (2031) | USD 9.21 Billion |
| Growth Rate (2026 - 2031) | 6.17% CAGR |
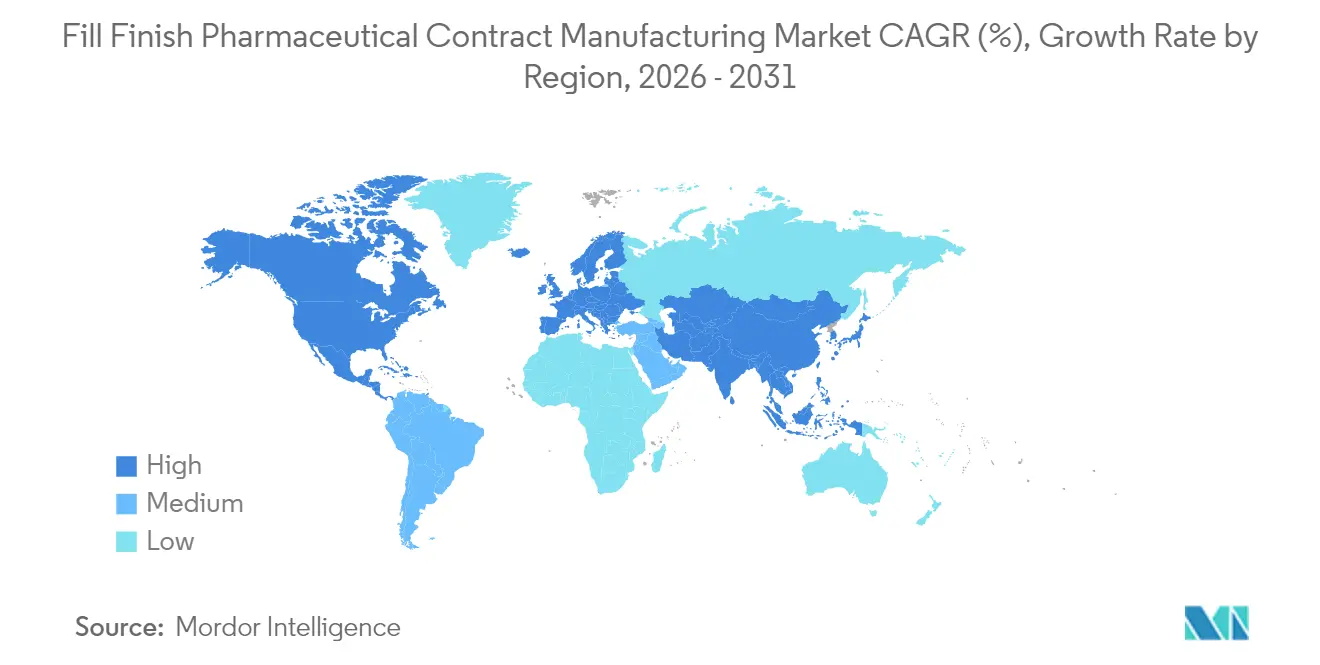
| Fastest Growing Market | Asia Pacific |
| Largest Market | North America |
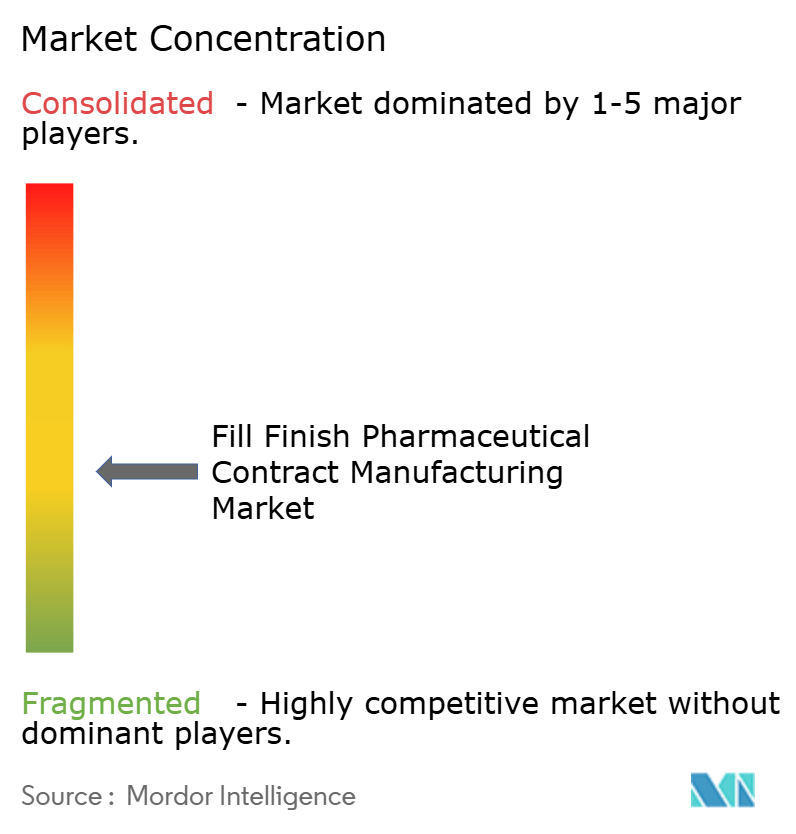
| Market Concentration | Medium |
Major Players *Disclaimer: Major Players sorted in no particular order Image © Mordor Intelligence. Reuse requires attribution under CC BY 4.0. | |
Fill Finish Pharmaceutical Contract Manufacturing Market Analysis by Mordor Intelligence
The fill finish pharmaceutical contract manufacturing market size is expected to grow from USD 6.43 billion in 2025 to USD 6.83 billion in 2026 and is forecast to reach USD 9.21 billion by 2031 at 6.17% CAGR over 2026-2031. This expansion underscores how drug sponsors, particularly mid-sized and large innovator companies, are reallocating capital from internal aseptic plants toward R&D while relying on partners that can supply validated sterile capacity on demand. Persistently strong biologics pipelines, rapid orphan-drug launches, and a preference for patient-friendly delivery devices jointly reinforce capacity utilization across every region of the fill-finish pharmaceutical contract manufacturing market. Vendors able to combine high-throughput isolator lines with flexible single-use solutions are securing the most extended contracts, often exceeding 10 years. M&A activity, epitomized by Novo Holdings’ USD 16.5 billion sweep of Catalent, has tightened competitive spacing, prompting second-tier CDMOs to modernize lines with robotics in order to defend their share.
Key Report Takeaways
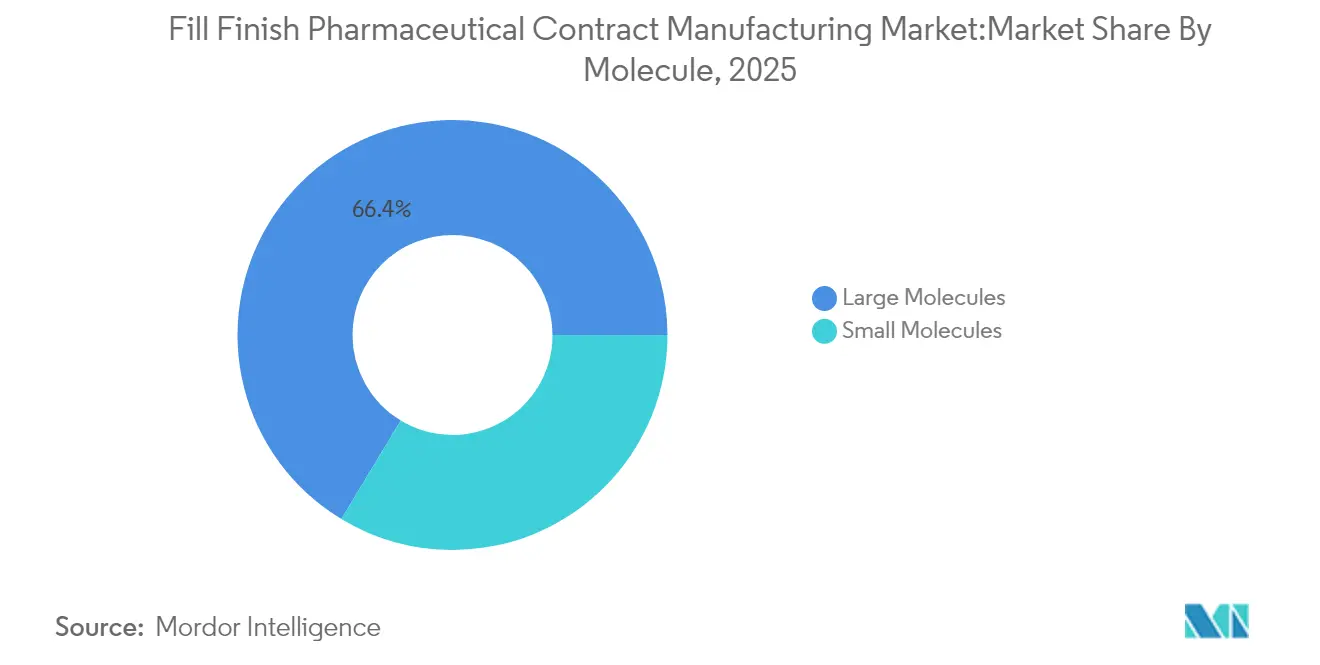
- By molecule, large molecules accounted for 66.35% of the fill-finish pharmaceutical contract manufacturing market share in 2025, while the segment’s 14.12% CAGR keeps it the fastest-rising through 2031.
- By packaging container, prefilled syringes led with 48.15% revenue share in 2025; cartridges are projected to advance at a 12.91% CAGR to 2031.
- By scale of operation, commercial batches held 71.80% of the fill finish pharmaceutical contract manufacturing market size in 2025, whereas clinical scale is slated to grow at 14.72% CAGR.
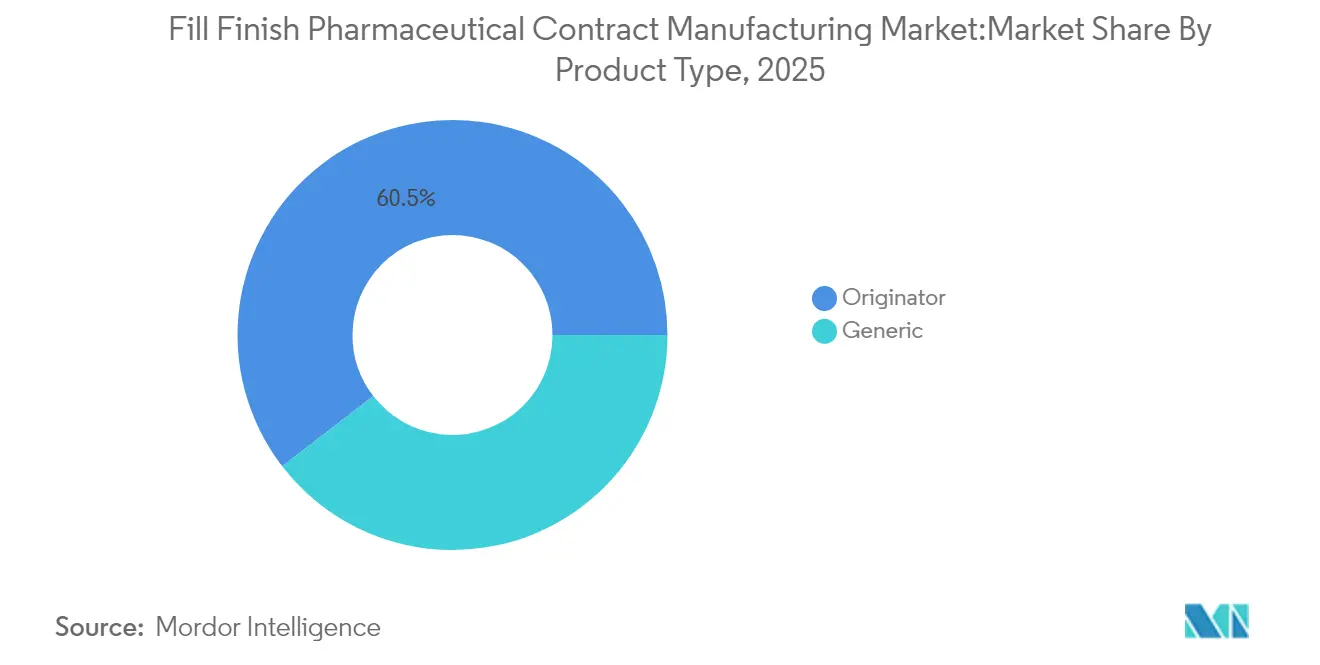
- By product type, originator drugs represented a 60.45% share in 2025, yet generics are set to climb at a 12.52% CAGR.
- By geography, North America remained dominant with a 37.95% share in 2025; Asia Pacific is positioned to expand fastest at 11.08% CAGR.
Note: Market size and forecast figures in this report are generated using Mordor Intelligence’s proprietary estimation framework, updated with the latest available data and insights as of 2026.
Market Trends and Insights
Drivers Impact Analysis of Fill Finish Pharmaceutical Contract Manufacturing Market*
| Driver | (~) % Impact on CAGR Forecast | Geographic Relevance | Impact Timeline |
|---|---|---|---|
| Expanding biologics & biosimilars pipeline | +1.80% | Global, with concentration in North America & Europe | Long term (≥ 4 years) |
| Post-COVID drive for redundant supply nodes | +1.20% | Global, particularly Asia Pacific & North America | Medium term (2-4 years) |
| Accelerated FDA fast-track approvals for orphan drugs | +0.90% | North America, with spillover to EU | Short term (≤ 2 years) |
| CMOs' integrated digital batch-release platforms | +0.70% | Global, led by developed markets | Medium term (2-4 years) |
| Venture-capital funding for specialist sterile lines | +0.50% | North America & Europe | Short term (≤ 2 years) |
| Regional vaccine self-reliance programs | +0.40% | Asia Pacific, Middle East & Africa | Long term (≥ 4 years) |
| Source: Mordor Intelligence | |||
Expanding Biologics & Biosimilars Pipeline
Global biologics revenue is forecast to exceed USD 679.56 billion by 2030, and the FDA cleared 18 biosimilars out of 50 total drug approvals in 2024. Such momentum directly translates into persistent demand for dedicated aseptic suites because most biologics cannot withstand terminal sterilization. Samsung Biologics recently signed a USD 1.4 billion European manufacturing contract that runs until 2030, underscoring how sponsors lock in capacity early. As pipelines become antibody-heavy, the fill-finish pharmaceutical contract manufacturing market strengthens its long-term revenue visibility.
Post-COVID Drive for Redundant Supply Nodes
Pandemic-era disruptions exposed single-region dependence. The U.S. Department of Health and Human Services has prioritized on-shore fill-finish plants to build surge resilience.[1]U.S. Department of Health and Human Services, “Resilient Supply Initiative,” hhs.gov Three-quarters of senior life-science executives plan to maintain at least two geographically separated sterile nodes per product in 2025. Novo Nordisk’s USD 4.1 billion second site in North Carolina doubles its injectable capacity and illustrates redundancy in practice. Chinese provider WuXi Biologics onboarded 151 integrated projects in 2024 as firms hedge capacity across continents. The fill-finish pharmaceutical contract manufacturing market, therefore, benefits from multi-region sourcing strategies that elevate baseline utilization.
Accelerated FDA Fast-Track Approvals for Orphan Drugs
Priority-review designations shrink development time and intensify reliance on specialised CDMOs. The FDA authorised multiple orphan therapies for rare genetic, metabolic and oncology indications in 2024.[2]U.S. Food & Drug Administration, “Advanced Manufacturing Technologies Designation Program Guidance,” fda.gov Such products ship in small, high-value batches and command sophisticated dosing devices. Catalent’s purpose-built line for Sarepta’s gene therapy Elevidys enabled USD 200 million in revenue inside 12 months post-approval. Sponsors reward CDMOs that can compress validation timelines, and the fill-finish pharmaceutical contract manufacturing market secures premium pricing in return.
CMOs’ Integrated Digital Batch-Release Platforms
Advanced digital twins, PAT sensors, and cloud batch records can trim manufacturing costs by up to 70%. The FDA formalized its Advanced Manufacturing Technologies Designation Program in February 2025, offering a 180-day review path for qualifying innovations.[3]U.S. Food & Drug Administration, “Advanced Manufacturing Technologies Designation Program Guidance,” fda.gov Samsung Biologics employs AI-assisted process optimization to drive higher yields and faster lot disposition. CDMOs that deploy these platforms shorten release cycles, win audit confidence, and scale capacity without proportional headcount, reinforcing the fill-finish pharmaceutical contract manufacturing market’s efficiency frontier.
Restraints Impact Analysis of Fill Finish Pharmaceutical Contract Manufacturing Market*
| Restraint | (~) % Impact on CAGR Forecast | Geographic Relevance | Impact Timeline |
|---|---|---|---|
| US–EU serialisation divergence costs | -1.10% | North America & Europe | Medium term (2-4 years) |
| Shortage of experienced aseptic operators | -0.80% | Global, acute in developed markets | Long term (≥ 4 years) |
| Energy-intensive isolator operations inflation risk | -0.60% | Global, particularly Europe | Short term (≤ 2 years) |
| Single-use component supply bottlenecks | -0.40% | Global supply chains | Medium term (2-4 years) |
| Source: Mordor Intelligence | |||
US–EU Serialization Divergence Costs
The United States’ DSCSA and the EU’s unique coding rules require separate data repositories, aggregation hierarchies, and labelling layouts. Dual systems force CDMOs to invest in line-by-line upgrades and duplicate databases, inflating per-unit cost. Multimarket launches now demand sophisticated IT architecture and third-party logistics support, diminishing small providers’ margins within the fill-finish pharmaceutical contract manufacturing market.
Shortage of Experienced Aseptic Operators
Only 42% of entry-level manufacturing associates arrive with bachelor’s degrees, and practical GMP know-how remains scarce. Training can last nine months, yet retirements outpace replacements in Europe and North America. Automation eases the load but does not fully displace manual interventions such as environmental monitoring. Limited talent availability constrains throughput and slows tech-transfer cycles across the fill-finish pharmaceutical contract manufacturing market.
*Our forecasts treat driver/restraint impacts as directional, not additive. The impact forecasts reflect baseline growth, mix effects, and variable interactions.
Fill Finish Pharmaceutical Contract Manufacturing Market Segment Analysis
By Product Type:
Diversifying Generic Pipelines Sustain MomentumOriginator drugs retained 60.45% share of the fill-finish pharmaceutical contract manufacturing market in 2025, underscoring the lasting revenue contribution of branded therapies. Yet generics outpace at a 12.52% CAGR, fuelled by payer pressure and expiring patents. Several Indian plants already produce more than 60% of global small-molecule APIs, channelling substantial downstream demand toward sterile partners. The fill-finish pharmaceutical contract manufacturing market size for generics is expected to climb steadily as biosimilar launches gather speed. Biosimilars claimed 18 of 50 FDA approvals in 2024, strengthening the case for specialised fill lines capable of demonstrating comparability to reference products. CDMOs with platform processes, multiformat filling heads, and rapid change-overs capture this volume. Smaller biotech entrants, lacking capital for purpose-built infrastructure, continue to outsource, reinforcing the trend.
For originators, demand centres on new-format devices and smaller batch sizes. High-value orphan drugs require meticulous environmental controls, and sponsors value CDMOs that manage lifecycle variations without major re-qualification. Consequently, both sub-segments expand, but the superior pace of generics narrows the gap in the fill-finish pharmaceutical contract manufacturing market.


By Packaging Container:
Patient-Centric Formats Set the PacePrefilled syringes commanded 48.15% revenue in 2025, reflecting acceptance among clinicians and patients for ready-to-inject convenience. BD recently multiplied Neopak XtraFlow output sevenfold at its French site, ensuring supply stability for sensitive biologics. Vials hold steady where hospital reconstitution remains standard, yet cartridges show a 12.91% CAGR thanks to growth in pen injectors for diabetes and autoimmune therapy. The fill-finish pharmaceutical contract manufacturing market size for cartridge lines is set to widen because device companies integrate RFID tags that simplify traceability.
Contract manufacturers invest in multipurpose lines that are able to toggle between stoppers, plunger rods, and needle assemblies. Add-on services such as autoinjector kitting emerge as margin enhancers. Dual-chamber and lyophilised device formats, tracked under “Others,” attract niche demand for combination products but require complex validation. Flexibility therefore becomes a decisive procurement criterion across the fill-finish pharmaceutical contract manufacturing market.
By Molecule:
Large-Molecule Dominance DeepensBiologics occupied 66.35% of 2025 revenue and still deliver the briskest 14.12% CAGR. Antibodies, recombinant proteins, and antibody-drug conjugates rely on low-bioburden aseptic protocols and temperature-controlled fill suites, creating high entry thresholds. Samsung Biologics’ fifth plant brought global capacity to 784,000 L, signifying confidence in biologic demand. The fill-finish pharmaceutical contract manufacturing market share tilted further toward biologics because each lot yields limited dose numbers compared with small molecules, magnifying fill-finish volumes.
Small molecules retain relevance, especially in oncology injectables and generic IV solutions. Conventional vial-centric lines remain productive, and upgrades such as retrofit robotics keep them compliant. Yet superior value density of biologics means CDMOs prioritise investments in isolators calibrated for protein integrity, consolidating the lead of the large-molecule segment.
By Scale of Operation:
Clinical Lots Propel Flexible CapacityCommercial batches represented 71.80% of total revenue in 2025 and continue to constitute the baseline workload for every tier-one CDMO. Nevertheless, clinical manufacturing is projected to grow at 14.72% CAGR as biotech pipelines broaden. The fill-finish pharmaceutical contract manufacturing market size allocated to Phase I-III lots increases because fast-track pathways condense timelines and necessitate early engagement with GMP partners. Sponsors frequently continue with the same CDMO into commercial supply, thus making clinical projects key to future backlog.
Clinical orders call for quick changeovers and multiple dosage strengths. CDMOs invest in smaller-scale isolators, 5-to-30 mL filling needles, and fully disposable fluid paths. A digital quality-management stack enables real-time release and supports adaptive trial designs. Providers capable of spanning both scales win repeat business, reinforcing integrated supply models across the fill-finish pharmaceutical contract manufacturing market.
Geography Analysis
North America Fill Finish Pharmaceutical Contract Manufacturing Market
North America held 37.95% of total revenue in 2025, attributable to its advanced regulatory environment and concentration of high-value biologics contracts. The FDA’s Advanced Manufacturing Technologies initiative encourages domestic plants to adopt robotics and continuous flow, keeping the region technologically ahead. Investment commitments such as Novo Nordisk’s second Clayton facility demonstrate continued capital inflows.
Europe Fill Finish Pharmaceutical Contract Manufacturing Market
Europe remains the second-largest cluster. Implementation of the revised EU GMP Annex 1 compelled manufacturers to upgrade HVAC zoning and process-simulated media fills, ensuring a robust quality baseline. Sustainability rules incentivise low-energy isolators, and CDMOs advertising green credentials gain faster approvals from corporate procurement teams.
APAC, MEA and South America Fill Finish Pharmaceutical Contract Manufacturing Market
Asia Pacific records the highest CAGR at 11.08% through 2031. National policies in India, South Korea, and Singapore provide tax holidays and land grants for sterile plants. Chinese provinces subsidise bioreactor installations, while Australia’s expedited clinical-trial visas draw early-phase biologics work. Multinational sponsors diversify risk by lining up Asian reservations for surge demand, sustaining pipeline visibility for regional CDMOs. Middle East & Africa and South America still trail in installed isolator volume, yet gradual policy shifts toward local vaccine finishing could open incremental pockets of the fill-finish pharmaceutical contract manufacturing market. Emerging special economic zones in the Gulf Cooperation Council states and Brazil serve as test beds for modular, prefab sterile pods.

Competitive Landscape
Industry consolidation quickened after Novo Holdings closed Catalent, forging a scale-heavy platform spanning development through distribution. Samsung Biologics countered by bringing Plant 5 online in April 2025, raising total capacity to 784,000 L and enabling concurrent large-molecule contracts. Lonza’s USD 1.2 billion purchase of Roche’s Vacaville facility added 330,000 L of stainless capacity in the United States, broadening its geography and de-risking uptime.
Digitalization forms the next battleground. Operators integrate MES, PAT, and electronic batch records that feed real-time dashboards. Early adopters demonstrate double-digit reductions in investigation cycle times. Continuous vial inspection systems employing automated image analytics cut false-reject rates and enhance yield. Strategic capital now clusters around antibody-drug conjugate suites, cell-and-gene viral vector filling, and micro-batch personalized oncology products. CDMOs marketing end-to-end services from plasmid through final syringe command price premiums and more extended take-or-pay agreements in the fill-finish pharmaceutical contract manufacturing market.
Price competition continues in commodity segments such as small-molecule vials, where regional players in India and Eastern Europe compete on cost. Conversely, high-barrier products witness contract tenures stretching 8–12 years, effectively locking utilization. Firms unable to invest in robotics or sterility-assurance upgrades risk relegation to secondary supplier status.
Fill Finish Pharmaceutical Contract Manufacturing Industry Leaders
Catalent Inc.
Lonza Group
Vetter Pharma
Baxter BioPharma Solutions
Samsung Biologics
- *Disclaimer: Major Players sorted in no particular order
Fill Finish Pharmaceutical Contract Manufacturing Market Companies Covered in this Report
- Catalent
- Lonza Group
- Vetter Pharma
- Baxter BioPharma Solutions
- Samsung Group
- Fresenius
- Recipharm
- Pfizer CentreOne
- Piramal Group
- Alcami
- AbbVie Contract Manufacturing
- Thermo Fisher Scientific (Patheon)
- Ajinomoto Bio-Pharma Services
- Siegfried Holding
- Jubilant HollisterStier
- Symbiosis Pharmaceutical Services
- West Pharmaceutical Services
- Recro Pharma (Siegfried)
- Wuxi Sterile Fill-Finish
- Burrard Pharmaceuticals

Recent Industry Developments in Fill Finish Pharmaceutical Contract Manufacturing Market
- March 2025: LGM Pharma invested USD 6 million to broaden fill-finish capacity in the United States.
- March 2025: Lonza completed its USD 1.2 billion acquisition of Roche’s Vacaville biologics plant and announced a CHF 500 million expansion programme.
- January 2025: Samsung Biologics launched Plant 5 operations, adding 180,000 L of capacity and incorporating AI-guided preventive maintenance.
- January 2025: Purdue University, Eli Lilly, and Merck launched a consortium aimed at accelerating pharmaceutical manufacturing science.
- September 2024: Simtra Biopharma Solutions unveiled a USD 250 million sterile fill-finish expansion to address rising outsourcing demand.


Fill Finish Pharmaceutical Contract Manufacturing Market Report Scope and Research Methodology
Market Definition and Coverage
Our study defines the fill-finish pharmaceutical contract manufacturing market as revenue earned by third-party CMOs that aseptically fill drug substances, small or large molecules, into final dosage containers such as vials, pre-filled syringes, cartridges, or ampoules and then seal, label, and package them for commercial or clinical supply.
Scope exclusion: in-house fill-finish operations owned by innovator or generic drug makers are not counted.
Segments Covered in This Report
- By Product Type
- Generic
- Originator
- By Primary Packaging Container
- Prefilled Syringes
- Cartridges
- Vials
- Others
- By Molecule
- Large Molecules
- Small Molecules
- By Scale of Operation
- Clinical
- Commercial
- By Geography
- North America
- United States
- Canada
- Mexico
- Europe
- Germany
- United Kingdom
- France
- Italy
- Spain
- Rest of Europe
- Asia Pacific
- China
- Japan
- India
- South Korea
- Australia
- Rest of Asia Pacific
- Middle East & Africa
- GCC
- South Africa
- Rest of Middle East & Africa
- South America
- Brazil
- Argentina
- Rest of South America
- North America
Data Sources, Market Sizing, and Validation
Primary Research
Mordor analysts interviewed procurement leads at mid-size biotechs, plant managers at multi-site CDMOs across North America, Europe, and Asia, and regulatory consultants familiar with Annex 1 revisions. These conversations validated utilization rates, average service prices, and emerging demand for high-concentration biologics, filling several data gaps we met in desk work.
Desk Research
We began by mapping the global installed base of sterile filling lines through public FDA Establishment Registrations, EMA EudraGMDP listings, and trade association rosters such as ISPE and PDA. Government trade data on pharmaceutical formulations (HS 3004) and export unit values helped us size regional demand pools, while clinical-trial registries revealed pipeline volumes that require outsourced sterile capacity. Company 10-Ks, recent plant-expansion press releases, and Form 483 warning-letter trends further guided our understanding of capacity constraints. Paid intelligence from D&B Hoovers and Dow Jones Factiva gave us revenue splits for private CMOs. This list is illustrative; many other reputable sources supported data gathering and sanity checks.
Market-Sizing & Forecasting
We used a top-down model that reconstructs spending by linking injectable drug demand, average fill volumes, and observed outsourcing penetration. We then corroborated totals through selective bottom-up roll-ups of publicly reported CMO revenues. Key variables like biologics IND counts, pre-filled syringe adoption, global vaccine dose output, EU Annex 1 compliance investments, and capacity-utilization swings feed a multivariate regression to forecast to 2030. Bottom-up gaps, where private CMOs give limited disclosure, were bridged with region-specific ASP × volume samples shared during interviews.
Data Validation & Update Cycle
Outputs pass a three-layer check: automated variance flags, peer review by a senior analyst, and a quarterly cross-match against new facility announcements or pricing shifts. Reports refresh every twelve months, with rapid updates if material events alter baseline assumptions.
How Mordor Intelligence's Fill Finish Pharmaceutical Contract Manufacturing Market Size Compares to Other Published Estimates
Published figures often diverge because firms mix captive production, consumables, or even complete vaccine value chains with pure play CMO revenues.
Key gap drivers include scope creep into in-house lines, one-off COVID burst volumes, unvalidated ASP inflation methods, and conversion at spot exchange rates, whereas Mordor locks its base case to outsourced sterile services only and applies blended five-year currency averages.
Benchmark comparison
| Market Size | Anonymized source | Primary gap driver |
|---|---|---|
| USD 6.43 B (2025) | Mordor Intelligence | |
| USD 19.51 B (2025) | Global Consultancy A | Captive fill-finish and packaging consumables included |
| USD 11.97 B (2024) | Industry Association B | Relies on shipment values without sterile-compliance filter |
These contrasts show that Mordor's disciplined scope selection and twice-validated model give executives a balanced, transparent baseline they can trace back to clear variables and repeatable steps.


Key Questions Answered in the Report
What is the current worth of the fill-finish pharmaceutical contract manufacturing market?
The fill-finish pharmaceutical contract manufacturing market size is USD 6.83 billion in 2026 and is projected to rise to USD 9.21 billion by 2031 at 6.17% CAGR over 2026-2031.
Which molecule class drives the strongest demand for contract fill-finish services?
Large molecules lead with 66.35% market share in 2025 and are expanding at a 14.12% CAGR over 2026-2031 owing to sustained biologics and antibody-drug conjugate pipelines.
Why are prefilled syringes preferred over vials?
Prefilled syringes enhance patient safety, minimize dosing errors and streamline hospital workflows, helping them secure 48.15% of market revenue in 2025.
What CAGR is expected for clinical-scale outsourcing?
Clinical batches are forecast to grow at 14.72% CAGR over 2026-2031 as accelerated approval pathways shorten development cycles and raise early-phase outsourcing.
How is digitalization influencing competition among CDMOs?
Integrated electronic batch records and PAT systems reduce release times and bolster regulatory compliance, allowing tech-forward CDMOs to win long-tenure, premium contracts.
Which region is growing fastest and why?
Asia Pacific posts the highest 11.08% CAGR over 2026-2031, supported by government incentives, expanding biologics pipelines and sponsors’ drive to establish multi-region capacity buffers.
Page last updated on:


