Cell And Gene Therapy Contract Development And Manufacturing Organization Market Size and Share
Market Overview
| Study Period | 2020 - 2031 |
|---|---|
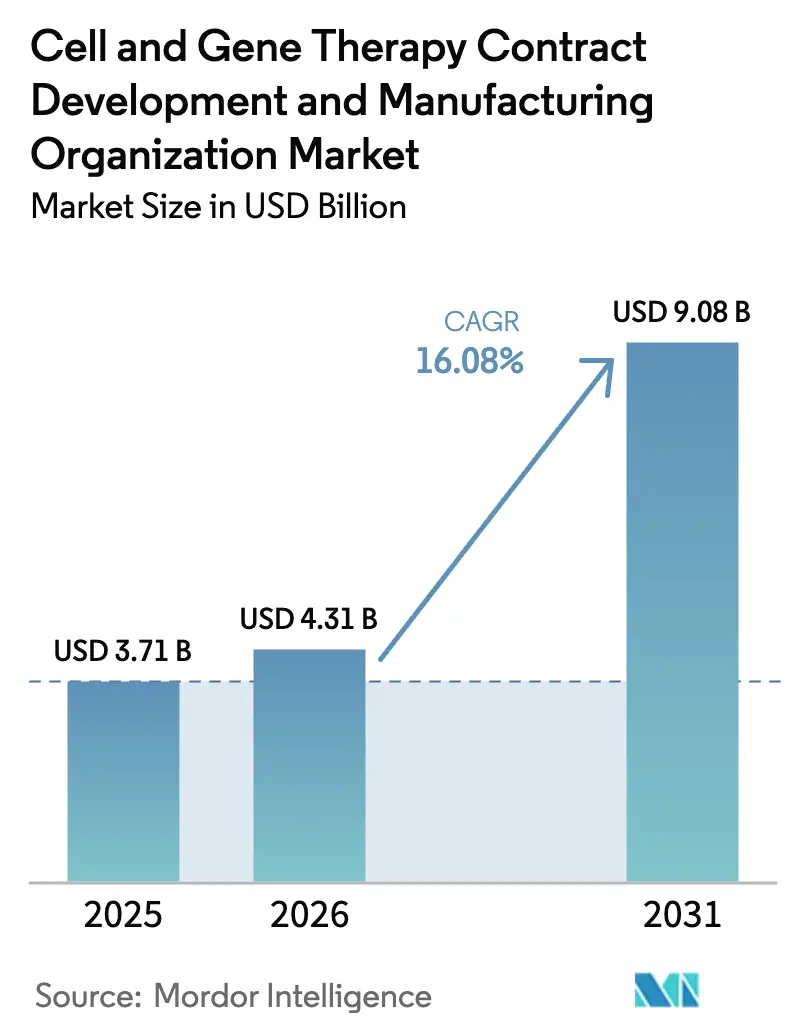
| Market Size (2026) | USD 4.31 Billion |
| Market Size (2031) | USD 9.08 Billion |
| Growth Rate (2026 - 2031) | 16.08% CAGR |
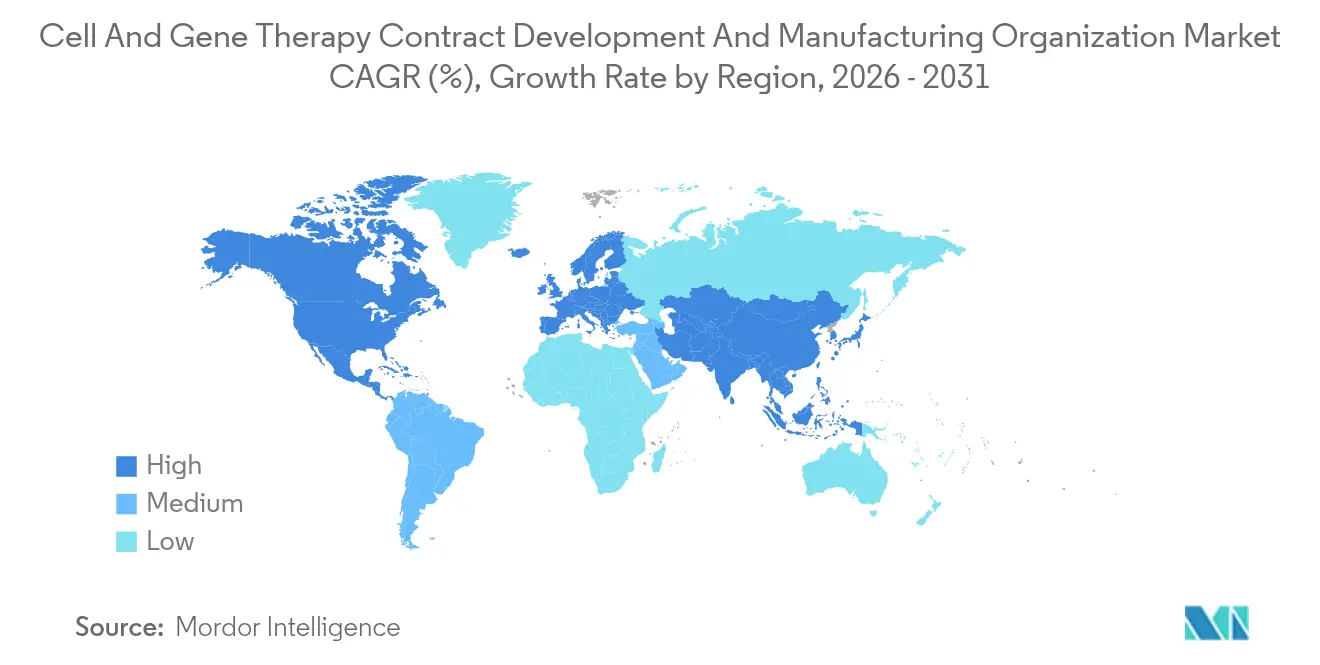
| Fastest Growing Market | Asia Pacific |
| Largest Market | North America |
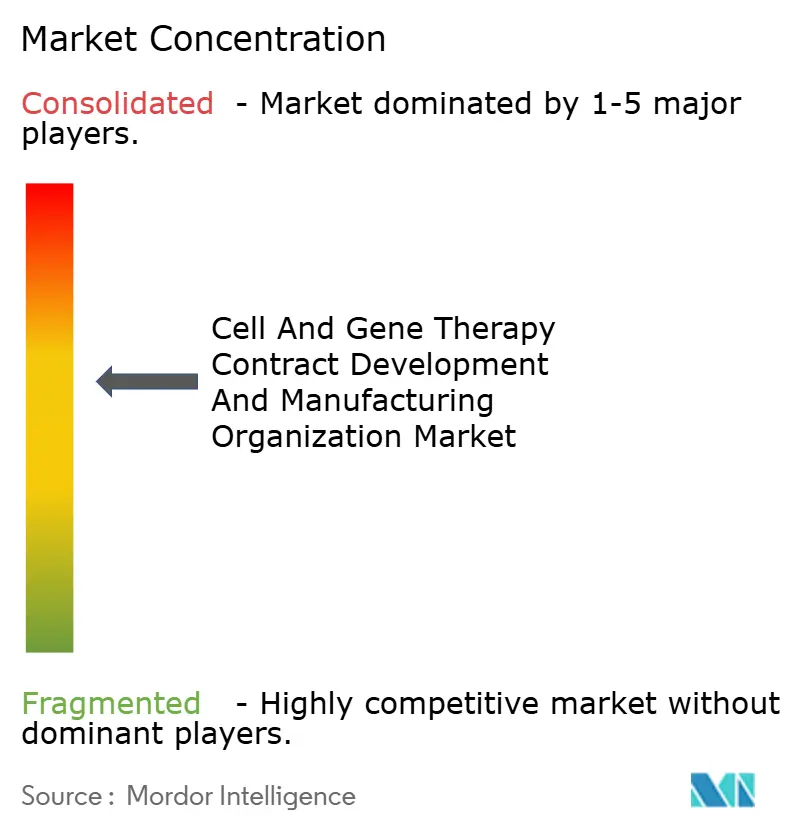
| Market Concentration | Medium |
Major Players *Disclaimer: Major Players sorted in no particular order Image © Mordor Intelligence. Reuse requires attribution under CC BY 4.0. | |
Cell And Gene Therapy Contract Development And Manufacturing Organization Market Analysis by Mordor Intelligence
The cell and gene therapy contract development and manufacturing organization market size is valued at USD 3.71 billion in 2025. The cell and gene therapy contract development and manufacturing organization market is expected to grow from USD 3.71 billion in 2025 to USD 4.31 billion in 2026 and is forecast to reach USD 9.08 billion by 2031 at 16.08% CAGR over 2026-2031. This steep trajectory stems from a robust pipeline of more than 2,000 clinical and pre-clinical projects, an environment in which regulatory agencies expect 10–20 approvals annually through 2025. CDMOs have therefore embarked on an intense capacity race, with more than USD 10 billion of announcements since 2024, led by Samsung Biologics’ quest for 784,000 L by 2025 and Lonza’s USD 1.2 billion Vacaville purchase securing 330,000 L for viral vectors. Consolidation is increasing as Novo Holdings spent USD 16.5 billion on Catalent, highlighting the appeal of vertical integration and sparking speculation about further mergers. Despite expansion, post-COVID over-capacity has pushed utilization in some plants below 70%, forcing providers to add higher-margin analytical and process-development services.
Key Report Takeaways
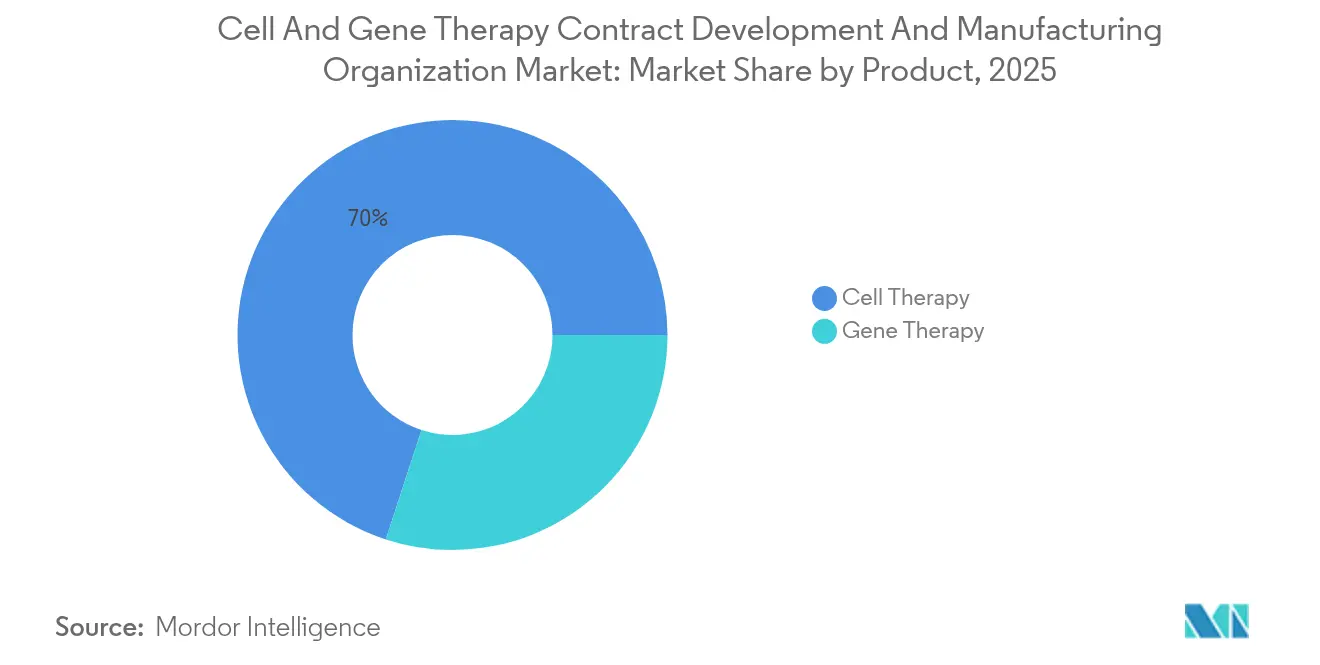
- By product, cell therapy held 69.98% of the cell and gene therapy contract development and manufacturing organization market share in 2025, while gene therapy is set to post the fastest 16.85% CAGR to 2031.
- By stage, pre-clinical and R&D activities represented 70.25% of revenue in 2025; commercial manufacturing will advance at a 14.92% CAGR.
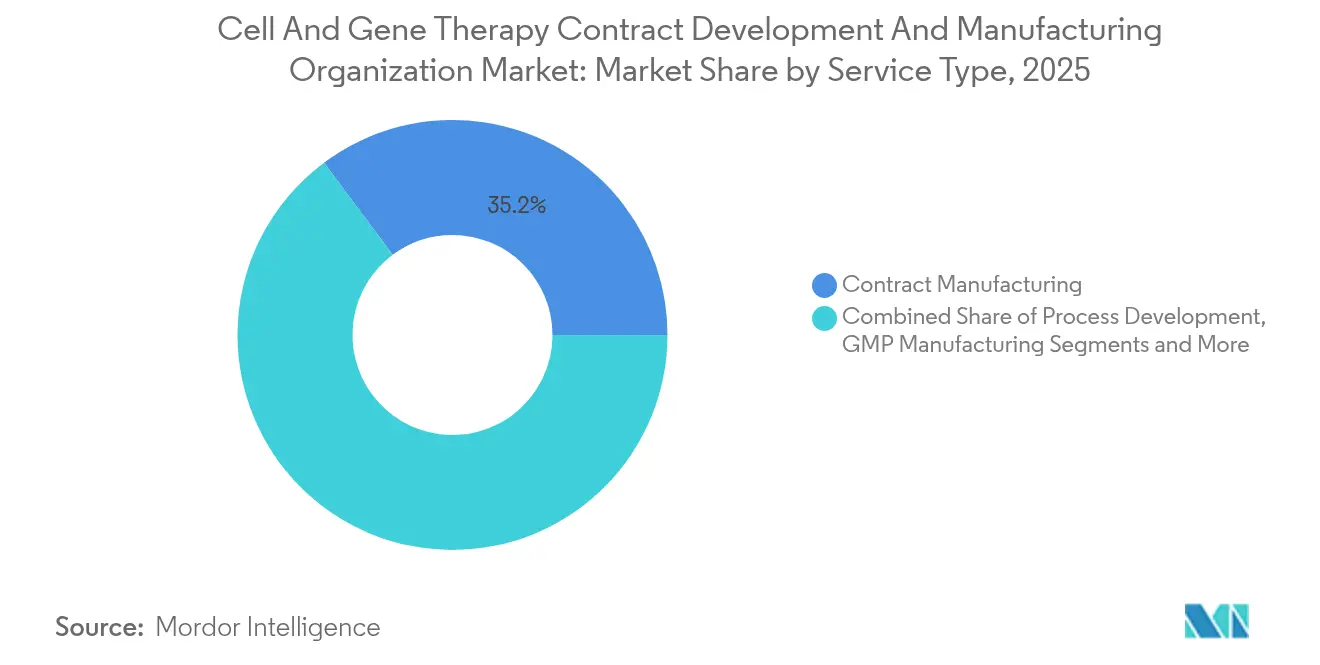
- By service type, contract manufacturing accounted for 35.20% of the mix in 2025, whereas GMP manufacturing is projected to rise at 13.05% CAGR through 2031.
- By geography, North America led with a 43.75% share in 2025; Asia Pacific is poised for the quickest 16.12% CAGR.
Note: Market size and forecast figures in this report are generated using Mordor Intelligence’s proprietary estimation framework, updated with the latest available data and insights as of 2026.
Global Cell And Gene Therapy Contract Development And Manufacturing Organization Market Trends and Insights
Drivers Impact Analysis*
| Driver | (~) % Impact on CAGR Forecast | Geographic Relevance | Impact Timeline |
|---|---|---|---|
| Rise In CGT Clinical Pipeline | +4.20% | Global, with concentration in North America & EU | Medium term (2-4 years) |
| Rising Prevalence Of Genetic Diseases & Cancer | +3.80% | Global, with higher impact in developed markets | Long term (≥ 4 years) |
| VC & Big-Pharma Funding Surge | +2.90% | North America & EU primarily, expanding to APAC | Short term (≤ 2 years) |
| Outsourcing Preference Of Small CGT Developers | +2.10% | Global, with early adoption in North America | Medium term (2-4 years) |
| Allogeneic "Off-The-Shelf" Platforms Needing Large-Batch CDMO Capacity | +1.80% | North America & EU core, expansion to APAC | Long term (≥ 4 years) |
| Global CMC Dossier Harmonisation (FDA-EMA-PMDA) Shortening Multi-Region Launches | +1.40% | Global, with primary impact in regulatory-aligned markets | Medium term (2-4 years) |
| Source: Mordor Intelligence | |||
Rise in CGT Clinical Pipeline
Over 2,000 active programs are in development, a figure that dwarfs the capacity commissioned before 2024.[1]Science Translational Medicine, “Emerging Cell and Gene Therapies,” sciencemag.org The US FDA created the Office of Therapeutic Products to streamline reviews and anticipates double-digit approvals each year through 2025. Each candidate demands bespoke viral-vector or cell-expansion workflows, expertise that most sponsors lack internally. Commercial approvals such as Casgevy, Lyfgenia, and prademagene zamikeracel validate demand and trigger multi-batch clinical supply orders. North America and Europe host 80% of trials, straining local facilities and allowing premium pricing. The driver, therefore, underpins sustained double-digit growth for the cell and gene therapy contract development and manufacturing organization market.
Rising Prevalence of Genetic Diseases & Cancer
Roughly 400 million patients live with a genetic disorder, and global cancer incidence is increasing 2–3% a year.[2].Journal of Cellular and Molecular Medicine, “Genetic Disease Burden,” onlinelibrary.wiley.comPrecision-medicine advances have unlocked previously untreatable targets using vector-based approaches. CAR-T therapies now command list prices of USD 400,000–500,000 and demonstrate the willingness of payers to reimburse one-time interventions.[3]FDA, “Office of Therapeutic Products Guidance,” fda.gov Ageing demographics in high-income regions swell the eligible population, while contingency approvals for diabetes and cardiovascular gene therapies hint at mainstream uptake. CDMOs well-positioned to supply larger batch sizes will benefit most as the indication size widens.
VC & Big-Pharma Funding Surge
Biopharma companies and venture funds poured more than USD 15 billion into CGT deals during 2024. Novo Holdings’ USD 16.5 billion Catalent buyout underscores strategic intent to secure capacity. Capital flows shorten the time from discovery to Phase I, translating to a rising orderbook for process development and GMP lots. The influx is regionally skewed: 74% of disclosed financings originated in the United States and Europe, which exacerbates capacity imbalances relative to APAC. The trend fuels both supply additions and demand creation, accelerating revenue for the cell and gene therapy contract development and manufacturing organization market.
Outsourcing Preference of Small CGT Developers
Building a dedicated vector or cell-processing suite costs USD 50–100 million and can take 18–24 months. Start-ups, therefore, outsource activities such as process optimization, fill-finish, and analytical testing—even larger firms hedge risk by reserving external slots to avoid plant downtime. Robotic systems like Cellular Origins’ NeedleE™ and Cytiva’s Chronicle™ improve reproducibility yet remain capital-intensive, further steering innovators toward CDMOs with installed automation. The pattern is strongest in the United States, where demand for skilled labour outstrips supply, lifting order lead times to 9–12 months.
Restraints Impact Analysis*
| Restraint | (~) % Impact on CAGR Forecast | Geographic Relevance | Impact Timeline |
|---|---|---|---|
| Limited High-Throughput Analytics For Large-Scale AAV Production | -2.80% | Global, with acute impact in North America & EU | Medium term (2-4 years) |
| Complex, Manual-Intensive Manufacturing & Regulatory Hurdles | -2.10% | Global, with varying regulatory complexity by region | Long term (≥ 4 years) |
| Shortage Of GMP-Grade Plasmid & Viral Raw Materials | -1.90% | Global supply chain impact, acute in APAC | Short term (≤ 2 years) |
| Post-COVID CDMO Over-Capacity Driving Margin Squeeze | -1.60% | North America & EU primarily, limited APAC impact | Short term (≤ 2 years) |
| Source: Mordor Intelligence | |||
Limited High-Throughput Analytics for Large-Scale AAV Production
Complete AAV lot release now demands up to four weeks, largely due to capsid-ratio assays and genome integrity tests. Slow analytical turnaround restricts campaign throughput and inflates inventory costs. Equipment vendors are launching automation modules, but regulatory validation prolongs adoption. The bottleneck is pronounced in US and European plants, where compliance expectations remain highest. CDMOs investing in inline analytics and machine-learning-driven release will achieve competitive differentiation.
Complex, Manual-Intensive Manufacturing & Regulatory Hurdles
Viral-vector purification and cell-handling steps still rely on operator interventions, contributing 40–60% to COGS. Manual activity raises batch-failure risk and complicates scale-up. Concurrently, the 2024 FDA guidance expanded documentation on comparability and potency assays. Combined complexity elongates tech-transfer timelines and raises barriers for new entrants. Incremental automation—robotic line loading, closed-system harvest, and AI-driven scheduling—promises relief but demands validation programmes that newly capitalised CDMOs must fund.
*Our forecasts treat driver/restraint impacts as directional, not additive. The impact forecasts reflect baseline growth, mix effects, and variable interactions.
Segment Analysis
By Product: Cell Therapy Dominance Faces Gene Therapy Acceleration
Cell therapy commanded 69.98% of the cell and gene therapy contract development and manufacturing organization market in 2025, buoyed by six commercial CAR-T products and an expanding allogeneic pipeline. Stem-cell platforms account for the largest share in cell therapy, favoured for established expansion, cryopreservation, and QC workflows. Engineered cell approaches such as CAR-NK and γδ T cells are gaining speed as improved gene-editing tools shorten development cycles. Despite its smaller base, gene therapy is projected to register a 16.85% CAGR through 2031, closing the gap swiftly. Viral vectors—particularly AAV—retain pricing power given their safety and tissue-tropism advantages. The first FDA-cleared European-manufactured batch of Iovance’s AMTAGVI in 2024 underscored commercial viability and opened cross-border supply lines. Non-viral modalities, notably lipid nanoparticles and minicircle DNA, are drawing capital because they can circumvent immunogenicity and scaling issues inherent to viral systems.
Batch sizes for allogeneic cell therapies are forecast to rise fivefold, driving demand for 2,000 L closed bioreactors and automated sterile welding systems. Gene therapy manufacturing, once restricted to 200 L batches, is rapidly migrating to 1,000 L–2,000 L single-use fermenters, compressing the cost per dose. Synergies exist: CDMOs with dual-capability suites can cross-utilize upstream operations, raising asset utilization rates and cushioning the impact of any one modality cycle.


By Stage: Pre-clinical Volume Contrasts Commercial Value
Pre-clinical and R&D projects represented 70.25% of the cell and gene therapy contract development and manufacturing organization market in 2025 because the majority of pipeline assets remain in discovery or IND-enabling phases. Sponsors purchase small lots, often under 5 L, for formulation screening, vector mapping, and proof-of-concept studies. While volumes are modest, margins sit above 40% due to limited competition and high value-added consulting baked into contracts. As the pipeline matures, the number of Phase II and Phase III projects requiring GMP clinical supply is expanding at 14% annually, moving demand into more systematized, lower-margin production.
Although commercial manufacturing accounts for only 9.35% of 2025 volumes, it is the fastest-growing segment, with a 14.92% CAGR to 2031. Commercial production commands premium long-term contracts, often five-year take-or-pay structures, which help CDMOs amortize capital builds. However, the quality of life from commercial revenues is tempered by heightened regulatory scrutiny and warranty clauses that expose providers to batch liability. CDMOs are investing in redundant clean modular rooms and SAP-integrated MES platforms to pass FDA pre-approval inspections without delays.
By Service Type: GMP Manufacturing Emerges as Growth Leader
Contract manufacturing held 35.20% of the cell and gene therapy development and manufacturing organization market in 2025, encompassing both clinical and commercial batch production. Underpinning demand is the scarcity of BSL-2/BSL-2+ compliant suites, which many innovators regard as a structural hurdle. GMP manufacturing revenues are now advancing at a 13.05% CAGR to 2031, thanks to the swell of Phase III studies requiring validated, reproducible lots; CDMOs with global quality systems benefit most. Process-development engagements remain sticky, averaging 18–24 months, and create a funnel for future GMP contracts.
Analytical services, once an ancillary revenue stream, are becoming mission-critical. The cell and gene therapy contract development and manufacturing organization market share for analytical testing is expected to rise as CDMOs expand vector genome titer assays, potency testing, and release analytics in-house for speed. Fill-finish, cryogenic packaging, and last-mile logistics capture client demand for integrated offerings. A shift toward pay-as-you-go testing and cloud-based data hand-off platforms improves transparency yet requires investment in cybersecurity and LIMS harmonization.
Geography Analysis
North America generated 43.75% of global revenue in 2025, supported by the FDA’s clear pathways, a dense cluster of start-ups, and an investor base willing to underwrite early clinical studies. The United States alone hosted more than 60% of active trials, compelling CDMOs such as Thermo Fisher to commit USD 475 million for a Princeton expansion and Samsung Biologics to allocate capacity through strategic partnerships. However, the region’s cost base and a tightening labour pool inflate delivery times. CDMOs respond by raising process-development fees and offering workforce-training partnerships with community colleges to stabilize recruitment.
Asia Pacific is projected to deliver the fastest 16.12% CAGR through 2031, challenging historic dominance. China’s National Development and Reform Commission funded multiple industrial parks, with WuXi Biologics adding capacities in Singapore and the United States while simultaneously expanding its Wuxi campus. Japan’s Pharmaceuticals and Medical Devices Agency created a Fast Track similar to the US Breakthrough Therapy tag, cutting median review times by four months. South Korea’s Lotte Biologics has earmarked USD 3.3 billion for a 400,000 L plant in Incheon, signalling intent to anchor regional demand. Cost-competitive labour and modern infrastructure give the region pricing leverage that lures Western innovators into joint ventures.
Europe maintains a mature but slower-growth profile. EMA’s centralised authorisation system offers predictability, yet divergent national GMP inspections and higher energy costs temper agility. Lonza’s Visp campus and AGC Biologics’ Heidelberg facility continue to draw projects that value track record over price. Cross-border supply chains connect European batch release to Middle Eastern clinical sites, illustrating the region’s role as a regulatory fulcrum. Meanwhile, pockets of greenfield investment appear in Ireland and Portugal, driven by grants and skilled talent availability.

Competitive Landscape
The top five suppliers—Lonza, Samsung Biologics, Thermo Fisher, Catalent (post-deal), and Charles River—together controlled a significant share of 2024 revenues, leaving a long tail of niche providers. These heavyweights invest in single-use reactor farms, digital twins, and AI-based deviation prediction to sustain margins despite utilization swings. Thermo Fisher’s USD 2 billion, four-year capital programme and Charles River’s lentiviral pact with the Gates Institute illustrate the scale of strategic spending.
Mid-tier specialists carve niches: WuXi Advanced Therapies offers end-to-end vector services, AGC Biologics leverages Yokohama and Heidelberg for autologous cell-processing, and FUJIFILM Diosynth focuses on structured platform processes. Disruptors such as Cellares (CellShuttle) and Ori Biotech (IRO) do not replicate full CDMO portfolios; instead, they license modular closed-system hardware that legacy providers install to lift throughput. Technology adoption thus acts as the decisive moat, with automation shortening turnaround times by up to 40%.
Geographic challenges add complexity. Singapore grants tax holidays for new vector suites, and the United Arab Emirates courts European CDMOs to base fill-finish lines near growing patient populations. As competition intensifies, price concessions on large, long-term contracts have emerged, particularly for autologous programs with uncertain commercial volumes. Nonetheless, integrated providers that pair regulatory consulting, material sourcing, and distribution remain best placed to stretch share.
Cell And Gene Therapy Contract Development And Manufacturing Organization Industry Leaders
Catalent Inc
Lonza Group
Recipharm AB
Charles River Laboratories International Inc
Wuxi Advanced Therapies
- *Disclaimer: Major Players sorted in no particular order

Recent Industry Developments
- July 2025: Charles River Laboratories announced a lentiviral vector manufacturing collaboration with the Gates Institute at the University of Colorado Anschutz Medical Campus, expanding its gene-therapy capabilities.
- April 2025: Thermo Fisher Scientific committed USD 2 billion to US manufacturing and R&D, with USD 1.5 billion earmarked for capacity expansion and USD 500 million for innovation projects.
- April 2025: Thermo Fisher launched the 5 L DynaDrive single-use bioreactor, claiming 27% higher productivity and seamless scale-up to 5,000 L.
- March 2025: WuXi Biologics debuted the EffiX microbial expression platform to raise plasmid DNA yields for CGT components.


Global Cell And Gene Therapy Contract Development And Manufacturing Organization Market Report Scope
As per the scope of the report, cell and gene therapy contract development and manufacturing organization (CDMO) services refer to specialized offerings provided by companies that support the development, production, and testing of cell and gene therapies. These therapies involve the use of living cells or genetic material to treat diseases. The cell and gene therapy contract development and manufacturing organization market is segmented by product (cell therapy and gene therapy), source (pre-clinical, clinical, and commercial), indication (oncology, cardiovascular disease, infectious disease, genetic disorders, neurological disorders, and other indications), and geography (North America, Europe, Asia-Pacific, the Middle East and Africa, and South America). The report also covers the estimated market sizes and trends for 17 countries across major regions globally.
The report offers the value (in USD) for the above segments.
| Cell Therapy | Stem-cell-based |
| Non-stem-cell-based | |
| Other cell therapies | |
| Gene Therapy | Viral Vectors |
| Non-viral Vectors |
| Pre-clinical |
| Clinical |
| Commercial |
| Process Development |
| GMP Manufacturing |
| Analytical Testing / QC |
| Fill-Finish & Packaging |
| North America | United States |
| Canada | |
| Mexico | |
| Europe | Germany |
| United Kingdom | |
| France | |
| Italy | |
| Spain | |
| Rest of Europe | |
| Asia Pacific | China |
| Japan | |
| India | |
| South Korea | |
| Australia | |
| Rest of Asia Pacific | |
| Middle East & Africa | GCC |
| South Africa | |
| Rest of Middle East & Africa | |
| South America | Brazil |
| Argentina | |
| Rest of South America |
| By Product | Cell Therapy | Stem-cell-based |
| Non-stem-cell-based | ||
| Other cell therapies | ||
| Gene Therapy | Viral Vectors | |
| Non-viral Vectors | ||
| By Stage | Pre-clinical | |
| Clinical | ||
| Commercial | ||
| By Service Type | Process Development | |
| GMP Manufacturing | ||
| Analytical Testing / QC | ||
| Fill-Finish & Packaging | ||
| Geography | North America | United States |
| Canada | ||
| Mexico | ||
| Europe | Germany | |
| United Kingdom | ||
| France | ||
| Italy | ||
| Spain | ||
| Rest of Europe | ||
| Asia Pacific | China | |
| Japan | ||
| India | ||
| South Korea | ||
| Australia | ||
| Rest of Asia Pacific | ||
| Middle East & Africa | GCC | |
| South Africa | ||
| Rest of Middle East & Africa | ||
| South America | Brazil | |
| Argentina | ||
| Rest of South America | ||


Key Questions Answered in the Report
What is the current value of the cell and gene therapy contract development and manufacturing organization market?
The market stands at USD 4.31 billion in 2026 and is on track to reach USD 9.08 billion by 2031 at a 16.08% CAGR.
Which segment is the largest contributor to revenue?
Cell therapy leads with 69.98% share in 2025 driven by approved CAR-T products and a deep allogeneic pipeline.
Which region is expanding fastest?
Asia Pacific is forecast to grow at 16.12% CAGR to 2031 thanks to Chinese, Japanese, and Korean capacity investments.
Why are CDMOs investing heavily in automation?
Manual steps contribute up to 60% of costs and elevate failure risk; automation improves reproducibility and reduces turnaround.
How is industry consolidation influencing pricing?
Mega-deals like Novo Holdings’ purchase of Catalent shrink the supplier pool, giving remaining independents greater pricing leverage while pushing sponsors toward multi-year capacity reservations.
What capabilities differentiate leading CDMOs?
Integrated viral-vector and cell-processing suites, advanced analytics, and global regulatory expertise allow providers to handle end-to-end programmes from IND to commercial launch.
Page last updated on:


