Market Overview
| Study Period | 2019 - 2030 |
|---|---|
| Base Year For Estimation | 2024 |
| Forecast Data Period | 2025 - 2030 |
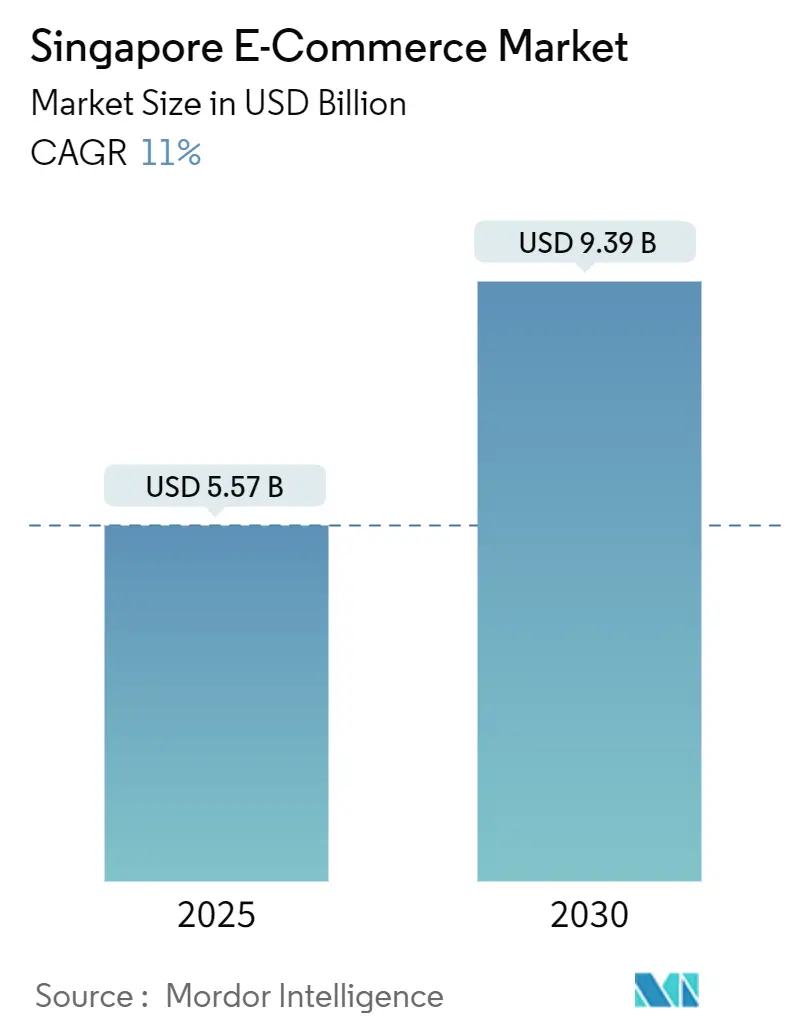
| Market Size (2025) | USD 5.57 Billion |
| Market Size (2030) | USD 9.39 Billion |
| Growth Rate (2025 - 2030) | 11.00% CAGR |
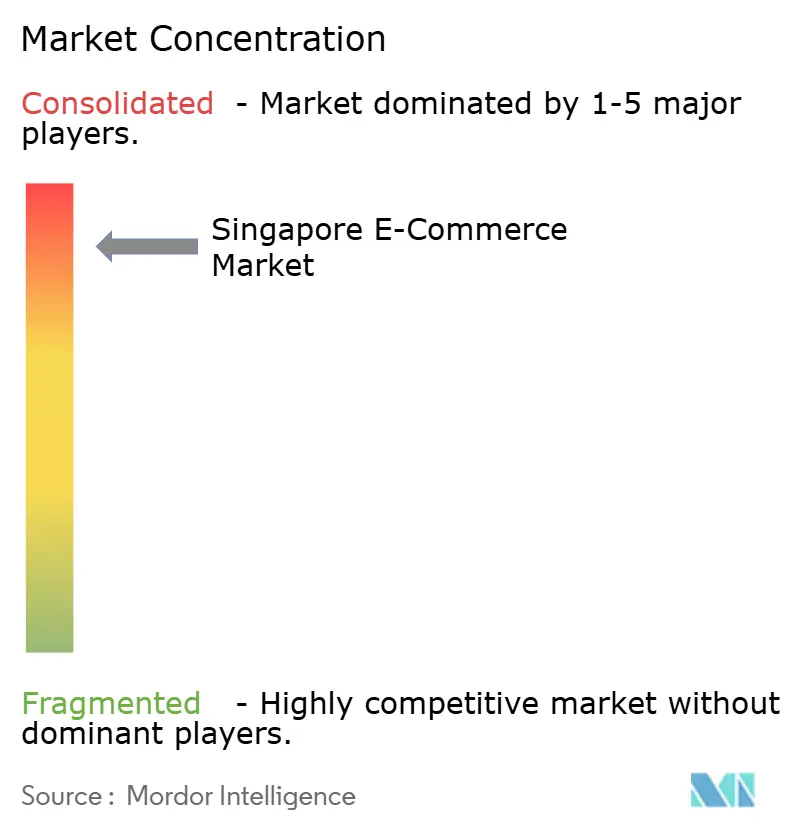
| Market Concentration | High |
Major Players
*Disclaimer: Major Players sorted in no particular order Image © Mordor Intelligence. Reuse requires attribution under CC BY 4.0. |
|
Singapore E-Commerce Market Analysis by Mordor Intelligence
The Singapore e-commerce market size stood at USD 5.57 billion in 2025 and is projected to reach USD 9.39 billion by 2030, translating into an 11% CAGR over the forecast window. Robust digital-wallet adoption, government-led invoicing reforms, and same-day fulfillment investments collectively accelerate platform revenues and reinforce Singapore’s status as a digital trade gateway in Southeast Asia. Mobile apps secured 78.13% of online orders in 2024 as shoppers gravitated toward live-stream content, while B2B marketplaces recorded the fastest sub-sector momentum on the back of mandatory Peppol-based e-invoices. Rising cross-border flows through Tuas Port and Changi Airport’s logistics park upgrades further amplify merchant reach, and aggressive AI spending by market leaders enhances personalized shopping experiences, catalyzing repeat purchase behavior. At the same time, elevated scam activity and compliance costs nudge operators toward heavier fraud-analytics outlays, which could compress margins in the near term.
Key Report Takeaways
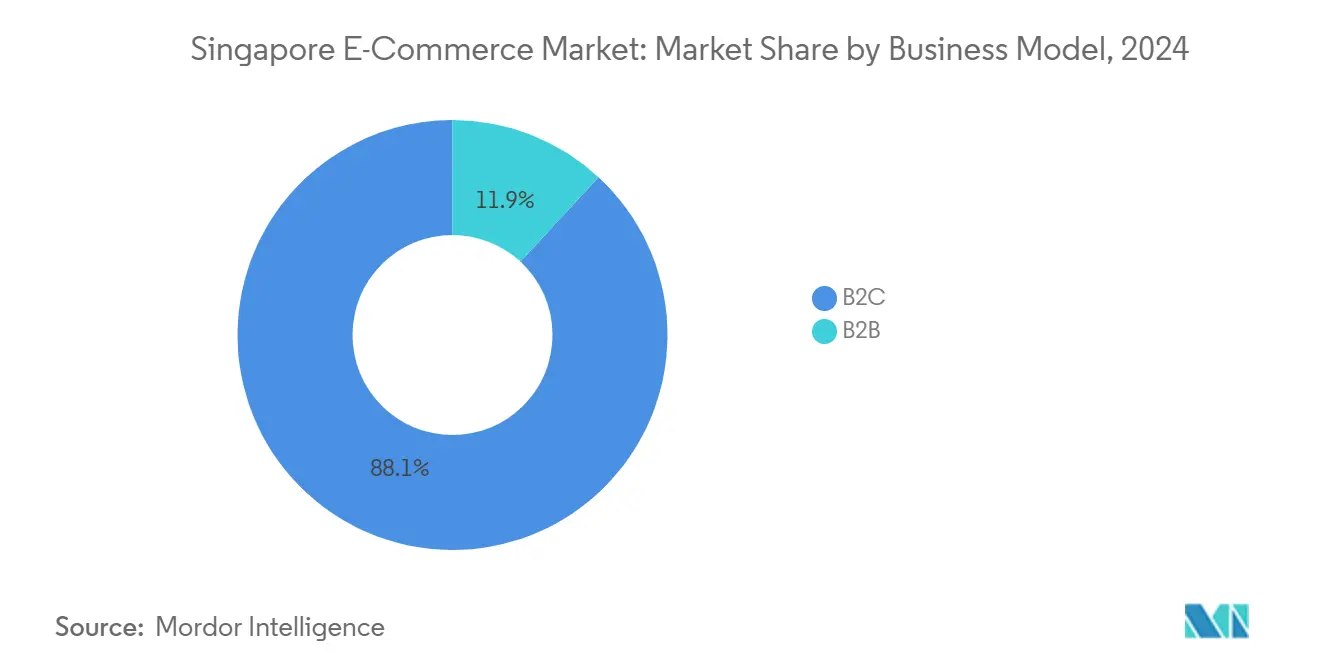
- By business model, B2C accounted for 88.12% revenue share of the Singapore e-commerce market in 2024, while the B2B segment is advancing at a 12.67% CAGR through 2030.
- By product category for B2C e-commerce, consumer electronics led with 47.41% revenue share in 2024; other payment modes is forecast to expand at a 12.45% CAGR.
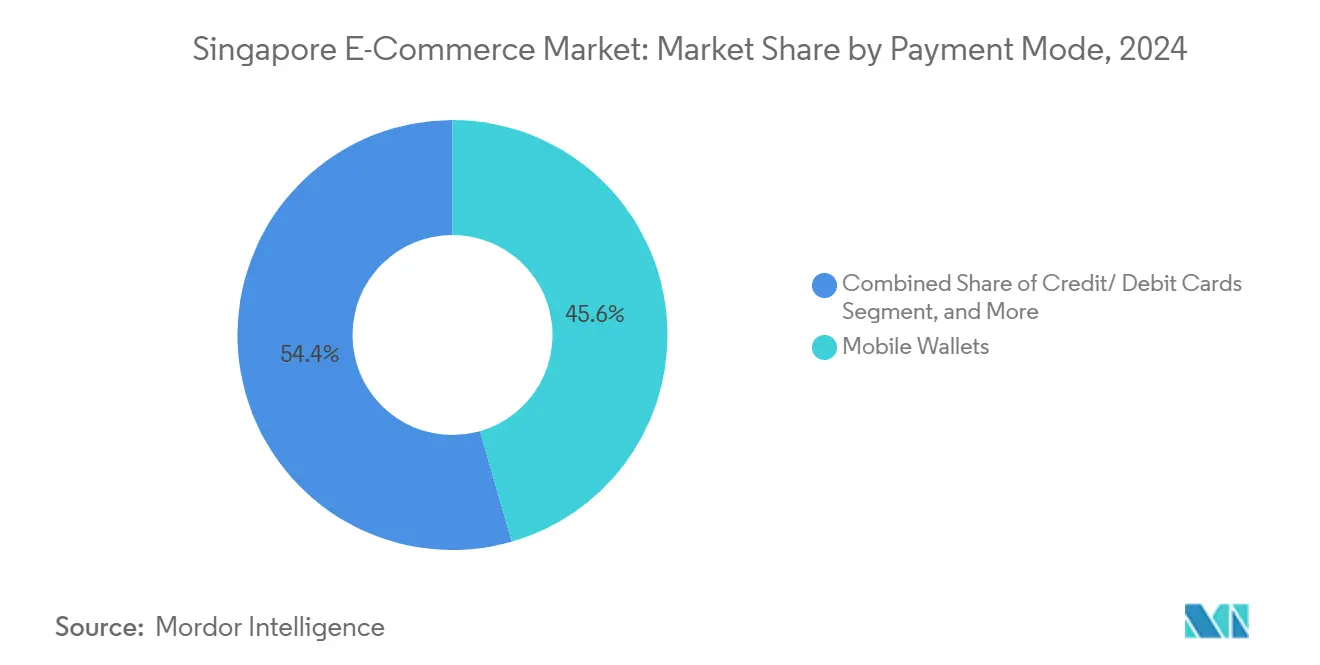
- By payment mode for B2C e-commerce, mobile wallets captured 45.56% share of the Singapore e-commerce market size in 2024 and other payment modes is climbing at a 13.13% CAGR through 2030.
- By device type for B2C e-commerce, smartphone apps represented 78.13% of transactions in 2024 and are growing at a 12.12% CAGR between 2025-2030.
Singapore E-Commerce Market Trends and Insights
Drivers Impact Analysis
| Driver | (~) % Impact on CAGR Forecast | Geographic Relevance | Impact Timeline |
|---|---|---|---|
| Rising digital-wallet penetration | +2.1% | National, with higher adoption in Central and West regions | Medium term (2-4 years) |
| Mandatory nationwide e-invoice adoption for B2B (2025) | +1.8% | National, with concentrated impact on business districts | Short term (≤ 2 years) |
| Same-day island-wide fulfillment race | +1.4% | National, with priority coverage in Central region | Medium term (2-4 years) |
| AI-powered live-stream commerce boom | +1.2% | National, with higher engagement in younger demographics | Long term (≥ 4 years) |
| Government carbon-neutral logistics grants | +0.8% | National, with focus on industrial zones | Long term (≥ 4 years) |
| Cross-border China-Singapore free-trade corridors | +1.5% | National, with emphasis on trade hubs | Medium term (2-4 years) |
| Source: Mordor Intelligence | |||
Rising Digital-Wallet Penetration
Mobile wallets overtook credit cards in 2024, capturing 45% of transactions as the unified payments entity folded FAST, PayNow, and SGQR into a single governance layer. Gen Z shoppers adopted PayNow at a 68% preference rate once interoperability friction faded, and nearly the entire population is expected to use mobile wallets by end-2025. The SPaN initiative removed technical silos across wallet brands, while Alipay+ integration of six foreign e-wallets deepened inbound tourist spending capabilities. Continuous security upgrades such as DBS Bank’s biometric and phishing safeguards sustained user confidence. Together these developments boost shopper frequency, elevate average order values, and sharpen the competitive edge of wallet-first platforms in the Singapore e-commerce market.
Mandatory Nationwide E-Invoice Adoption for B2B (2025)
The Inland Revenue Authority mandated Peppol-based InvoiceNow submissions for GST-registered firms beginning November 2025, shrinking payment cycles from days to hours.[1]Monetary Authority of Singapore, “MAS and ABS to Establish New Payments Entity,” mas.gov.sg Over 28,600 merchants were already connected by 2024 through IMDA’s network, and the InvoiceNow Accelerate program waived fees for recently incorporated SMEs. Automating invoice exchange lowers back-office costs and unlocks data visibility that fuels dynamic pricing on B2B marketplaces. The rule also standardizes cross-border transactions, aligning with the Peppol International Invoice to streamline paperwork for China-bound exports now enjoying 94.6% tariff elimination under the upgraded CSFTA. These efficiencies underpin the 12.67% CAGR outlook for B2B trade on the Singapore e-commerce market.
Same-Day Island-Wide Fulfillment Race
SingPost injected USD 22 million to quadruple parcel throughput to 400,000 daily units, augmenting the Federated Locker network’s 1,000 sites and cementing ultrafast delivery as baseline consumer expectation.[2]Infocomm Media Development Authority, “InvoiceNow,” imda.gov.sg Source: Singapore Post Limited, “SingPost Invests SGD 30 million to Boost Processing Capacity,” singpost.com Changi Airport’s forthcoming logistics park will lift air-cargo capacity to 5.4 million tonnes, while the fully automated Tuas Port scales maritime volumes, reinforcing Singapore’s role as a regional consolidation node. Academic simulation showed crowdshipping via public transit could trim delivery-vehicle mileage by 20%, hinting at sustainability upside. Operators capable of consistent same-day drop-offs record superior retention and conversion rates, translating infrastructure investments directly into top-line growth within the Singapore e-commerce market.
AI-Powered Live-Stream Commerce Boom
Sea Limited and OpenAI piloted generative-AI shopping assistants, and Shopee released auto-written listings plus real-time chat answers in May 2025. Government grants worth USD 5.5 million and AWS’s USD 6.6 billion cloud build-out ensured computational readiness for start-ups scaling video commerce. FairPrice Group’s Store of Tomorrow embedded AI vision systems to merge offline behavior with online recommendations. Shopee commanded 74% of regional live-shopping GMV as 44% of consumers interacted with shoppable videos. AI-infused content therefore lengthens engagement sessions, lifts conversion ratios, and intensifies competition across the Singapore e-commerce market.
Restraints Impact Analysis
| Restraint | (~) % Impact on CAGR Forecast | Geographic Relevance | Impact Timeline |
|---|---|---|---|
| Escalating parcel-locker congestion | -1.3% | National, with acute impact in high-density residential areas | Short term (≤ 2 years) |
| Surge in e-commerce scams and compliance costs | -2.1% | National, with higher incident rates in cross-border transactions | Medium term (2-4 years) |
| Manpower shortages in last-mile delivery | -1.6% | National, with concentration in logistics hubs | Medium term (2-4 years) |
| Data-sovereignty rules limiting cloud scaling | -0.9% | National, affecting multinational platforms | Long term (≥ 4 years) |
| Source: Mordor Intelligence | |||
Surge in E-Commerce Scams and Compliance Costs
Police logged 50,376 cyber-fraud cases in 2023, up 49.6% from the prior year, with e-commerce scams among the top five categories.[3]Singapore Police Force, “Three Things You Should Know About the Annual Scams and Cybercrime Brief 2023,” police.gov.sgThe Shared Responsibility Framework effective December 2024 enforces 12-hour cooling-off windows and real-time surveillance, shifting liability onto platforms and financial institutions. Pokémon card frauds alone cost buyers USD 121,000 since January 2025. Blocking suspect listings, executing AI content scans, and financing refund pools inflate operating expenses. Penalties of up to USD 550,000 or 10% of turnover under the Personal Data Protection Act further weigh on profitability, shaving 2.1 percentage points off forecast CAGR for the Singapore e-commerce market.
Manpower Shortages in Last-Mile Delivery
Logistics contributed 1.4% to GDP but employed just 2.3% of the labor pool in 2024, revealing capacity tightness that automation cannot fully absorb. Unemployment rates below 3% pushed wages upward, straining courier cost structures. UPS explored humanoid robots from Figure AI, and Nippon Express funded dynamic-routing start-up SWAT Mobility to squeeze more mileage out of existing drivers. Yet final-mile activities remain heavily human-dependent, particularly for high-rise deliveries requiring building access. Persistent labor gaps risk delivery delays, customer churn, and compressed margins, reducing overall momentum in the Singapore e-commerce market.
Segment Analysis
By Business Model: B2B Platforms Scale on Regulatory Tailwinds
B2C channels controlled 88.12% of revenue in 2024, underscoring deep consumer digital maturity across the Singapore e-commerce market share. Mandatory Peppol invoicing pivots SMEs toward online procurement, catalyzing a 12.67% CAGR for B2B commerce and positioning the B2B slice of the Singapore e-commerce market size for steady expansion through 2030. SMEs, which form 99% of enterprises and employ 70% of the workforce, transitioned to e-procurement once fees were waived under InvoiceNow Accelerate. Cross-border tools such as DBS SecureFX permitted hedged FX exposure up to USD 1 million, while Business sans Borders matched local vendors with overseas buyers, amplifying reach.
Network effects deepen as every new invoice-enabled firm simplifies counterpart onboarding, generating a flywheel that moderates customer acquisition costs for B2B platforms within the Singapore e-commerce market. Tariff-free corridors with China heighten export order flows, further validating the digital shift. Meanwhile, B2C incumbents cross-pollinate retail shopper data to upsell supply-chain solutions, blurring channel boundaries and intensifying competition for merchant attention.
Get Detailed Market Forecasts at the Most Granular Levels
Download PDF
By Product Category for B2C E-commerce: Consumer Electronics is Prominent
Consumer Electronics accounted for 47.41% of 2024 sales, reflecting premium device demand and high discretionary income among Singaporeans. However, food and beverages captured pandemic-induced behavior change and logistics upgrades to post a 12.45% CAGR, the fastest among all categories. Parcel-locker densification and refrigerated last-mile fleets now support fresh-food deliveries inside two-hour windows across the Singapore e-commerce market.
Health-centric lifestyles lifted demand for vitamin supplements and protein-rich ready-to-eat meals, showcased by Betagro’s 5 million-pack chicken-breast milestone. Sustainability mandates such as packaging reporting nudged brands toward eco-friendly SKUs that appeal to conscious consumers. Fashion labels Love, Bonito and Charles and Keith innovated with virtual try-ons to deepen shopper engagement, while furniture vendors exploited AR visualization to reduce return rates. Collectively these trends diversify revenue sources and temper reliance on electronics within the Singapore e-commerce industry.
By Payment Mode for B2C E-commerce: Mobile Wallets Rule
Mobile wallets held a 45.56% slice of transactions in 2024, cementing their dominance in the Singapore e-commerce market. The unified payments entity ensured frictionless routing across FAST, PayNow, and SGQR, accelerating checkout speeds and boosting conversion. Other Payment Modes climbed at a 12.45% CAGR as Atome logged 40% GMV growth and doubled operating income to USD 170 million in FY2023.
Credit and debit cards remained indispensable for high-ticket purchases, while PayNow transfers gained popularity among Gen Z buyers who valued instant settlement. StraitsX’s stablecoin rails onboarded tourist spending at GrabPay merchants, hinting at crypto-native payment experimentation. Electronic Deferred Payment instruments slated for mid-2025 will phase out corporate cheques, nudging B2B invoices toward instant-settlement rails and reinforcing the cashless trajectory across the Singapore e-commerce market.
Note: Segment shares of all individual segments available upon report purchase
Get Detailed Market Forecasts at the Most Granular Levels
Download PDF
By Device Type for B2C E-commerce: Smartphone Consolidate User Time
Smartphone contributed 78.13% of B2C checkouts in 2024 and will rise at a 12.12% CAGR to 2030 as richer media, biometric logins, and AI recommendations heighten stickiness. Comprehensive 5G coverage and subsidized handset programs encourage ever-longer session times within app ecosystems powering the Singapore e-commerce market size. Desktop traffic persists for enterprise orders and high-consideration items, whereas tablet use narrows to entertainment-driven browsing.
Live-stream modules, vertical video formats, and swipeable card layouts optimized for one-hand navigation dominate UI refreshes. Government digital-skills courses further embed mobile commerce capabilities in the workforce, enabling merchants to manage storefronts directly from handsets. Network effects around social-commerce features fortify app primacy, tilting traffic acquisition budgets decisively toward mobile engagement channels on the Singapore e-commerce market.
Geography Analysis
The Central Region generated the lion’s share of GMV in 2024 thanks to dense commercial activity, luxury malls, and affluent households that collectively drive the highest per-capita online spend on the Singapore e-commerce market. Same-day couriers prioritize this zone, leveraging clustered parcel lockers and short urban routes to meet tight delivery promises. Regulatory bodies and fintech headquarters located downtown further propel wallet penetration rates and corporate e-payment adoption.
The West Region is emerging as a logistics powerhouse as Tuas Port ramps automation and container capacity, funneling cross-border orders into domestic distribution nodes. Industrial estates here house B2B marketplaces’ fulfillment centers, shortening lead times for SME buyers. Population growth in Jurong and Clementi underpins incremental demand for grocery and FMCG categories on the Singapore e-commerce market.
Eastern precincts benefit from Changi Airport’s second logistics park, which lifts air-freight throughput by 80% and feeds express-delivery networks. North and North-East districts, anchored by Punggol, see rising order volumes as younger families settle into new estates and tap Launch resource centers for entrepreneurship mentoring. Digital vouchers under the RedeemSG scheme spread e-payments to local merchants island-wide, homogenizing shopper access to the Singapore e-commerce market regardless of residential postcode.
Competitive Landscape
Competition intensified in 2024-2025 as social-commerce entrants encroached on incumbents. Shopee retained regional leadership with a 48% share yet faced TikTok Shop’s leap to USD 16.3 billion GMV in 2023. Lazada achieved its first monthly profit by July 2024 after integrating AI into user-incentive algorithms. Platforms now race to blend content and commerce, funding creator tools and revenue-sharing models that deepen user time-on-site within the Singapore e-commerce market.
Technology spending is the decisive edge. AWS’s USD 6.6 billion cloud expansion underwrites scalable microservices for retailers, while Sea-OpenAI pilots unleash personalised prompts that cut seller response times, lifting conversion. Carousell moved upmarket via LuxLexicon, chasing the USD 7.5 billion luxury-resale opportunity and diversifying revenue streams. White-space persists in B2B verticals and regulated niches such as tokenized financial instruments evidenced by OCBC’s retail-sized bonds.
Regulatory compliance now doubles as a moat. Operators with fraud-analytics depth and capital to absorb Shared Responsibility Framework liabilities win consumer trust faster, nudging smaller rivals toward consolidation. Qoo10’s insolvency in December 2024 illustrated margin fragility under growing escrow and refund obligations. Overall, market leaders deploy AI, logistics scale, and compliance readiness to defend share across the Singapore e-commerce market.
Singapore E-Commerce Industry Leaders
-
Sea Ltd
-
Lazada Group SA
-
Amazon.com, Inc.
-
Qoo10 Pte Ltd
-
ByteDance Ltd
- *Disclaimer: Major Players sorted in no particular order
Need More Details on Market Players and Competitors?
Download PDF
Recent Industry Developments
- August 2025: Shopee introduced AI-powered Chat Assistant and auto-generated product content, plus richer affiliate-video missions to heighten seller visibility.
- June 2025: Amazon Web Services opened its first Asia-Pacific Innovation Hub in Singapore, reinforcing its USD 6.6 billion cloud-infrastructure pledge through 2028.
- June 2025: FairPrice Group rolled out Store of Tomorrow with Google Cloud, embedding AI carts and video analytics in flagship supermarkets.
- May 2025: MAS and ABS confirmed Electronic Deferred Payment launch by mid-2025 to retire corporate cheques by December 2026.
Singapore E-Commerce Market Report Scope
Electronic commerce (e-commerce) is a business model that allows consumers and businesses to buy and sell goods and services over the internet.
The Singaporean e-commerce market is segmented by B2C e-commerce and B2B e-commerce. By B2C e-commerce, the market is segmented into beauty and personal care, consumer electronics, fashion and apparel, food and beverage, furniture and home. For each segment, the market sizes and forecasts are provided in terms of value (USD).
By Business Model
| B2B |
| B2C |
By Product Category for B2C E-commerce
| Beauty and Personal Care |
| Consumer Electronics |
| Fashion and Apparel |
| Food and Beverages |
| Furniture and Home |
| Toys, DIY and Media |
| Other Product Categories for B2C E-commerce |
By Payment Mode for B2C E-commerce
| Credit/ Debit Cards |
| Mobile Wallets |
| Other Payment Modes for B2C E-commerce |
By Device
| Smartphone |
| Desktop / Laptop |
| Other Device Types for B2C E-commerce |
| By Business Model | B2B |
| B2C | |
| By Product Category for B2C E-commerce | Beauty and Personal Care |
| Consumer Electronics | |
| Fashion and Apparel | |
| Food and Beverages | |
| Furniture and Home | |
| Toys, DIY and Media | |
| Other Product Categories for B2C E-commerce | |
| By Payment Mode for B2C E-commerce | Credit/ Debit Cards |
| Mobile Wallets | |
| Other Payment Modes for B2C E-commerce | |
| By Device | Smartphone |
| Desktop / Laptop | |
| Other Device Types for B2C E-commerce |
Need A Different Region or Segment?
Customize Now
Key Questions Answered in the Report
How large is the Singapore e-commerce market in 2025?
The Singapore e-commerce market size reached USD 5.57 billion in 2025.
What CAGR is forecast for the sector through 2030?
Market value is projected to rise at an 11% CAGR, hitting USD 9.39 billion by 2030.
Which payment method dominates online checkouts?
Mobile wallets led with 45.56% share of transactions in 2024.
Which product category is growing fastest online?
Food and Beverages is expanding at a 12.45% CAGR through 2030.
Why is B2B e-commerce gaining traction?
Mandatory Peppol e-invoicing from November 2025 reduces processing times and drives SME adoption.
Page last updated on:


