Singapore Data Center Market Size and Share
Market Overview
| Study Period | 2020 - 2031 |
|---|---|
| Forecast Data Period | 2026 - 2031 |
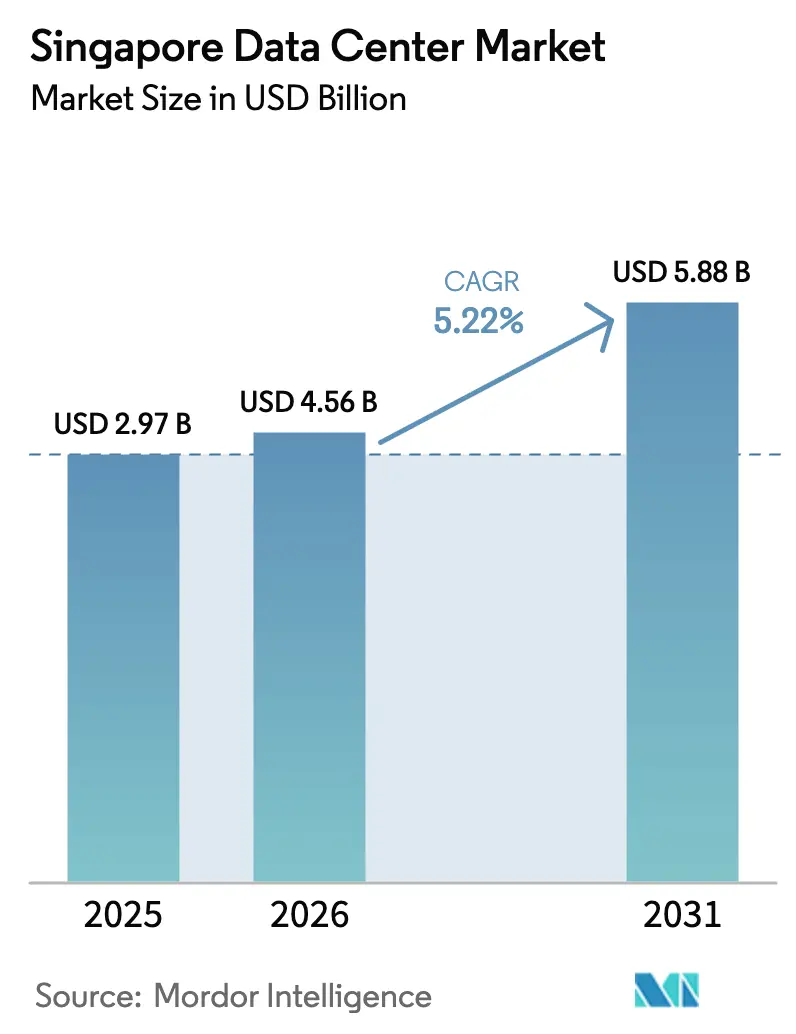
| Base Year Market Size (2025) | USD 2.97 Billion |
| Market Size (2026) | USD 4.56 Billion |
| Market Size (2031) | USD 5.88 Billion |
| Growth Rate (2026 - 2031) | 5.22% CAGR |
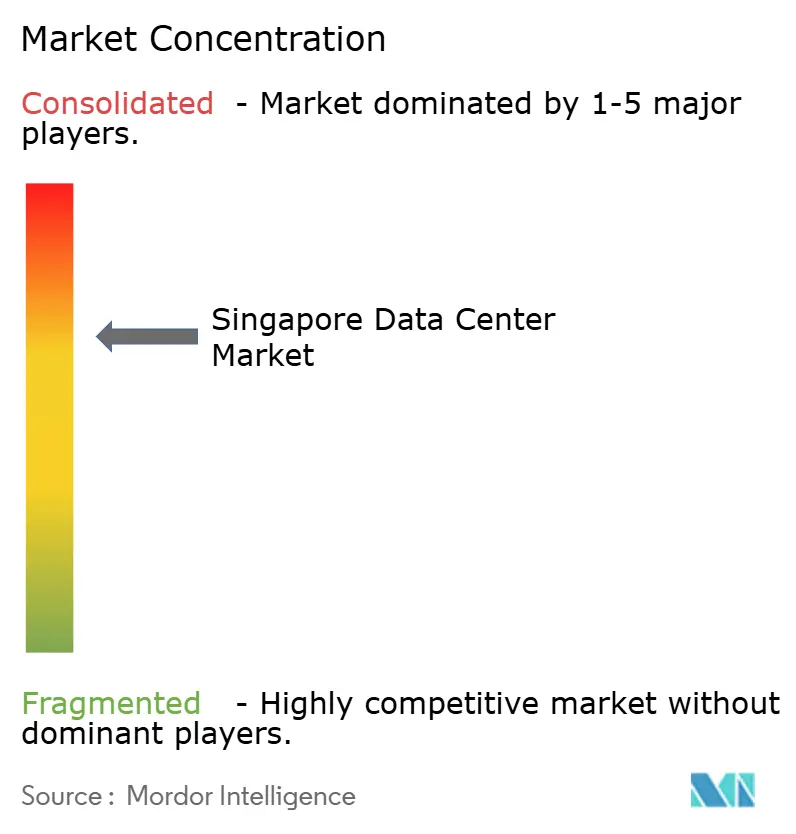
| Market Concentration | Medium |
Major Players *Disclaimer: Major Players sorted in no particular order Image © Mordor Intelligence. Reuse requires attribution under CC BY 4.0. | |
Singapore Data Center Market Analysis by Mordor Intelligence
The Singapore Data Center Market size was valued at USD 4.33 billion in 2025 and estimated to grow from USD 4.56 billion in 2026 to reach USD 5.88 billion by 2031, at a CAGR of 5.22% during the forecast period (2026-2031). In terms of the IT load capacity, the market is expected to grow from 2.97 thousand megawatts in 2025 to 3.01 thousand megawatts by 2030, at a CAGR of 0.28% during the forecast period (2025-2030). The market segment shares and estimates are calculated and reported in terms of MW. Artificial-intelligence–optimized infrastructure, sustained hyperscaler capital expenditure, and Singapore’s role as Southeast Asia’s connectivity hub anchor demand even as land and power constraints tighten supply. Momentum is reinforced by Amazon Web Services’ SGD 12 billion expansion pledge and Google’s cumulative USD 5 billion commitment, both of which underline the city-state’s primacy for regional cloud deployments.[1]Amazon Web Services, “AWS to Invest SGD 12 Billion in Singapore,” aboutamazon.com Subsea cable build-outs, a dense carrier-neutral ecosystem, and expedited permitting for “green” designs continue to attract new workloads, while the Green Data Centre Roadmap keeps operators focused on power-usage effectiveness targets of less than 1.3. GPU-rich racks now draw 40–60 kW, prompting immersion and liquid cooling retrofits that differentiate facilities on operating efficiency and sustainability credentials. Against this backdrop, operators pursue cross-border strategies in Johor and Batam to mitigate local capacity caps yet still price Singapore racks at a premium due to unparalleled network density and regulatory stability.
Key Report Takeaways
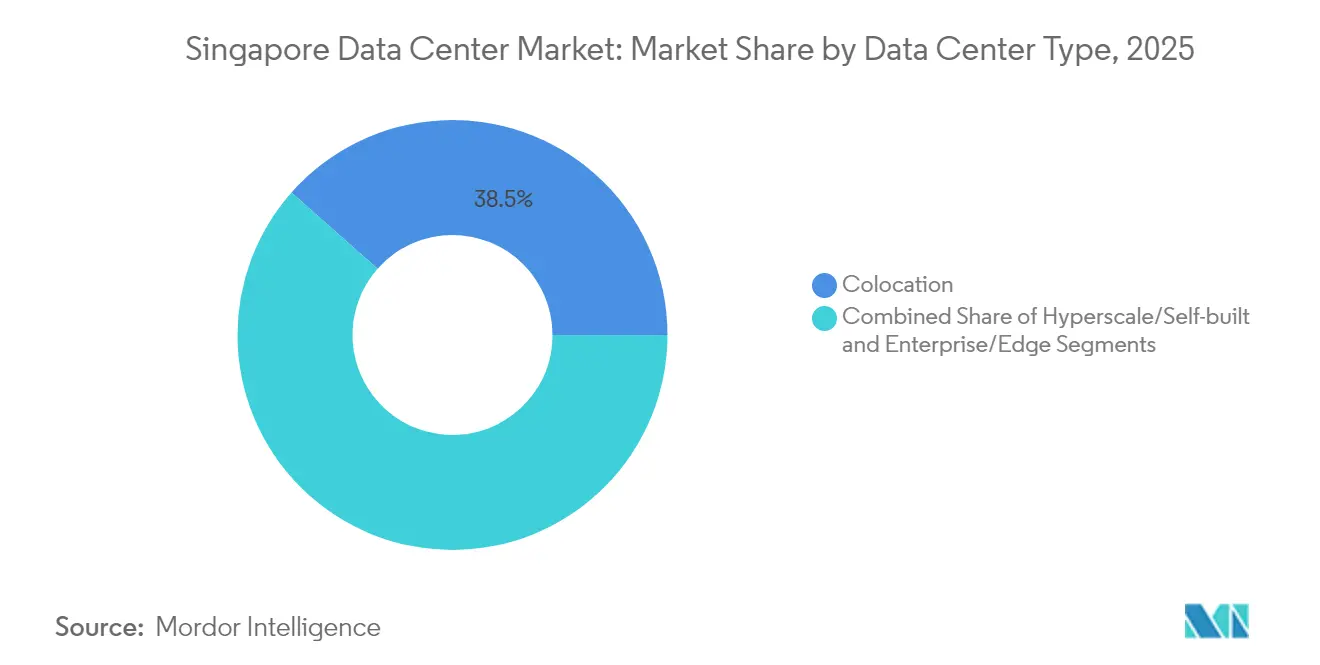
- By data center type, colocation services led with 38.47% revenue share of the Singapore data center market in 2025; hyperscale and self-built facilities are forecast to expand at a 3.14% CAGR to 2031, underscoring dedicated AI infrastructure momentum.
- By end user, IT and telecom held 47.10% of the Singapore data center market share in 2025, while banking, financial services, and insurance are expected to advance at a 2.45% CAGR through 2031, driven by sovereign-compute and fintech-regulation tailwinds.
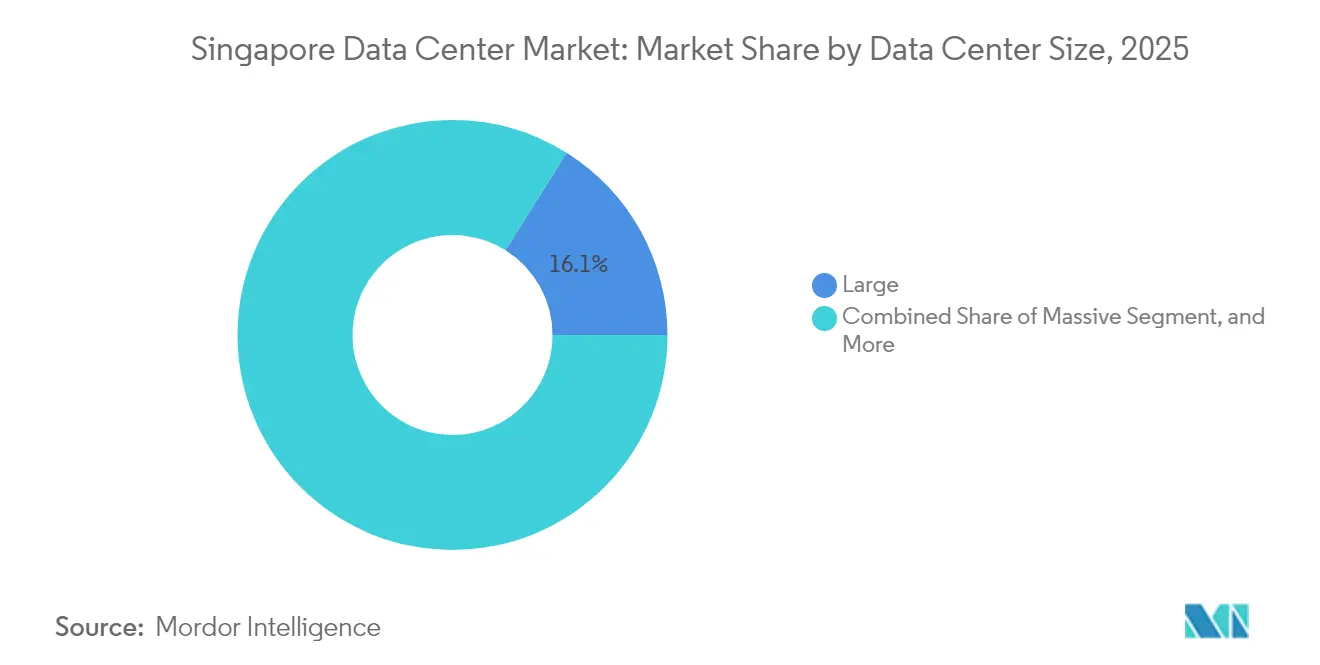
- By size, large facilities accounted for 16.10% of the Singapore data center market size in 2025; medium facilities are projected to grow at the fastest rate, with a 1.17% CAGR, reflecting edge-to-core workload migration.
- By tier, Tier 3 dominated the Singapore data center market with an 82.55% share of the Singapore data center market in 2025; however, Tier 4 is expected to post the highest CAGR of 2.48% through 2031, driven by the demand for fault-tolerant power paths in GPU clusters.
- By hotspot, Jurong led with 11.25% share of the Singapore data center market in 2025, whereas Tai Seng is on track for a 1.64% CAGR, supported by central-business-district proximity and dense fiber routes.
Note: Market size and forecast figures in this report are generated using Mordor Intelligence’s proprietary estimation framework, updated with the latest available data and insights as of 2026.
Singapore Data Center Market Trends and Insights
Drivers Impact Analysis*
| Driver | (~) % Impact on CAGR Forecast | Geographic Relevance | Impact Timeline |
|---|---|---|---|
| Heightened hyperscaler cloud CapEx surge | +1.8% | Global focus, Singapore core | Medium term (2-4 years) |
| AI-ready high-density rack demand | +1.5% | Singapore and regional spillover | Short term (≤ 2 years) |
| Subsea-cable landing expansion boosting interconnection | +0.9% | Singapore core, Asia-Pacific connectivity | Long term (≥ 4 years) |
| Green Data Centre Roadmap power-allocation incentives | +0.7% | Singapore national | Medium term (2-4 years) |
| Edge- and 5G-led enterprise workload localization | +0.6% | Singapore and region | Short term (≤ 2 years) |
| Sovereign compute and fintech regulations driving on-island hosting | +0.4% | Singapore national, BFSI focus | Long term (≥ 4 years) |
| Source: Mordor Intelligence | |||


Heightened Hyperscaler Cloud CapEx Surge
Amazon’s record SGD 12 billion program, earmarked through 2030, extends its 15-year presence and scales GPU clusters, storage, and low-latency edge nodes across multiple availability zones. Microsoft’s March 2025 expansion of the AI Pinnacle initiative aligns with this trajectory by pairing infrastructure additions with workforce upskilling commitments. Such multi-billion-dollar commitments crowd-in suppliers of switching fabric, battery-energy storage, and advanced cooling, creating a capex multiplier across the Singapore data center market. The scale of spend suggests that hyperscalers view Singapore as an irreplaceable Southeast Asian control plane, even as they activate satellite regions in Thailand and Malaysia. Consequently, wholesale-colocation pipelines are booked out through 2027, pushing pre-lease rates to multi-year highs and consolidating bargaining power among established landlords. Operators that already hold power allocations and land parcels monetize scarce capacity at premium yields, reinforcing barriers to entry for latecomers.
AI-Ready High-Density Rack Demand
NVIDIA DGX H100 chassis consumes up to 10.2 kW in 8U, and Blackwell B200 cards exceed 1,000 watts each, escalating rack densities to 40–60 kW and challenging legacy chilled-water systems. Singtel, through partnerships with Nscale and Bridge Alliance, is offering GPU-as-a-Service bundles that utilize direct-to-chip liquid cooling and immersion pods hosted in STT Singapore 6, achieving a PUE as low as 1.03. ST Engineering’s Jalan Boon Lay build, slated for 2027 delivery, bakes in manifold cooling options to accommodate heterogeneous accelerator roadmaps. Demand for turnkey AI cages has enabled operators to capture a 10-15% pricing premium versus standard colocation footprints, boosting revenue per kW even as available megawatts remain capped. Financial services and advanced manufacturing tenants increasingly specify liquid-ready whitespace, prompting retrofit cycles in facilities commissioned before 2020.
Subsea Cable Landing Expansion Boosting Interconnection
Singapore aims to double the number of subsea cable landings by 2030, as outlined in the IMDA digital connectivity blueprint, with the addition of INSICA and Echo routes providing diverse paths to Indonesia, the United States, and Australia.[2]Infocomm Media Development Authority, “Digital Connectivity Blueprint,” imda.gov.sg Meta and Google are co-funding new trans-Pacific systems that terminate in Tuas, thereby lowering latency for multi-cloud failover and disaster recovery applications. Each landing spurs incremental meet-me-room demand, lifting cross-connect revenue and reinforcing Singapore’s hub-and-spoke advantage over regional alternatives. Capital-markets firms value the deterministic latency improvements for trade execution and regulatory reporting, while over-the-top video providers mitigate the risks associated with peering outages. The virtuous cycle pulls incremental exchange points and content-delivery nodes into the Singapore data center market, supporting sustained cabinet absorption despite local capacity moratoriums. Long-haul diversity also enhances cyber-resilience credentials that regulators scrutinize when approving critical-infrastructure deployments.
Green Data Centre Roadmap Power Allocation Incentives
The Green Data Centre Roadmap stipulates sub-1.3 PUE designs as a prerequisite for new grid allocations, rewarding compliant projects with faster approvals and earmarked electricity blocks. Equinix responded with an 18-year, 75 MW solar power-purchase agreement that secures predictable operating costs while advancing its scope 2 decarbonization targets. Operators experimenting with waste-heat recovery and district-cooling linkages can earn bonus capacity, a decisive edge in a jurisdiction where load growth is rationed. Renewable-diesel gensets and fuel-cell trials further diversify backup strategies, enhancing ESG scores that institutional investors increasingly bake into cap-rate underwriting. Collectively, policy carrots and sticks shift the competitive axis from megawatt scale alone to megawatt-efficiency leadership. Early adopters secure differentiated brand equity by aligning with hyperscaler procurement teams that tie rack award decisions to carbon-intensity metrics.
Restraints Impact Analysis*
| Restraint | (~) % Impact on CAGR Forecast | Geographic Relevance | Impact Timeline |
|---|---|---|---|
| Limited land and power-supply constraints | -1.2% | Singapore core, spillover driver | Short term (≤ 2 years) |
| High electricity tariffs impacting OPEX | -0.8% | Singapore national | Medium term (2-4 years) |
| Strict PUE and sustainability mandates raising CAPEX | -0.6% | Singapore national | Long term (≥ 4 years) |
| Talent shortage for AI/HPC operations | -0.4% | Singapore and regional | Medium term (2-4 years) |
| Source: Mordor Intelligence | |||
Limited Land and Power Supply Constraints
Industrial-zoned plots in mature hubs, such as Tai Seng, now exceed SGD 200 per square foot annually, compelling vertical stack designs that push the floor loading and elevator capacity engineering envelopes.[3]JLL, “Singapore Data Centre Land-Price Monitor,” jll.com The Energy Market Authority restricts new-build allocations to roughly 200 MW per year, a cap already pre-committed by projects in early-stage permitting, thus stalling greenfield entrants. Johor, located 20 kilometers north, capitalizes on overflow by approving 42 projects in Q2 2025 and offering tariff relief via renewable-energy quotas. Singapore incumbents secure optionality through cross-border campuses while preserving premium price points for latency-sensitive racks that must reside within city limits. However, the land-and-power squeeze elongates delivery lead times, inflates contingency budgets, and amplifies tenant churn risk if alternative capacity opens sooner in neighboring markets.
High Electricity Tariffs Impacting OPEX
Singapore’s industrial tariff band averaged SGD 0.20-0.25 per kWh in 2025, well above Johor’s SGD 0.10 midpoint, eroding total-cost-of-ownership advantages for power-hungry AI farms. Time-of-use differentials remain narrow, limiting arbitrage strategies that North American data centers employ to shave peak costs. Operators respond with heat-reuse schemes and battery-energy storage arbitrage, yet savings seldom exceed 8-10% of utility bills, leaving rack rates structurally higher than those of regional peers. Hyperscalers absorb premiums for workloads that require Singapore’s governance assurances, but price-sensitive batch processing may migrate offshore. A rising share of renewable power-purchase agreements mitigates volatility but is constrained by limited domestic solar and import-cap trade-offs. The net effect trims EBITDA margins for operators that lag on efficiency retrofits, pressuring dividend coverage ratios for yield-oriented investors.
*Our forecasts treat driver/restraint impacts as directional, not additive. The impact forecasts reflect baseline growth, mix effects, and variable interactions.
Segment Analysis
By Data Center Size: Large Facilities Drive Market Maturity
Large facilities captured 16.10% of the Singapore data center market share in 2025, reflecting the prevalence of institutional-grade campuses designed for hyperscaler pods and sovereign compute enclosures. Their multidimensional redundancy, on-site utilities, and carrier-hotel-adjacent footprints sustain premium lease rates despite slower headline growth. Medium-sized sites, however, are forecast to expand at a 1.17% CAGR as enterprises regionalize edge analytics while retaining governance control. Vertical designs with an average density of 10-15 kW optimize scarce land and leverage high-rise mechanical, electrical, and plumbing stacks, an approach already piloted in Tai Seng. Massive and mega-scale categories, despite occupying only 25% of the capacity, influence design norms by mandating 48-hour energy-storage buffers and campus-scale heat-recovery loops.
Smaller footprints are increasingly specializing in high-security, air-gapped deployments for government agencies and algorithmic trading firms. Regulatory hurdles, including Green Mark Platinum for new build permits, raise unit CAPEX for sub-5 MW sites, nudging owners to partner with REITs for financing. Between 2025 and 2030, supply additions focus on mezzanine expansions and white-space retrofits rather than greenfield acreage. Consequently, the Singapore data center market maintains a barbell structure: sprawling hyperscale blocks at one end and compact, compliance-driven nodes at the other, each supported by a thriving secondary services ecosystem.


By Tier Type: Tier 3 Dominance Reflects Enterprise Requirements
Tier 3 installations comprised 82.55% of total capacity and underpin the Singapore data center market share leadership due to their sweet-spot balance between cost and concurrently maintainable operations. Financial institutions and software-as-a-service vendors view Tier 3 as sufficient when paired with dual-region failover. Nevertheless, Tier 4 is expected to record a 2.48% CAGR, as AI training outages can derail multi-week model development cycles and incur heavy opportunity costs. Uptime-Institute-verified Tier 4 halls command 15-20% rental premiums yet enjoy sub-2% vacancy in Singapore.
Tier 1 and Tier 2 footprints now primarily cater to staging, development-test, and non-critical workloads, but even these sites are gradually being retrofitted with higher redundancy as clients standardize their service-level agreements. GPU clusters magnify the repercussions of single-point-of-failure, pressuring operators to deploy independent electrical paths and twin cooling loops characteristic of Tier 4. Over the long term, a measured migration toward Tier 4 is likely, but cost-sensitive segments will preserve the bulk of Tier 3 dominance, which keeps the Singapore data center market resilient against offshore competition.
By Data Center Type: Colocation Leadership Faces Hyperscale Challenge
Colocation retained 38.47% market leadership in 2025, cementing its role as the ecosystem backbone for multi-tenant connectivity exchanges, distributed denial-of-service mitigation, scrubbing, and hybrid-cloud gateways. Wholesale blocks of over 5 MW for single-tenant hyperscalers represent 60% of colocation sales, indicating blurred lines between traditional colocation and build-to-suit. Conversely, hyperscale/self-built facilities are projected to grow at 3.14% CAGR as cloud giants internalize critical-path infrastructure for AI onboarding pipelines and batch inference.
Enterprise/edge data centers, representing 35% of installed megawatts, leverage geographically diverse micro-nodes to achieve latency benchmarks under 10 milliseconds for 5G usage scenarios. Retail colocation margins compress under scale competition, but operators offset by layering managed AI-inference platforms and inter-cloud routing fabrics. As sustainability credentials progress, service value migrates from square-foot price to carbon-adjusted kilowatt metrics, gradually redefining competitive positioning across data center types within the Singapore data center market.
By End User: IT and Telecom Dominance Challenged by BFSI Growth
IT and telecom clients consumed 47.10% of racks in 2025, mirroring Singapore’s headquarters function for global digital-service providers and regional carrier exchanges. 5G backhaul, content-delivery nodes, and SaaS region roll-outs keep this segment at the center of capacity-planning discussions. However, banking, financial services, and insurance are slated to outpace their peers at a 2.45% CAGR, propelled by algorithmic trading, real-time payments, and regulatory localization demands that require data to be locked onshore.
E-commerce, which accounts for around 15% of uptake, utilizes edge caching and fraud-detection engines. Government demand accelerates through Smart Nation deployments, while Industry 4.0 pilots in manufacturing drive micro-data hall growth. Media and entertainment workloads join the surge in AI demand as video transcoding shifts to GPU clusters. Together, these shifts diversify tenant mix and buffer the Singapore data center market against cyclical demand shocks in any single vertical.
Geography Analysis
Singapore’s data-center geography forms a tri-polar axis anchored by Jurong in the west, Tai Seng in the center, and Changi-Tuas in the east, together representing the bulk of installed megawatts. Jurong’s first-mover network effects and industrial power grid nodes underpin its 11.25% leadership, yet expansion opportunities hinge on vertical stacking due to plot scarcity. Operators recycle brownfield warehouses into eight-story data blocks, mitigating land pressure without leaving the power footprint that distinguishes the Singapore data center market.
Tai Seng’s value proposition rests on its 5-kilometer distance to Raffles Place and Marina Bay financial hubs, translating into sub-2-millisecond round-trip latency for high-frequency-trading algorithms. Premium land rents exceeding SGD 200 per square foot reflect this locational arbitrage, but tenants accept the surcharge given the dense fiber lattice and metro-rail accessibility. Medium-sized facilities here adopt mixed-use podium towers that offer office floors above data halls, optimizing floor-area ratios. Woodlands leverages the Causeway bridge to Johor to position itself as a northward disaster-recovery node, and its lower land valuations create flexibility for expandable campuses that can align with future renewable-import corridors from Malaysia.
The “Rest of Singapore” grouping hosts nascent clusters in Tuas, where LNG-regasification plants serve as waste heat sinks, and in Changi, where airport proximity supports airline-operational databases and edge caching for passenger applications. These greenfield allocations incorporate district cooling and seawater return options to achieve sub-1.2 PUE targets mandated under the Green Data Centre Roadmap. Over the 2025-2030 period, geographic diversification cushions capacity constraints in heritage zones and sustains a balanced growth profile for the Singapore data center market, while preserving low-latency links to core business districts and regional subsea landing stations.
Competitive Landscape
Singapore’s top five operators, Keppel DC REIT, STT GDC, Equinix, Digital Realty, and Singtel, controlled roughly 65% of the installed capacity in 2024, fostering a moderately consolidated scene that rewards scale efficiencies without stifling specialized entrants. REIT structures provide low-cost capital and tax transparency, enabling portfolio acquisitions, such as Keppel DC REIT’s proposal to integrate two hyperscale halls into its campus and unlock yield accretion. Meanwhile, privately held STT GDC advances immersion-cooling pilots that lower PUE below 1.05, strengthening its pitch to AI tenants and differentiating beyond pure megawatt scale.
New-age disruptor Sustainable Metal Cloud focuses exclusively on GPU pools served via immersion tanks, signaling that innovation niches persist despite consolidation. Operators escalate ESG positioning: Equinix’s 75 MW solar PPA secures renewable energy sourcing, and Keppel’s floating data center prototype researches seawater cooling at scale. Service-stack competition intensifies as providers overlay GPU-as-a-Service, multi-cloud interconnect fabrics, and sovereign-compute compliance audits to retain their share of the enterprise wallet.
Cross-border spillover introduces regional chess moves. Singtel partners with Malaysia’s Khazanah on Johor builds while preserving core racks in Tai Seng for latency-critical loads. Digital Realty secures land in Batam as a “swing” region, marketing it as a capacity buffer for customers constrained by Singapore power caps. Collectively, these strategies underscore a dual-hub paradigm in which Singapore remains the premium anchor within a federated Southeast Asian data center network, sustaining the high-value segment of the Singapore data center market even as commoditized workloads migrate north.
Singapore Data Center Industry Leaders
Amazon Web Services Inc.
Google LLC
Microsoft Corporation
Meta Platforms Inc.
Keppel DC REIT Management Pte Ltd.
- *Disclaimer: Major Players sorted in no particular order

Recent Industry Developments
- April 2025: AirTrunk targets USD 1.7 billion green loan for Singapore data center expansion, with Blackstone-backed financing specifically designated for sustainability-linked infrastructure development and capacity build-out across the company’s Singapore hyperscale portfolio.
- March 2025: Microsoft expands the AI Pinnacle program with public and private sector collaborations to facilitate the adoption of artificial intelligence at scale in Singapore, thereby broadening organizational support for the deployment of responsible AI and the utilization of cloud infrastructure across government and enterprise customers.
- January 2025: Amazon Web Services launches an infrastructure region in Thailand, featuring three availability zones and a USD 5 billion investment commitment, which expands Southeast Asian capacity while maintaining Singapore as the regional hub for connectivity and financial services workloads.
- December 2024: Singtel partners with GMI Cloud and Nscale to boost global GPU capacity across the United States and Asia-Pacific, integrating GPU-as-a-Service offerings with NVIDIA H100 Tensor Core GPUs through the Paragon orchestration platform for enterprise AI workloads.


Singapore Data Center Market Report Scope
East Singapore, West Singapore are covered as segments by Hotspot. Large, Massive, Medium, Mega, Small are covered as segments by Data Center Size. Tier 1 and 2, Tier 3, Tier 4 are covered as segments by Tier Type. Non-Utilized, Utilized are covered as segments by Absorption.| Large |
| Massive |
| Medium |
| Mega |
| Small |
| Tier 1 and 2 |
| Tier 3 |
| Tier 4 |
| Hyperscale/Self-built | ||
| Enterprise/Edge | ||
| Colocation | Non-Utilized | |
| Utilized | Retail Colocation | |
| Wholesale Colocation | ||
| BFSI |
| IT and ITES |
| E-Commerce |
| Government |
| Manufacturing |
| Media and Entertainment |
| Telecom |
| Other End Users |
| Jurong |
| Tai Seng |
| Woodlands |
| Rest of Singapore |
| By Data Center Size | Large | ||
| Massive | |||
| Medium | |||
| Mega | |||
| Small | |||
| By Tier Type | Tier 1 and 2 | ||
| Tier 3 | |||
| Tier 4 | |||
| By Data Center Type | Hyperscale/Self-built | ||
| Enterprise/Edge | |||
| Colocation | Non-Utilized | ||
| Utilized | Retail Colocation | ||
| Wholesale Colocation | |||
| By End User | BFSI | ||
| IT and ITES | |||
| E-Commerce | |||
| Government | |||
| Manufacturing | |||
| Media and Entertainment | |||
| Telecom | |||
| Other End Users | |||
| By Hotspot | Jurong | ||
| Tai Seng | |||
| Woodlands | |||
| Rest of Singapore | |||


Market Definition
- IT LOAD CAPACITY - The IT load capacity or installed capacity, refers to the amount of energy consumed by servers and network equipments placed in a rack installed. It is measured in megawatt (MW).
- ABSORPTION RATE - It denotes the extend to which the data center capacity has been leased out. For instance, a 100 MW DC has leased out 75 MW, then absorption rate would be 75%. It is also referred as utilization rate and leased-out capacity.
- RAISED FLOOR SPACE - It is an elevated space build over the floor. This gap between the original floor and the elevated floor is used to accommodate wiring, cooling, and other data center equipment. This arrangement assist in having proper wiring and cooling infrastructure. It is measured in square feet (ft^2).
- DATA CENTER SIZE - Data Center Size is segmented based on the raised floor space allocated to the data center facilities. Mega DC - # of Racks must be more than 9000 or RFS (raised floor space) must be more than 225001 Sq. ft; Massive DC - # of Racks must be in between 9000 and 3001 or RFS must be in between 225000 Sq. ft and 75001 Sq. ft; Large DC - # of Racks must be in between 3000 and 801 or RFS must be in between 75000 Sq. ft and 20001 Sq. ft; Medium DC # of Racks must be in between 800 and 201 or RFS must be in between 20000 Sq. ft and 5001 Sq. ft; Small DC - # of Racks must be less than 200 or RFS must be less than 5000 Sq. ft.
- TIER TYPE - According to Uptime Institute the data centers are classified into four tiers based on the proficiencies of redundant equipment of the data center infrastructure. In this segment the data center are segmented as Tier 1,Tier 2, Tier 3 and Tier 4.
- COLOCATION TYPE - The segment is segregated into 3 categories namely Retail, Wholesale and Hyperscale Colocation service. The categorization is done based on the amount of IT load leased out to potential customers. Retail colocation service has leased capacity less than 250 kW; Wholesale colocation services has leased capacity between 251 kW and 4 MW and Hyperscale colocation services has leased capacity more than 4 MW.
- END CONSUMERS - The Data Center Market operates on a B2B basis. BFSI, Government, Cloud Operators, Media and Entertainment, E-Commerce, Telecom and Manufacturing are the major end-consumers in the market studied. The scope only includes colocation service operators catering to the increasing digitalization of the end-user industries.
| Keyword | Definition |
|---|---|
| Rack Unit | Generally referred as U or RU, it is the unit of measurement for the server unit housed in the racks in the data center. 1U is equal to 1.75 inches. |
| Rack Density | It defines the amount of power consumed by the equipment and server housed in a rack. It is measured in kilowatt (kW). This factor plays a critical role in data center design and, cooling and power planning. |
| IT Load Capacity | The IT load capacity or installed capacity, refers to the amount of energy consumed by servers and network equipment placed in a rack installed. It is measured in megawatt (MW). |
| Absorption Rate | It denotes how much of the data center capacity has been leased out. For instance, if a 100 MW DC has leased out 75 MW, then the absorption rate would be 75%. It is also referred to as utilization rate and leased-out capacity. |
| Raised Floor Space | It is an elevated space built over the floor. This gap between the original floor and the elevated floor is used to accommodate wiring, cooling, and other data center equipment. This arrangement assists in having proper wiring and cooling infrastructure. It is measured in square feet/meter. |
| Computer Room Air Conditioner (CRAC) | It is a device used to monitor and maintain the temperature, air circulation, and humidity inside the server room in the data center. |
| Aisle | It is the open space between the rows of racks. This open space is critical for maintaining the optimal temperature (20-25 °C) in the server room. There are primarily two aisles inside the server room, a hot aisle and a cold aisle. |
| Cold Aisle | It is the aisle wherein the front of the rack faces the aisle. Here, chilled air is directed into the aisle so that it can enter the front of the racks and maintain the temperature. |
| Hot Aisle | It is the aisle where the back of the racks faces the aisle. Here, the heat dissipated from the equipment’s in the rack is directed to the outlet vent of the CRAC. |
| Critical Load | It includes the servers and other computer equipment whose uptime is critical for data center operation. |
| Power Usage Effectiveness (PUE) | It is a metric which defines the efficiency of a data center. It is calculated by: (𝑇𝑜𝑡𝑎𝑙 𝐷𝑎𝑡𝑎 𝐶𝑒𝑛𝑡𝑒𝑟 𝐸𝑛𝑒𝑟𝑔𝑦 𝐶𝑜𝑛𝑠𝑢𝑚𝑝𝑡𝑖𝑜𝑛)/(𝑇𝑜𝑡𝑎𝑙 𝐼𝑇 𝐸𝑞𝑢𝑖𝑝𝑚𝑒𝑛𝑡 𝐸𝑛𝑒𝑟𝑔𝑦 𝐶𝑜𝑛𝑠𝑢𝑚𝑝𝑡𝑖𝑜𝑛). Further, a data center with a PUE of 1.2-1.5 is considered highly efficient, whereas, a data center with a PUE >2 is considered highly inefficient. |
| Redundancy | It is defined as a system design wherein additional component (UPS, generators, CRAC) is added so that in case of power outage, equipment failure, the IT equipment should not be affected. |
| Uninterruptible Power Supply (UPS) | It is a device that is connected in series with the utility power supply, storing energy in batteries such that the supply from UPS is continuous to IT equipment even during utility power is snapped. The UPS primarily supports the IT equipment only. |
| Generators | Just like UPS, generators are placed in the data center to ensure an uninterrupted power supply, avoiding downtime. Data center facilities have diesel generators and commonly, 48-hour diesel is stored in the facility to prevent disruption. |
| N | It denotes the tools and equipment required for a data center to function at full load. Only "N" indicates that there is no backup to the equipment in the event of any failure. |
| N+1 | Referred to as 'Need plus one', it denotes the additional equipment setup available to avoid downtime in case of failure. A data center is considered N+1 when there is one additional unit for every 4 components. For instance, if a data center has 4 UPS systems, then for to achieve N+1, an additional UPS system would be required. |
| 2N | It refers to fully redundant design wherein two independent power distribution system is deployed. Therefore, in the event of a complete failure of one distribution system, the other system will still supply power to the data center. |
| In-Row Cooling | It is the cooling design system installed between racks in a row where it draws warm air from the hot aisle and supplies cool air to the cold aisle, thereby maintaining the temperature. |
| Tier 1 | Tier classification determines the preparedness of a data center facility to sustain data center operation. A data center is classified as Tier 1 data center when it has a non-redundant (N) power component (UPS, generators), cooling components, and power distribution system (from utility power grids). The Tier 1 data center has an uptime of 99.67% and an annual downtime of <28.8 hours. |
| Tier 2 | A data center is classified as Tier 2 data center when it has a redundant power and cooling components (N+1) and a single non-redundant distribution system. Redundant components include extra generators, UPS, chillers, heat rejection equipment, and fuel tanks. The Tier 2 data center has an uptime of 99.74% and an annual downtime of <22 hours. |
| Tier 3 | A data center having redundant power and cooling components and multiple power distribution systems is referred to as a Tier 3 data center. The facility is resistant to planned (facility maintenance) and unplanned (power outage, cooling failure) disruption. The Tier 3 data center has an uptime of 99.98% and an annual downtime of <1.6 hours. |
| Tier 4 | It is the most tolerant type of data center. A Tier 4 data center has multiple, independent redundant power and cooling components and multiple power distribution paths. All IT equipment are dual powered, making them fault tolerant in case of any disruption, thereby ensuring interrupted operation. The Tier 4 data center has an uptime of 99.74% and an annual downtime of <26.3 minutes. |
| Small Data Center | Data center that has floor space area of ≤ 5,000 Sq. ft or the number of racks that can be installed is ≤ 200 is classified as a small data center. |
| Medium Data Center | Data center which has floor space area between 5,001-20,000 Sq. ft, or the number of racks that can be installed is between 201-800, is classified as a medium data center. |
| Large Data Center | Data center which has floor space area between 20,001-75,000 Sq. ft, or the number of racks that can be installed is between 801-3,000, is classified as a large data center. |
| Massive Data Center | Data center which has floor space area between 75,001-225,000 Sq. ft, or the number of racks that can be installed is between 3001-9,000, is classified as a massive data center. |
| Mega Data Center | Data center that has a floor space area of ≥ 225,001 Sq. ft or the number of racks that can be installed is ≥ 9001 is classified as a mega data center. |
| Retail Colocation | It refers to those customers who have a capacity requirement of 250 kW or less. These services are majorly opted by small and medium enterprises (SMEs). |
| Wholesale Colocation | It refers to those customers who have a capacity requirement between 250 kW to 4 MW. These services are majorly opted by medium to large enterprises. |
| Hyperscale Colocation | It refers to those customers who have a capacity requirement greater than 4 MW. The hyperscale demand primarily originates from large-scale cloud players, IT companies, BFSI, and OTT players (like Netflix, Hulu, and HBO+). |
| Mobile Data Speed | It is the mobile internet speed a user experiences via their smartphones. This speed is primarily dependent on the carrier technology being used in the smartphone. The carrier technologies available in the market are 2G, 3G, 4G, and 5G, where 2G provides the slowest speed while 5G is the fastest. |
| Fiber Connectivity Network | It is a network of optical fiber cables deployed across the country, connecting rural and urban regions with high-speed internet connection. It is measured in kilometer (km). |
| Data Traffic per Smartphone | It is a measure of average data consumption by a smartphone user in a month. It is measured in gigabyte (GB). |
| Broadband Data Speed | It is the internet speed that is supplied over the fixed cable connection. Commonly, copper cable and optic fiber cable are used in both residential and commercial use. Here, optic cable fiber provides faster internet speed than copper cable. |
| Submarine Cable | A submarine cable is a fiber optic cable laid down at two or more landing points. Through this cable, communication and internet connectivity between countries across the globe is established. These cables can transmit 100-200 terabits per second (Tbps) from one point to another. |
| Carbon Footprint | It is the measure of carbon dioxide generated during the regular operation of a data center. Since, coal, and oil & gas are the primary source of power generation, consumption of this power contributes to carbon emissions. Data center operators are incorporating renewable energy sources to curb the carbon footprint emerging in their facilities. |


Research Methodology
Mordor Intelligence follows a four-step methodology in all our reports.
- Step-1: Identify Key Variables: In order to build a robust forecasting methodology, the variables and factors identified in Step-1 are tested against available historical market numbers. Through an iterative process, the variables required for market forecast are set and the model is built on the basis of these variables.
- Step-2: Build a Market Model: Market-size estimations for the forecast years are in nominal terms. Inflation is not a part of the pricing, and the average selling price (ASP) is kept constant throughout the forecast period for each country.
- Step-3: Validate and Finalize: In this important step, all market numbers, variables and analyst calls are validated through an extensive network of primary research experts from the market studied. The respondents are selected across levels and functions to generate a holistic picture of the market studied.
- Step-4: Research Outputs: Syndicated Reports, Custom Consulting Assignments, Databases & Subscription Platforms


