Silicone Sealants Market Size and Share
Market Overview
| Study Period | 2020 - 2031 |
|---|---|
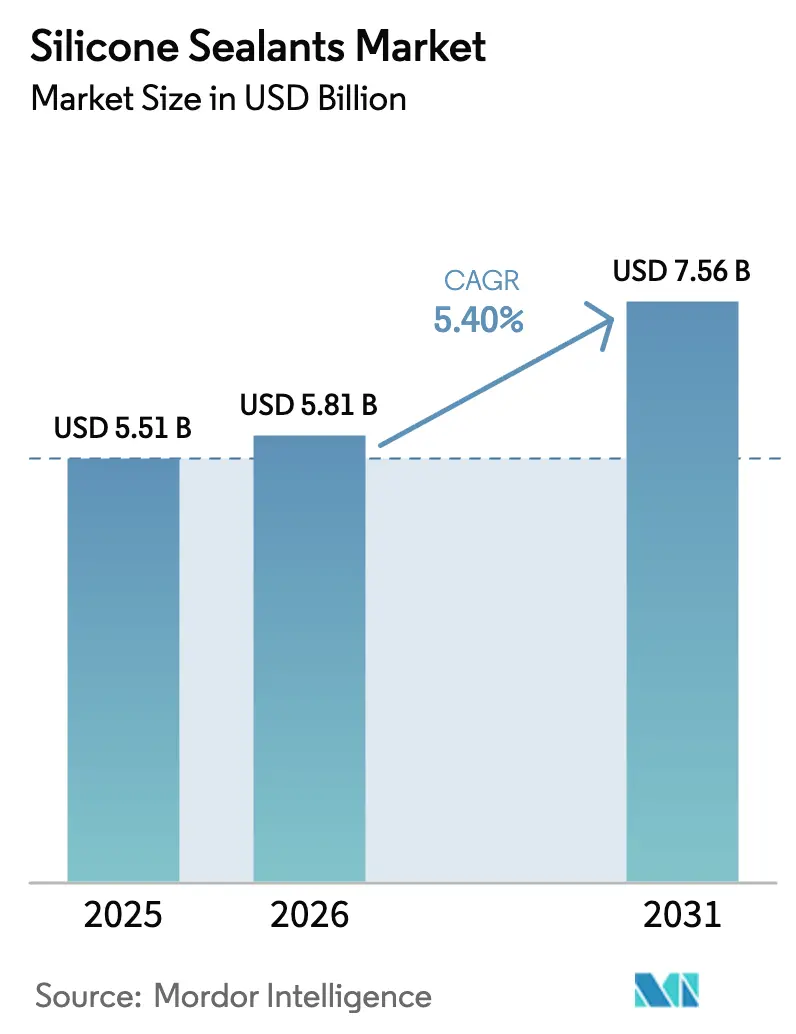
| Market Size (2026) | USD 5.81 Billion |
| Market Size (2031) | USD 7.56 Billion |
| Growth Rate (2026 - 2031) | 5.40% CAGR |
| Fastest Growing Market | Asia Pacific |
| Largest Market | Asia Pacific |
| Market Concentration | Medium |
Major Players
*Disclaimer: Major Players sorted in no particular order Image © Mordor Intelligence. Reuse requires attribution under CC BY 4.0. |
|
Silicone Sealants Market Analysis by Mordor Intelligence
The Silicone Sealants market size is expected to grow from USD 5.51 billion in 2025 to USD 5.81 billion in 2026 and is forecast to reach USD 7.56 billion by 2031 at 5.4% CAGR over 2026-2031. Strong demand from large-scale infrastructure projects, steadily rising renovation outlays in mature economies, and accelerating electric-vehicle (EV) production underpin the growth trajectory. Asia-Pacific dominates current consumption as China, India, and the Philippines fund multi-trillion-dollar public-works pipelines, while North America and Europe rely on housing upgrades and EV battery‐pack assembly for incremental volume. Advanced formulations targeting higher thermal conductivity, low-VOC compliance, and rapid heat-cure capability have expanded addressable automotive, electronics, and healthcare applications. Consolidation among vertically integrated producers, alongside strategic regional capacity additions, is building resilient supply chains that temper raw-material volatility and regulatory headwinds.
Key Report Takeaways
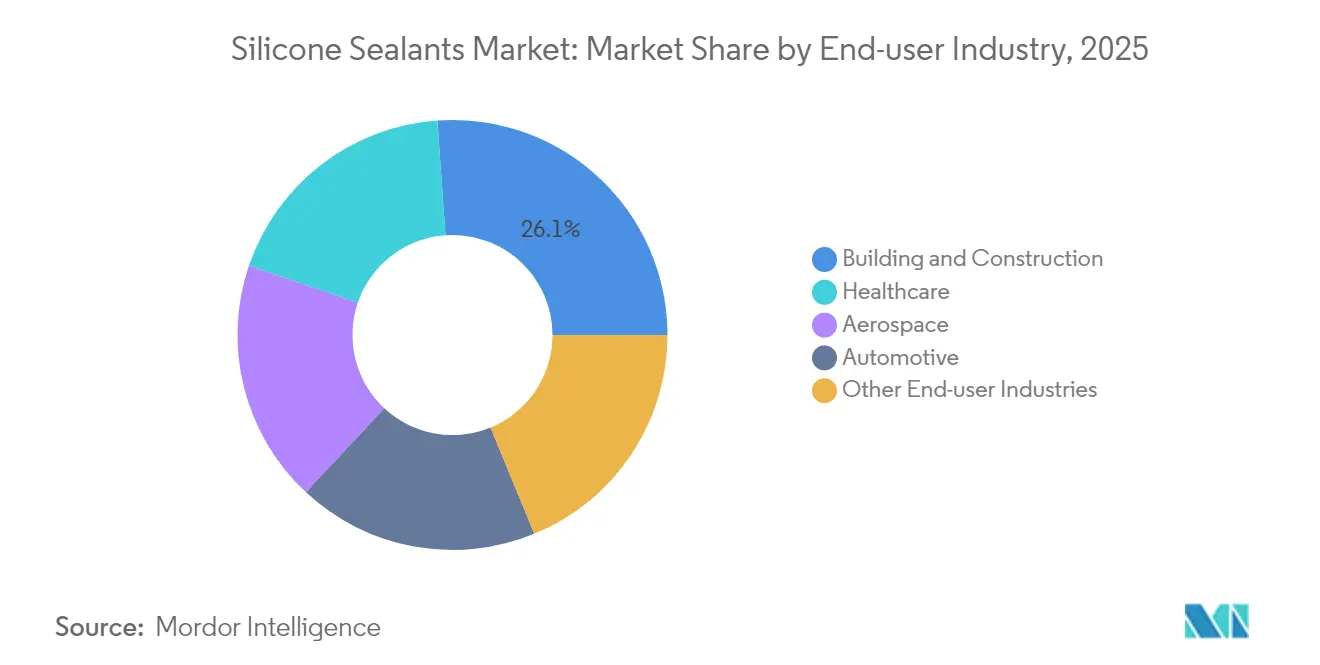
- By end-user industry, building and construction held 26.12% revenue share of the Silicone Sealants market size in 2025, while healthcare applications are advancing at a 6.12% CAGR to 2031.
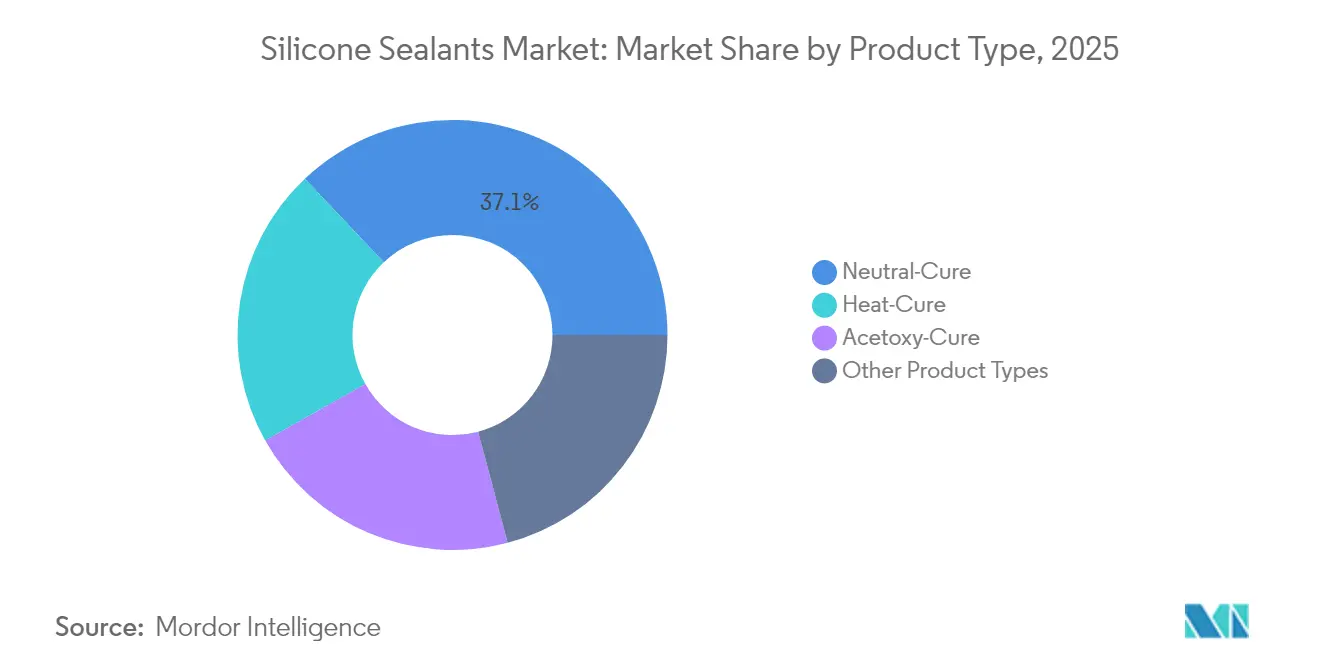
- By product type, neutral-cure grades captured 37.05% of the Silicone Sealants market share in 2025; heat-cure variants are forecast to expand at a 6.31% CAGR through 2031.
- By geography, Asia-Pacific commanded 41.02% of the Silicone Sealants market share in 2025; the region is projected to grow at a 5.89% CAGR over 2026-2031.
Note: Market size and forecast figures in this report are generated using Mordor Intelligence’s proprietary estimation framework, updated with the latest available data and insights as of 2026.
Global Silicone Sealants Market Trends and Insights
Drivers Impact Analysis*
| Driver | (~) % Impact on CAGR Forecast | Geographic Relevance | Impact Timeline |
|---|---|---|---|
| Construction boom in APAC and Middle East | +1.8% | APAC core, Middle East expansion | Medium term (2-4 years) |
| Automotive light-weighting and e-mobility adoption | +1.2% | Global, concentrated in China, Germany, USA | Long term (≥ 4 years) |
| Renovation wave in mature economies | +0.9% | North America & EU | Short term (≤ 2 years) |
| Rising industrial output in emerging markets | +0.7% | APAC, Latin America, selective MEA | Medium term (2-4 years) |
| EV battery thermal-management sealant demand | +0.6% | Global, led by China, expanding to EU/NA | Long term (≥ 4 years) |
| Source: Mordor Intelligence | |||


Construction Boom in APAC and Middle East
Record public spending across China, India, and the Philippines creates sustained demand for long-life joint-sealing solutions in rail, pipeline, and megacity projects. China’s National Development and Reform Commission has earmarked CNY 4 trillion (USD 0.56 trillion) for “hidden infrastructure” upgrades through 2030, including 200,000 km of urban pipelines where silicone chemistry outperforms acrylics under UV exposure. Manila’s PHP 8.3 trillion “Build Better More” plan adds 194 bridges and 1,200 km of expressways to withstand 40 °C ambient peaks and high seismicity[1]Philippine News Agency, “Build Better More Program Overview,” pna.gov.ph. Regional supply is underpinned by China’s 8.9% rise in chemical manufacturing investment during 2024, safeguarding resin availability. In the Gulf, AECOM specifies sealants capable of −40 °C to +150 °C thermal cycling, highlighting the need for premium neutral-cure grades on glass façades. The convergence of colossal budgets, hostile climates, and stringent durability targets positions the silicone sealants market as the preferred solution for next-generation infrastructure.
Automotive Light-weighting and E-mobility Adoption
Surging EV penetration mandates thermally conductive yet electrically insulating gap fillers that conventional polyurethanes cannot deliver. Dow’s photovoltaic-grade silicones, now cross-applied to EV modules, maintain mechanical integrity above 150 °C, supporting faster fast-charge cycles. Parker Hannifin’s CoolTherm materials reach 4.0 W/m·K conductivity, meeting ISO 16750 shock specifications for battery packs[2]Parker Hannifin, “CoolTherm Thermal Interface Solutions,” parker.com. India’s electronics clusters, buoyed by Apple’s plan to source 25% of iPhones locally by 2027, will pull additional volumes of automotive-grade sealants for regional EV production. Carbon-nanotube-laden pastes, developed through Dow–Carbice collaboration, allow higher fill rates without viscosity penalties, creating steep entry barriers for low-spec rivals. These innovations collectively catalyze new revenue streams for the silicone sealants market beyond traditional gasketing.
Renovation Wave in Mature Economies
Aging North American and European housing stock amplifies repair-and-upgrade budgets even as new-build starts softening. Harvard’s Joint Center for Housing Studies forecasts USD 477 billion in U.S. remodeling spend through Q3 2025, supported by 4a 4-year median home age. Silicone’s 25-year service life offsets upfront premiums versus acrylic caulks that fail within seven years, creating compelling total-cost economics for homeowners. Energy-retrofit spending climbed to USD 139 billion in 2024, with low-VOC neutral-cure sealants aligning with LEED (Leadership in Energy and Environmental Design) and BREEAM (Building Research Establishment Environmental Assessment Method) criteria. Angi’s 2024 survey shows 67% of households favor renovating over moving due to high mortgage rates, locking in a durable replacement cycle. Professional contractors increasingly specify mold-resistant grades for kitchens and baths, reinforcing the silicone sealants market’s pricing power.
Rising Industrial Output in Emerging Markets
India’s manufacturing value hit USD 461.38 billion in 2024, up 4.85%, catalyzing demand for ISO-10993-compliant silicones in semiconductor packaging and machinery assembly. China’s transport equipment production surged 34.9% amid EV supply-chain realignment, driving volume for heat-cure sealants inside high-precision motor housings. UNIDO’s green-manufacturing initiatives incentivize low-emission chemistries, steering purchasing toward solvent-free silicone formulations that satisfy cradle-to-cradle audits. Tax incentives on advanced materials further tilt the balance away from polyurethane, while local feedstock integration by Hangzhou Zhijiang enhances price stability. Collectively, these forces extend the silicone sealants market’s geographic and sectoral reach.
Restraints Impact Analysis*
| Restraint | (~) % Impact on CAGR Forecast | Geographic Relevance | Impact Timeline |
|---|---|---|---|
| Raw-material price volatility | -1.4% | Global, acute in regions dependent on imports | Short term (≤ 2 years) |
| Stricter global VOC and chemical regulations | -0.8% | EU/NA primary, expanding to APAC | Medium term (2-4 years) |
| Low-cost PU/acrylic alternatives in commoditized uses | -0.6% | Global, concentrated in price-sensitive segments | Long term (≥ 4 years) |
| Source: Mordor Intelligence | |||
Raw-Material Price Volatility
Spot platinum, critical for Karstedt catalysts, is forecast to stay in deficit, averaging 672 koz annually through 2029 as automotive demand tightens ore supply. Catalyst costs ripple into silicone sealing compounds, with 19-21% platinum content pushing formulators toward lower loadings or alternative metals. EU REACH restrictions on cyclic siloxanes add compliance premiums, inducing stocking risks ahead of June 2026 enforcement. Geographic production concentration in China, which lifted secondary-industry investment 12% during 2024, exposes global buyers to tariff or logistics shocks. Smaller converters, lacking hedging programs, face margin compression that could accelerate mergers among mid-tier suppliers.
Stricter Global VOC and Chemical Regulations
Canada’s 2024 VOC limits and California’s incremental CARB thresholds impose multi-regional test regimes, delaying product launches for companies with lean regulatory teams. EU caps of 0.1 % w/w for D4/D5/D6 in most sealants will require wholesale reformulation by June 2026, while adhesion and sealing exemptions up to 1% remain, albeit under scrutiny. EcoMundo notes California’s prohibition of four solvents independent of VOC class, adding layer-cake complexity to global compliance strategies. European Chemicals Agency (ECHA)’s pending silica exposure proposals threaten filler systems, compelling data-rich toxicology submissions that favor large multinationals. The cumulative burden elevates entry barriers and creates pricing corridors for compliant, high-performance offerings within the silicone sealants market.
*Our forecasts treat driver/restraint impacts as directional, not additive. The impact forecasts reflect baseline growth, mix effects, and variable interactions.
Segment Analysis
By End-user Industry: Healthcare Drives Premium Growth
Building and construction accounted for 26.12% of the Silicone Sealants market size in 2025 as curtainwall and façade contractors favored 20-year weathering warranties over acrylic alternatives. Healthcare is projected to grow fastest at 6.12% CAGR through 2031, with demand for ISO-10993 certified adhesives in catheters and respiratory devices. The silicone sealants market share for healthcare is low today, but rising as aging populations spur medical device volumes. Aerospace, while niche, demands extreme −55 °C to +200 °C thermal endurance during flight cycles, sustaining high price points against polyimide competitors. EV battery and electronics assembly collectively form an emerging cluster where heat-cure grades enable automated, short-cycle production, expanding gross margins for vertically integrated suppliers.
Mainstream construction activity in China’s Tier-2 cities and the Philippines’ expressway build-outs anchor baseline volumes through 2031. Conversely, North American renovation markets pivot toward low-VOC neutral-cure chemistries to satisfy new provincial standards. Hospitals and diagnostic-equipment OEMs require cure-in-place gaskets impervious to sterilization procedures, fostering specialty product lines that earn 20-40 % price premiums. The aerospace sector’s recovery from pandemic lows brings MRO demand for fuselage joint re-sealing, a segment where silicone sealants market size remains stable despite longer qualification cycles. Across all industries, compliance with evolving VOC and cyclic siloxane statutes is rewarding suppliers with robust regulatory dossiers.


By Product Type: Neutral-Cure Dominance Faces Heat-Cure Challenge
Neutral-cure products held 37.05% Silicone Sealants market share in 2025, owing to substrate-friendly, oxime-free formulations favored by façade engineers. Heat-cure grades, presently smaller, are advancing at 6.31% CAGR, driven by automated EV battery lines requiring tack-free times under 10 minutes. Silicone sealants market size for heat-cure variants is forecast to surpass USD 1.73 billion by 2031 as inline ovens proliferate in Asia-Pacific gigafactories. Acetoxy systems remain relevant in DIY channels because of rapid skin-over, though their acidic by-products limit use on metals. Emerging ultraviolet-assisted and condensation-cure hybrids target electronics potting, offering deep-section cure without high bake temperatures.
Thermal-gel technologies, such as Dow’s TC-3080, illustrate the convergence between heat-cure and gap-filler segments, delivering 3.0 W/m·K conductivity for power inverters. Manufacturers investing in closed-loop mixing and cartridge filling reduce catalyst losses, mitigating platinum cost risks discussed earlier. Environmental legislation is also steering demand: neutral-cure oxime systems exhibit <25 g/L VOC, easing compliance in California and Ontario markets. Although energy-intensive during cure, heat-cure chemistries achieve the highest crosslink density, bolstering long-term modulus and driving adoption in structural bonding. Consequently, both product lines will coexist, yet the silicone sealants market is shifting toward higher-margin, process-optimized grades.
Geography Analysis
Asia-Pacific’s 41.02% share stems from China’s 8.9% chemical output growth, India’s rising phone and EV assembly, and the Philippines’ PHP 8.3 trillion (USD 0.15 trillion) infrastructure roadmap. Chinese gigafactories consume heat-cure gap fillers, while Singapore’s new Sika plant debottlenecks regional capacity. Japan and South Korea emphasize high-reliability electronics, necessitating low-ion content sealants for semiconductor packaging. ASEAN’s tropical climates accelerate façade degradation, magnifying the lifetime cost benefits of premium silicone formulations.
North America’s silicone sealants market maintains steady growth as homeowners funnel USD 477 billion into remodels and Detroit automakers add battery-pack lines requiring thermal interface materials. Canada’s VOC regulations refocus product portfolios toward neutral-cure grades below 40 g/L VOC, advantaging firms with mature regulatory labs. Mexico’s near-shoring wave attracts Tier-1 battery suppliers, raising demand for quick-cure structural sealants compatible with robotic dispensing. The United States continues to innovate around carbon-nanotube-infused pastes for next-gen thermal management, a niche with high licensing hurdles.
Europe is entering a transition period ahead of June 2026 REACH siloxane limits, prompting widespread product re-engineering. Germany’s OEM push for 20 % EV sales mix by 2027 sparks consumption of thermally conductive adhesives, while the UK’s retrofit drive adopts low-modulus glazing sealants certified under BS EN ISO 11600. Scandinavian markets prioritize circularity, piloting silicone reclaim streams that recapture up to 25% material from façade strip-outs. The Middle East records double-digit growth as the Red Sea and Neom projects demand desert-grade materials. South America’s recovery is gradual; however, Argentina’s lithium mining boom may catalyze local EV component production, pulling heat-cure volumes into the region.


Competitive Landscape
The Silicone Sealants market is moderately fragmented. Large, vertically integrated firms dominate pricing and regulatory agility. Dow leverages upstream siloxane monomer capacity and a global sales network, allowing quick pivot toward low-VOC products sought in California and the EU (European Union). Sika’s CHF 11.76 billion (USD 14 billion) 2024 sales underscore its broadened footprint, amplified by new plants in Singapore and Xi’an that shorten lead times for Asian construction jobs. Smaller regional firms face high compliance costs for REACH and CARB, tilting the scale toward partnership or acquisition.
Silicone Sealants Industry Leaders
-
Dow
-
Henkel AG & Co. KGaA
-
Wacker Chemie AG
-
Shin-Etsu Chemical Co., Ltd.
-
Momentive
- *Disclaimer: Major Players sorted in no particular order


Recent Industry Developments
- January 2025: January 2025 - Wacker Chemie AG inaugurated two state-of-the-art production facilities for specialty silicones, strategically located in Japan and South Korea. These new plants are poised to cater to the surging demand for silicone sealants, driven by the automotive and construction sectors.
- November 2024: Stabond launched Firewall 2K sealant. This high-temperature silicone sealant is crafted to endure extreme temperatures. Its primary function is to bolster firewalls, ensuring they effectively block the passage of fire, smoke, and harmful gases through gaps, holes, and various components.


Global Silicone Sealants Market Report Scope
Aerospace, Automotive, Building and Construction, Healthcare are covered as segments by End User Industry. Asia-Pacific, Europe, Middle East & Africa, North America, South America are covered as segments by Region.| Aerospace |
| Automotive |
| Building and Construction |
| Healthcare |
| Other End-user Industries |
| Acetoxy-Cure |
| Neutral-Cure |
| Heat-Cure |
| Other Product Types |
| Asia-Pacific | China |
| India | |
| Japan | |
| South Korea | |
| Rest of Asia-Pacific | |
| North America | United States |
| Canada | |
| Mexico | |
| Europe | Germany |
| United Kingdom | |
| France | |
| Italy | |
| Spain | |
| Russia | |
| Rest of Europe | |
| South America | Brazil |
| Argentina | |
| Rest of South America | |
| Middle East and Africa | Saudi Arabia |
| South Africa | |
| Rest of Middle East and Africa |
| By End-user Industry | Aerospace | |
| Automotive | ||
| Building and Construction | ||
| Healthcare | ||
| Other End-user Industries | ||
| By Product Type | Acetoxy-Cure | |
| Neutral-Cure | ||
| Heat-Cure | ||
| Other Product Types | ||
| By Geography | Asia-Pacific | China |
| India | ||
| Japan | ||
| South Korea | ||
| Rest of Asia-Pacific | ||
| North America | United States | |
| Canada | ||
| Mexico | ||
| Europe | Germany | |
| United Kingdom | ||
| France | ||
| Italy | ||
| Spain | ||
| Russia | ||
| Rest of Europe | ||
| South America | Brazil | |
| Argentina | ||
| Rest of South America | ||
| Middle East and Africa | Saudi Arabia | |
| South Africa | ||
| Rest of Middle East and Africa | ||


Market Definition
- End-user Industry - Building & Construction, Automotive, Aerospace, Healthcare, and Others are the end-user industries considered under the silicone sealants market.
- Product - All silicone sealant products are considered in the market studied
- Resin - Under the scope of the study, acetoxy (or acetic) and neutral silicones are considered
- Technology - Silicone sealants are cured at ambient temperature (room temperatures).
| Keyword | Definition |
|---|---|
| Hot-melt Adhesive | Hot melt adhesives are generally 100% solid formulations, based on thermoplastic polymers. They are solid at room temperature and are activated upon heating above their softening point, at which stage they are liquid, and hence, can be processed. |
| Reactive Adhesive | A reactive adhesive is made up of monomers that react in the adhesive curing process and do not evaporate from the film during use. Instead, these volatile components become chemically incorporated into the adhesive. |
| Solvent-borne Adhesive | Solvent-borne adhesives are mixtures of solvents and thermoplastic, or slightly cross-linked polymers, such as polychloroprene, polyurethane, acrylic, silicone, and natural and synthetic rubbers (elastomers). |
| Water-borne Adhesive | Water-borne adhesives use water as a carrier or diluting medium to disperse a resin. They are set by allowing the water to evaporate or be absorbed by the substrate. These adhesives are compounded with water as a diluent, rather than a volatile organic solvent. |
| UV Cured Adhesive | UV curing adhesives induce curing and create a permanent bond without heating by using ultraviolet (UV) light or other radiation sources. An aggregation of monomers and oligomers is cured or polymerized by ultraviolet (UV) or visible light in a UV adhesive. Because UV is a radiating energy source, UV adhesives are often referred to as radiation curing or rad-cure adhesives. |
| Heat-resistant Adhesive | Heat-resistant Adhesives refer to those that do not break down under high temperatures. One aspect of a complicated system of circumstances is the adhesive's capacity to withstand disintegration brought on by high temperatures. As the temperature rises, adhesives may liquefy. They can withstand stresses resulting from differing coefficients of expansion and contraction, which might be an additional advantage. |
| Reshoring | Reshoring is the practice of moving commodity production and manufacturing back to the nation where the business was founded. Onshoring, inshoring, and back shoring are further terms used. Offshoring, the practice of producing items abroad to lower labor and manufacturing costs, is the opposite of this. |
| Oleochemicals | Oleochemicals are compounds produced from biological oils or fats. They resemble petrochemicals, which are substances made from petroleum. The oleochemical business is built on the hydrolysis of oils or fats. |
| Nonporous Materials | Nonporous materials are substances that do not permit the passage of liquid or air. Nonporous materials are those that are not porous, such as glass, plastic, metal, and varnished wood. Since no air can get through, less airflow is required to raise these materials, negating the requirement for high airflow. |
| EU-Vietnam Free Trade Agreement | A trade agreement and an investment protection agreement were concluded between the European Union and Vietnam on June 30, 2019. |
| VOC content | Compounds with limited solubility in water and high vapor pressure are known as Volatile Organic Compounds (VOCs). Many VOCs are human-made chemicals that are used and produced in the manufacture of paints, pharmaceuticals, and refrigerants. |
| Emulsion Polymerization | Emulsion polymerization is a method of producing polymers or connected groups of smaller chemical chains known as monomers, in a water solution. The method is often used to make water-based paints, adhesives, and varnishes, in which the water stays with the polymer and is marketed as a liquid product. |
| 2025 National Packaging Targets | In 2018, the Australian Environment Ministry set the following 2025 National Packaging Targets: 100% of the packaging must be reusable, recyclable, or compostable by 2025, 70% of plastic packaging must be recycled or composted by 2025, 50% of average recycled content must be included in packaging by 2025, and problematic and unnecessary single-use plastic packaging must be phased out by 2025. |
| Russian Government’s Import Substitution Policy | The Western sanctions suspended the distribution of several high-tech items to Russia, including those required by the raw material export sectors and the military-industrial complex. In response, the government launched an "import substitution" scheme, appointing a special commission to oversee its implementation in early 2015. |
| Paper Substrate | Paper substrates are paper sheets, reels, or boards with a base weight of up to 400 g/m2 that has not been converted, printed or otherwise altered. |
| Insulation Material | A material that inhibits or blocks heat, sound, or electrical transmission is known as Insulation Material. The variety of insulation materials includes thick fibers like fiberglass, rock and slag wool, cellulose, and natural fibers as well as stiff foam boards and sleek foils. |
| Thermal Shock | A temperature change known as thermal shock generates stress in a material. It commonly results in material breakdown and is especially prevalent in brittle materials like ceramics. When there is a quick temperature change, either from hot to cold or vice versa, this process occurs abruptly. It occurs more frequently in materials with poor heat conductivity and insufficient structural integrity. |


Research Methodology
Mordor Intelligence follows a four-step methodology in all our reports.
- Step-1: Identify Key Variables: The quantifiable key variables (industry and extraneous) pertaining to the specific product segment and country are selected from a group of relevant variables & factors based on desk research & literature review; along with primary expert inputs. These variables are further confirmed through regression modeling (wherever required).
- Step-2: Build a Market Model: In order to build a robust forecasting methodology, the variables and factors identified in Step-1 are tested against available historical market numbers. Through an iterative process, the variables required for market forecast are set and the model is built on the basis of these variables.
- Step-3: Validate and Finalize: In this important step, all market numbers, variables and analyst calls are validated through an extensive network of primary research experts from the market studied. The respondents are selected across levels and functions to generate a holistic picture of the market studied.
- Step-4: Research Outputs: Syndicated Reports, Custom Consulting Assignments, Databases & Subscription Platforms


