Silicone Adhesives & Sealants Market Size and Share
Market Overview
| Study Period | 2017 - 2028 |
|---|---|
| Forecast Data Period | 2024 - 2028 |
| Historical Data Period | 2017 - 2022 |
| Market Size (2024) | USD 7.69 Billion |
| Market Size (2028) | USD 9.67 Billion |
| Growth Rate (2024 - 2028) | 5.91% CAGR |
| Market Concentration | Low |
Major Players*Disclaimer: Major Players sorted in no particular order Image © Mordor Intelligence. Reuse requires attribution under CC BY 4.0. | |

Silicone Adhesives & Sealants Market Analysis by Mordor Intelligence
The Silicone Adhesives & Sealants Market size is estimated at 7.69 billion USD in 2024, and is expected to reach 9.67 billion USD by 2028, growing at a CAGR of 5.91% during the forecast period (2024-2028).
The silicone adhesives and sealants industry is experiencing significant transformation driven by technological advancements and evolving industry requirements. These materials have gained prominence due to their exceptional versatility and performance characteristics, including remarkable temperature resistance ranging from -65°C to 300°C. The industry has witnessed substantial innovation in formulation technologies, with manufacturers focusing on developing products that offer enhanced durability and sustainability. A notable trend is the increasing adoption of water-borne technologies, which currently account for approximately 70% of the total adhesives and sealants market, primarily due to their cost-effectiveness and environmental benefits.
The construction sector remains a crucial driver of innovation in silicone adhesives and sealants, with the industry projected to grow at a CAGR of 3.5% through 2030. Manufacturers are developing advanced formulations that provide superior weatherability and durability while meeting stringent environmental regulations. These products are increasingly being integrated into modern construction practices, particularly in energy-efficient building designs where they play a vital role in maintaining thermal efficiency and structural integrity. The rapid curing capabilities of modern silicone adhesives, typically achieving full cure within 24 hours, have made them particularly attractive for fast-paced construction projects.
The electronics industry represents an emerging frontier for silicone adhesives and sealants, with usage expected to grow at a CAGR of 2.57% through 2028. This growth is driven by the increasing complexity of electronic devices and the need for reliable bonding solutions that can withstand extreme conditions. Manufacturers are developing specialized formulations that offer excellent electrical insulation properties while maintaining thermal conductivity, making them ideal for advanced electronic applications. The industry is witnessing a shift towards products that combine high performance with enhanced processing efficiency.
Sustainability has emerged as a key focus area within the silicone sealants industry, with manufacturers investing in eco-friendly formulations and production processes. The development of low-VOC products and bio-based alternatives represents a significant trend, as companies respond to increasing environmental regulations and consumer preferences. Advanced silicone adhesives and sealants technologies are being developed to improve energy efficiency in buildings by preventing heat loss through seams and gaps, contributing to reduced energy consumption. These innovations are complemented by improvements in application technologies, making installation more efficient and reducing material waste during application processes.
Global Silicone Adhesives & Sealants Market Trends and Insights
Growing residential and infrastructural development to thrive the construction sector
- The building and construction industry witnessed steady growth, with a CAGR of 2.6% from 2017 to 2019. This growth was driven by the upswing in global economic activity and increasing demand for single-family homes. In 2020, the COVID-19 pandemic had a major impact on the global building and construction industry. Constraints in labor supply, disruptions in construction finances and the supply chain, and economic uncertainty negatively impacted the global building and construction industry.
- Though the industry showed positive growth in 2021, the pandemic's effect on supply chains, which resulted in a hike in raw material prices, is still plaguing the industry. However, as the construction industry heavily influences a nation's economy, countries in Europe, North America, and Asia-Pacific have used the construction industry to restart their economic cycles by offering support schemes. Some support schemes include the Homebuilder Programme in Australia and the economic recovery plan of EU countries.
- The Asia-Pacific region experiences the highest volume of construction activities, and it is expected to remain the largest construction market till 2028 due to its huge population, increasing urbanization, and increasing investments in infrastructural development in countries like China, India, Japan, Indonesia, and South Korea.
- Increasing emphasis on green buildings and efforts to reduce emissions from global construction activities are expected to result in more sustainable operational procedures during the forecast period. For example, France has sanctioned EUR 7.5 billion for the construction industry to transform itself into a low-carbon energy economy.


Favorable government policies to promote electric vehicles will propel automotive industry
- Since 2021, the global automotive industry has been expected to grow steadily but at a slower pace because of the decline in consumers' preferences for individual ownership of passenger vehicles and their increased preference for shared mobility in transportation. The global automotive industry is expected to experience a growth rate of 2% annually, with an expected value addition of USD 1.5 trillion in total revenue during the forecast period.
- In 2020, due to the impact of the COVID-19 pandemic, vehicle sales declined but recovered rapidly in 2021 because the governments of various countries took measures to support their economies, as automotive markets usually contribute majorly to their GDP. Vehicle sales declined from 90 million units of passenger vehicles in 2019 to 78 million units in 2020.
- The introduction of electric vehicles worldwide has contributed significantly to the overall revenue of the global automotive market because of their cheaper energy costs, environmentally benign nature, and efficient mobility features. Various government policies and standards also work as driving factors to increase EV production. For instance, the EU standards for CO2 emissions increased the demand for electric vehicles in 2021. As per the IEA's Sustainable Scenario, 230 million electric vehicles are required to replace combustion fuel-based vehicles by 2030. In 2021, Tesla, the largest EV manufacturer, recorded a rise of 157% in the number of electric vehicles manufactured. This growing trend of consumers preferring electric vehicles is expected to rise further during the forecast period (2022-2028).

OTHER KEY INDUSTRY TRENDS COVERED IN THE REPORT
- Rapid growth of civil and military aviation will boost the aircraft production
- Rising demand for home & office furniture to aid the growth of the industry
- Fast paced growth of e-commerce industry in developing nations to augment the industry
Segment Analysis: End User Industry
Building & Construction Segment in Silicone Adhesives & Sealants Market
The building and construction segment dominates the global silicone adhesives and sealants market, accounting for approximately 42% of the market share in 2024. This segment's prominence is driven by the extensive use of silicone-based products in various construction applications, including structural glazing, weatherproofing, and joint sealing. The segment's leadership position is reinforced by silicone sealants' unique properties such as weather resistance, flexibility over wide temperature ranges, and excellent adhesion to various construction materials. The implementation of energy-efficient building practices and the growing trend toward sustainable construction have further boosted the segment's growth. Major infrastructure development projects, particularly in emerging economies, combined with the increasing adoption of glass facades in commercial buildings, continue to drive substantial demand for silicone adhesives and sealants in this sector.
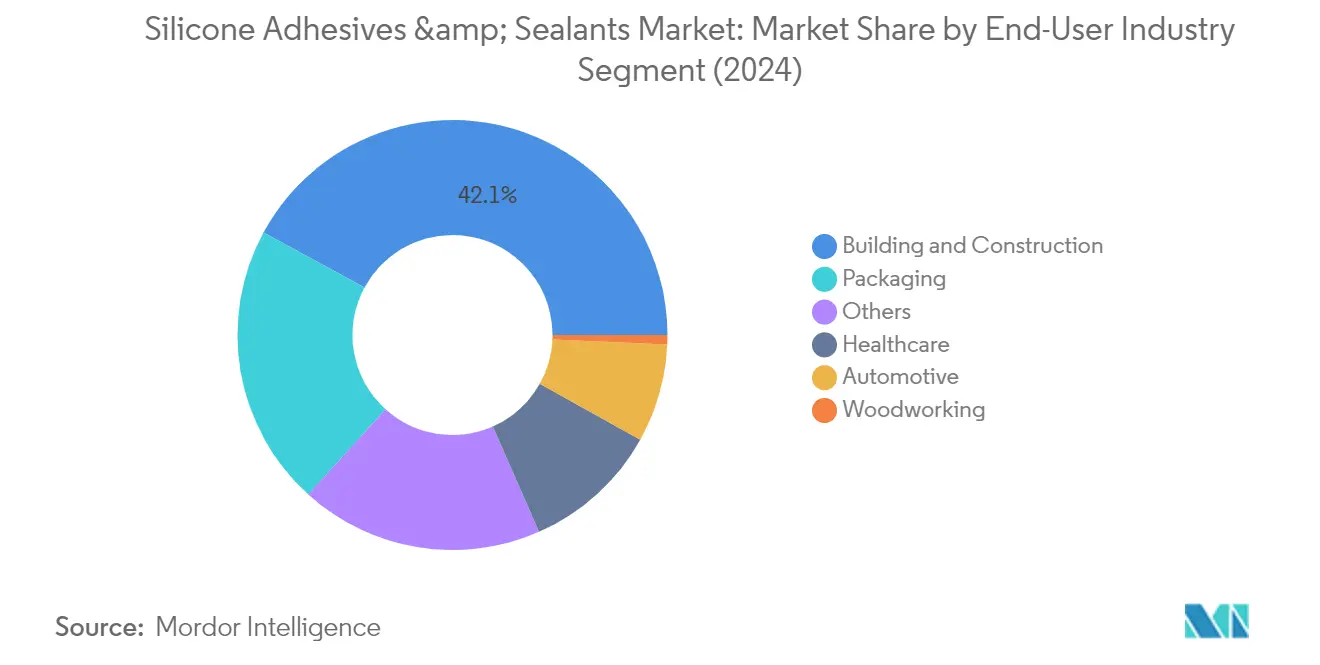

Remaining Segments in End-User Industry
The market encompasses several other significant end-user segments, including packaging, automotive, healthcare, and woodworking and joinery industries. The packaging segment holds particular significance due to the increasing demand for flexible and sustainable packaging solutions across various industries. The automotive sector utilizes silicone adhesives and sealants for bonding and sealing applications in vehicle assembly, particularly in electric vehicles where thermal management is crucial. The healthcare sector represents another vital segment, with applications in medical device manufacturing and various healthcare products. The woodworking and joinery segment, while smaller in market share, maintains steady demand for specific applications in furniture manufacturing and wood bonding. Each of these segments contributes uniquely to the market's dynamics, driven by their specific technological requirements and industry trends.
Segment Analysis: Technology
Sealants Segment in Silicone Adhesives & Sealants Market
The sealants segment dominates the global silicone adhesives and sealants market, accounting for approximately 68% of the total market value in 2024. This significant market share can be attributed to the segment's widespread application across various industries, particularly in the construction and automotive sectors. Sealants are extensively used in structural glazing, joint sealing, and heat insulation applications due to their ability to operate across a broad temperature range from -45°C to 200°C. The segment's dominance is further strengthened by its exceptional properties, including UV stability, increased temperature resistance, high workability, and superior adhesion to various construction surfaces. The RTV silicone adhesive market is also a key part of this segment, offering robust solutions for diverse applications.
Water-borne Segment in Silicone Adhesives & Sealants Market
The water-borne segment is emerging as the fastest-growing technology in the silicone adhesives and sealants market, driven by increasing environmental regulations and growing demand for sustainable solutions. These adhesives are formulated as dispersions or emulsions with particle diameters ranging from 50 to 300 nm, making them ideal for various applications. The segment's growth is particularly strong in the packaging industry, where water-borne adhesives are preferred for their flexibility, high elongation properties, and cost-effectiveness being approximately 50% cheaper than other technologies. Their eco-friendly nature and low VOC emissions make them increasingly attractive for manufacturers looking to meet stringent environmental regulations. The silicone adhesives market revenue from this segment is expected to witness significant growth.
Remaining Segments in Technology
The market also includes hot melt, reactive, solvent-borne, and UV-cured adhesive segments, each serving specific industrial applications. Hot melt adhesives are particularly valued in healthcare and automotive electronics applications, while reactive adhesives excel in heavy-load applications requiring high-strength adherence. Solvent-borne adhesives maintain a significant presence in packaging applications, though facing challenges from environmental regulations. UV-cured adhesives have carved out a niche in medical device manufacturing and electronics assembly due to their rapid curing properties and strong bonding characteristics. The medical silicone adhesive market and silicone medical adhesive market are integral to these advancements, particularly in healthcare applications.
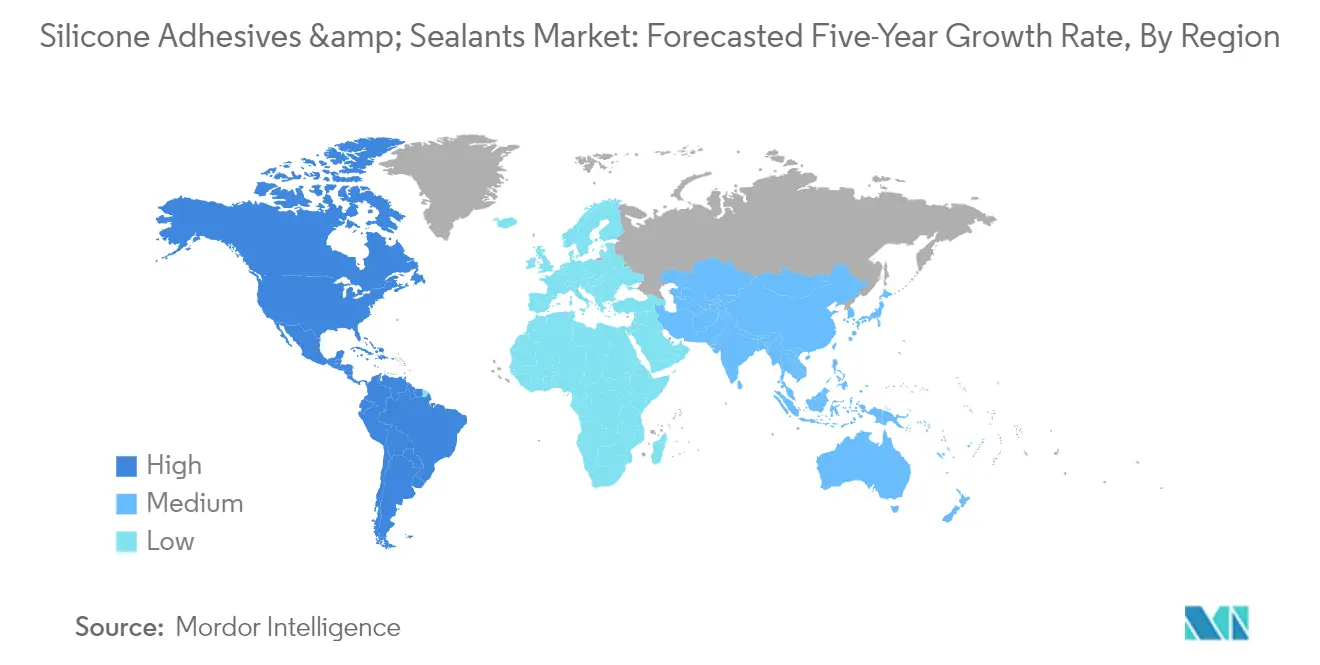
Silicone Adhesives & Sealants Market Geography Segment Analysis
Silicone Adhesives & Sealants Market in Asia-Pacific
The Asia-Pacific region represents the dominant market for silicone adhesives and sealants globally, driven by robust growth across the construction, automotive, electronics, and packaging industries. Key markets include China, Japan, South Korea, India, Australia, Indonesia, Malaysia, Singapore, and Thailand. The region's manufacturing capabilities, growing urbanization, and increasing investments in infrastructure development contribute significantly to market expansion. Government initiatives promoting sustainable construction and the rising adoption of advanced manufacturing technologies further augment market growth across these countries.
Silicone Adhesives & Sealants Market in China
China maintains its position as the largest market for silicone adhesives and sealants in the Asia-Pacific region, holding approximately 38% market share in 2024. The country's dominance is attributed to its massive construction sector, extensive automotive manufacturing base, and growing electronics industry. China's commitment to sustainable development and energy-efficient buildings has increased the demand for silicone sealants in structural glazing applications. The country's robust supply chain infrastructure, presence of major manufacturers, and continued investments in research and development further strengthen its market leadership.
Silicone Adhesives & Sealants Market in India
India emerges as the fastest-growing market in the Asia-Pacific region, with a projected growth rate of approximately 5% during 2024-2029. The country's rapid industrialization, expanding construction sector, and growing automotive industry drive this growth. Implementation of government initiatives like the Smart City Mission and increasing investments in urban development contribute to market expansion. The country's focus on developing its manufacturing capabilities, coupled with rising foreign direct investments in construction and infrastructure projects, creates substantial opportunities for silicone adhesives and sealants manufacturers.
Silicone Adhesives & Sealants Market in Europe
Europe represents a sophisticated market for silicone adhesives and sealants, characterized by stringent regulations and high-quality standards. The region's market is driven by advanced manufacturing sectors, particularly in Germany, France, the United Kingdom, Italy, Spain, and Russia. A strong emphasis on sustainable building practices and energy efficiency in construction, coupled with the region's robust automotive and aerospace industries, continues to drive demand. The European Union's focus on green building initiatives and circular economy principles shapes market development across these countries.
Silicone Adhesives & Sealants Market in Germany
Germany stands as the largest market for silicone adhesives and sealants in Europe, commanding approximately 25% of the regional market share in 2024. The country's leadership position is supported by its advanced automotive sector, robust construction industry, and strong presence in medical device manufacturing. Germany's emphasis on technological innovation, particularly in electric vehicle production and sustainable building practices, drives continuous demand for high-performance silicone adhesives and sealants. The country's well-established industrial infrastructure and focus on quality manufacturing contribute to its market dominance.
Silicone Adhesives & Sealants Market in United Kingdom
The United Kingdom positions itself as the fastest-growing market in Europe, with an expected growth rate of around 4% during 2024-2029. The country's market growth is driven by increasing investments in healthcare infrastructure, rising construction activities, and growing demand from the automotive sector. The UK's focus on developing sustainable building solutions and its strong presence in medical device manufacturing contribute to market expansion. Ongoing urban development projects and infrastructure initiatives further boost the demand for silicone adhesives and sealants.
Silicone Adhesives & Sealants Market in Middle East & Africa
The Middle East & Africa region demonstrates significant potential in the silicone adhesives and sealants market, driven by extensive construction activities and infrastructure development projects. Saudi Arabia and South Africa emerge as key markets in the region, with diverse applications across construction, automotive, and healthcare sectors. The region's focus on developing sustainable cities and modern infrastructure creates substantial opportunities for market growth.
Silicone Adhesives & Sealants Market in Saudi Arabia
Saudi Arabia maintains its position as the largest market for silicone adhesives and sealants in the Middle East & Africa region. The country's market leadership is driven by massive construction projects under Vision 2030, including the development of Neom City and other mega-projects. The growing emphasis on sustainable building practices and energy-efficient construction methods further strengthens the demand for silicone-based products in the country.
Silicone Adhesives & Sealants Market in United Arab Emirates
The United Arab Emirates emerges as the fastest-growing market in the Middle East & Africa region. The country's rapid urbanization, ambitious construction projects, and focus on developing smart cities drive market growth. The UAE's commitment to sustainable development and green building practices creates increasing opportunities for silicone adhesives and sealants applications across various construction projects.
Silicone Adhesives & Sealants Market in North America
The North American market for silicone adhesives and sealants demonstrates strong growth potential, encompassing Canada, Mexico, and the United States. The region's market is characterized by technological advancement, stringent quality standards, and an increasing focus on sustainable solutions. The United States emerges as both the largest and fastest-growing market in the region, driven by robust construction activities, advanced healthcare infrastructure, and a strong automotive manufacturing base. The region's emphasis on research and development, coupled with growing demand from the electronics and medical device sectors, continues to drive market expansion.
Silicone Adhesives & Sealants Market in South America
The South American silicone adhesives and sealants market shows promising growth potential, with Argentina and Brazil as key markets. The region's market development is driven by increasing construction activities, growing automotive production, and rising demand from the packaging industry. Brazil emerges as both the largest and fastest-growing market in the region, supported by its extensive manufacturing base and ongoing infrastructure development projects. The region's focus on industrial development and increasing investments in construction projects creates favorable conditions for market expansion.

Competitive Landscape
Top Companies in Silicone Adhesives & Sealants Market
The global silicone adhesives and sealants market is characterized by continuous product innovation focused on developing sustainable and high-performance solutions. Companies are heavily investing in research and development to create products with enhanced thermal resistance, UV stability, and improved bonding capabilities. Strategic expansion moves have centered on establishing new manufacturing facilities and technology centers, particularly in emerging Asian markets to capture growing regional demand. Market leaders are strengthening their positions through vertical integration and expanding their distribution networks across multiple regions. Acquisition strategies have primarily targeted local manufacturers with a strong regional presence and complementary product portfolios, while partnerships have focused on enhancing technological capabilities and market access.
Fragmented Market with Strong Regional Players
The silicone adhesives market exhibits a partly fragmented structure with a mix of global chemical conglomerates and specialized manufacturers. The top five companies collectively hold about one-third of the market share, indicating moderate concentration at the top while maintaining competitive dynamics. Global leaders like Henkel, Sika, and Dow leverage their extensive manufacturing networks and broad product portfolios across multiple end-user industries, while regional specialists focus on specific applications or geographical markets. These companies compete through product differentiation, technical support capabilities, and established relationships with key industries such as construction, automotive, and electronics.
The market has witnessed significant merger and acquisition activity, particularly focused on expanding geographical presence and technological capabilities. Large companies are actively acquiring regional players to strengthen their market position and gain access to local distribution networks. This consolidation trend is particularly prominent in emerging markets where local manufacturers have strong customer relationships and market understanding. Companies are also forming strategic alliances to enhance their product offerings and expand their presence in high-growth application segments.
Innovation and Sustainability Drive Future Success
Success in the silicone adhesives and sealants market increasingly depends on developing environmentally sustainable products while maintaining high-performance standards. Companies need to focus on creating products with lower volatile organic compound emissions and improved recyclability to meet evolving regulatory requirements and customer preferences. Market leaders are investing in digital capabilities to enhance customer service and technical support, while also optimizing their supply chains to ensure reliable product availability. Building strong relationships with key end-user industries through customized solutions and technical collaboration has become crucial for maintaining market position.
For new entrants and smaller players, success lies in identifying and serving niche market segments with specialized products and applications. Companies need to develop expertise in specific end-user industries and build strong technical support capabilities to differentiate themselves from larger competitors. Geographic expansion strategies should focus on regions with growing construction and industrial activities, while also considering potential regulatory changes that could impact product formulations. Building strong distribution networks and maintaining close relationships with raw material suppliers is essential for ensuring competitive pricing and reliable supply. The ability to quickly adapt to changing market conditions and customer requirements will be crucial for long-term success in this evolving market.
The silicone sealants market forecast indicates a growing demand for sustainable and high-performance solutions, driven by advancements in technology and increasing regulatory pressures.
Silicone Adhesives & Sealants Industry Leaders
Chengdu Guibao Science and Technology Co., Ltd.
Dow
Henkel AG & Co. KGaA
Sika AG
Soudal Holding N.V.
- *Disclaimer: Major Players sorted in no particular order


Recent Industry Developments
- May 2022: ITW Performance Polymers announced a distribution partnership with PREMA SA in Poland for its Devcon brand.
- December 2021: Sika planned to establish a new technology center and manufacturing factory for high-quality adhesives and sealants in Pune, India. The company primarily manufactures products for the transportation and construction industries through its three new production lines.
- November 2021: WACKER introduced silicone adhesive gels for wound dressings and wearables at COMPAMED. This silicone adhesive gel is water-repellent but breathable owing to its permeability to water vapor and gas, optimizing wound healing significantly.


Global Silicone Adhesives & Sealants Market Report Scope
Aerospace, Automotive, Building and Construction, Healthcare, Packaging, Woodworking and Joinery are covered as segments by End User Industry. Hot Melt, Reactive, Sealants, Solvent-borne, UV Cured Adhesives, Water-borne are covered as segments by Technology. Asia-Pacific, Europe, Middle East & Africa, North America, South America are covered as segments by Region.| Aerospace |
| Automotive |
| Building and Construction |
| Healthcare |
| Packaging |
| Woodworking and Joinery |
| Other End-user Industries |
| Hot Melt |
| Reactive |
| Sealants |
| Solvent-borne |
| UV Cured Adhesives |
| Water-borne |
| Asia-Pacific | Australia |
| China | |
| India | |
| Indonesia | |
| Japan | |
| Malaysia | |
| Singapore | |
| South Korea | |
| Thailand | |
| Rest of Asia-Pacific | |
| Europe | France |
| Germany | |
| Italy | |
| Russia | |
| Spain | |
| United Kingdom | |
| Rest of Europe | |
| Middle East & Africa | Saudi Arabia |
| South Africa | |
| Rest of Middle East & Africa | |
| North America | Canada |
| Mexico | |
| United States | |
| Rest of North America | |
| South America | Argentina |
| Brazil | |
| Rest of South America |
| End User Industry | Aerospace | |
| Automotive | ||
| Building and Construction | ||
| Healthcare | ||
| Packaging | ||
| Woodworking and Joinery | ||
| Other End-user Industries | ||
| Technology | Hot Melt | |
| Reactive | ||
| Sealants | ||
| Solvent-borne | ||
| UV Cured Adhesives | ||
| Water-borne | ||
| Region | Asia-Pacific | Australia |
| China | ||
| India | ||
| Indonesia | ||
| Japan | ||
| Malaysia | ||
| Singapore | ||
| South Korea | ||
| Thailand | ||
| Rest of Asia-Pacific | ||
| Europe | France | |
| Germany | ||
| Italy | ||
| Russia | ||
| Spain | ||
| United Kingdom | ||
| Rest of Europe | ||
| Middle East & Africa | Saudi Arabia | |
| South Africa | ||
| Rest of Middle East & Africa | ||
| North America | Canada | |
| Mexico | ||
| United States | ||
| Rest of North America | ||
| South America | Argentina | |
| Brazil | ||
| Rest of South America | ||


Market Definition
- End-user Industry - Building & Construction, Packaging, Automotive, Aerospace, Woodworking & Joinery, Footwear & Leather, Healthcare, and Others are the end-user industries considered under the silicone adhesives and sealants market.
- Product - All silicone adhesive and sealant products are considered in the market studied
- Resin - Under the scope of the study, one component and two component based silicone adhesives are considered
- Technology - For the purpose of this study, Water-borne, Solvent-borne, Reactive, Hot Melt, UV Cured Adhesives, and Sealants technologies are taken into consideration.
| Keyword | Definition |
|---|---|
| Hot-melt Adhesive | Hot melt adhesives are generally 100% solid formulations, based on thermoplastic polymers. They are solid at room temperature and are activated upon heating above their softening point, at which stage they are liquid, and hence, can be processed. |
| Reactive Adhesive | A reactive adhesive is made up of monomers that react in the adhesive curing process and do not evaporate from the film during use. Instead, these volatile components become chemically incorporated into the adhesive. |
| Solvent-borne Adhesive | Solvent-borne adhesives are mixtures of solvents and thermoplastic, or slightly cross-linked polymers, such as polychloroprene, polyurethane, acrylic, silicone, and natural and synthetic rubbers (elastomers). |
| Water-borne Adhesive | Water-borne adhesives use water as a carrier or diluting medium to disperse a resin. They are set by allowing the water to evaporate or be absorbed by the substrate. These adhesives are compounded with water as a diluent, rather than a volatile organic solvent. |
| UV Cured Adhesive | UV curing adhesives induce curing and create a permanent bond without heating by using ultraviolet (UV) light or other radiation sources. An aggregation of monomers and oligomers is cured or polymerized by ultraviolet (UV) or visible light in a UV adhesive. Because UV is a radiating energy source, UV adhesives are often referred to as radiation curing or rad-cure adhesives. |
| Heat-resistant Adhesive | Heat-resistant Adhesives refer to those that do not break down under high temperatures. One aspect of a complicated system of circumstances is the adhesive's capacity to withstand disintegration brought on by high temperatures. As the temperature rises, adhesives may liquefy. They can withstand stresses resulting from differing coefficients of expansion and contraction, which might be an additional advantage. |
| Reshoring | Reshoring is the practice of moving commodity production and manufacturing back to the nation where the business was founded. Onshoring, inshoring, and back shoring are further terms used. Offshoring, the practice of producing items abroad to lower labor and manufacturing costs, is the opposite of this. |
| Oleochemicals | Oleochemicals are compounds produced from biological oils or fats. They resemble petrochemicals, which are substances made from petroleum. The oleochemical business is built on the hydrolysis of oils or fats. |
| Nonporous Materials | Nonporous materials are substances that do not permit the passage of liquid or air. Nonporous materials are those that are not porous, such as glass, plastic, metal, and varnished wood. Since no air can get through, less airflow is required to raise these materials, negating the requirement for high airflow. |
| EU-Vietnam Free Trade Agreement | A trade agreement and an investment protection agreement were concluded between the European Union and Vietnam on June 30, 2019. |
| VOC content | Compounds with limited solubility in water and high vapor pressure are known as Volatile Organic Compounds (VOCs). Many VOCs are human-made chemicals that are used and produced in the manufacture of paints, pharmaceuticals, and refrigerants. |
| Emulsion Polymerization | Emulsion polymerization is a method of producing polymers or connected groups of smaller chemical chains known as monomers, in a water solution. The method is often used to make water-based paints, adhesives, and varnishes, in which the water stays with the polymer and is marketed as a liquid product. |
| 2025 National Packaging Targets | In 2018, the Australian Environment Ministry set the following 2025 National Packaging Targets: 100% of the packaging must be reusable, recyclable, or compostable by 2025, 70% of plastic packaging must be recycled or composted by 2025, 50% of average recycled content must be included in packaging by 2025, and problematic and unnecessary single-use plastic packaging must be phased out by 2025. |
| Russian Government’s Import Substitution Policy | The Western sanctions suspended the distribution of several high-tech items to Russia, including those required by the raw material export sectors and the military-industrial complex. In response, the government launched an "import substitution" scheme, appointing a special commission to oversee its implementation in early 2015. |
| Paper Substrate | Paper substrates are paper sheets, reels, or boards with a base weight of up to 400 g/m2 that has not been converted, printed or otherwise altered. |
| Insulation Material | A material that inhibits or blocks heat, sound, or electrical transmission is known as Insulation Material. The variety of insulation materials includes thick fibers like fiberglass, rock and slag wool, cellulose, and natural fibers as well as stiff foam boards and sleek foils. |
| Thermal Shock | A temperature change known as thermal shock generates stress in a material. It commonly results in material breakdown and is especially prevalent in brittle materials like ceramics. When there is a quick temperature change, either from hot to cold or vice versa, this process occurs abruptly. It occurs more frequently in materials with poor heat conductivity and insufficient structural integrity. |


Research Methodology
Mordor Intelligence follows a four-step methodology in all our reports.
- Step-1: Identify Key Variables: The quantifiable key variables (industry and extraneous) pertaining to the specific product segment and country are selected from a group of relevant variables & factors based on desk research & literature review; along with primary expert inputs. These variables are further confirmed through regression modeling (wherever required).
- Step-2: Build a Market Model: In order to build a robust forecasting methodology, the variables and factors identified in Step-1 are tested against available historical market numbers. Through an iterative process, the variables required for market forecast are set and the model is built on the basis of these variables.
- Step-3: Validate and Finalize: In this important step, all market numbers, variables and analyst calls are validated through an extensive network of primary research experts from the market studied. The respondents are selected across levels and functions to generate a holistic picture of the market studied.
- Step-4: Research Outputs: Syndicated Reports, Custom Consulting Assignments, Databases & Subscription Platforms


