Self-service BI Market Size and Share
Market Overview
| Study Period | 2020 - 2031 |
|---|---|
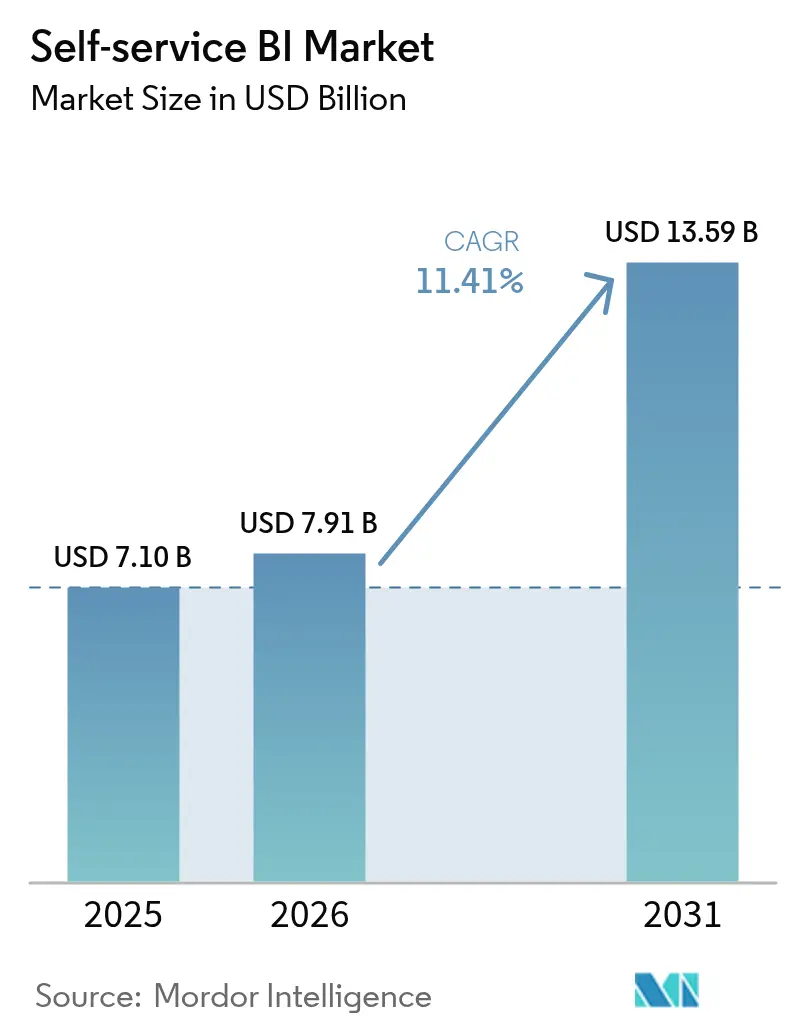
| Market Size (2026) | USD 7.91 Billion |
| Market Size (2031) | USD 13.59 Billion |
| Growth Rate (2026 - 2031) | 11.41% CAGR |
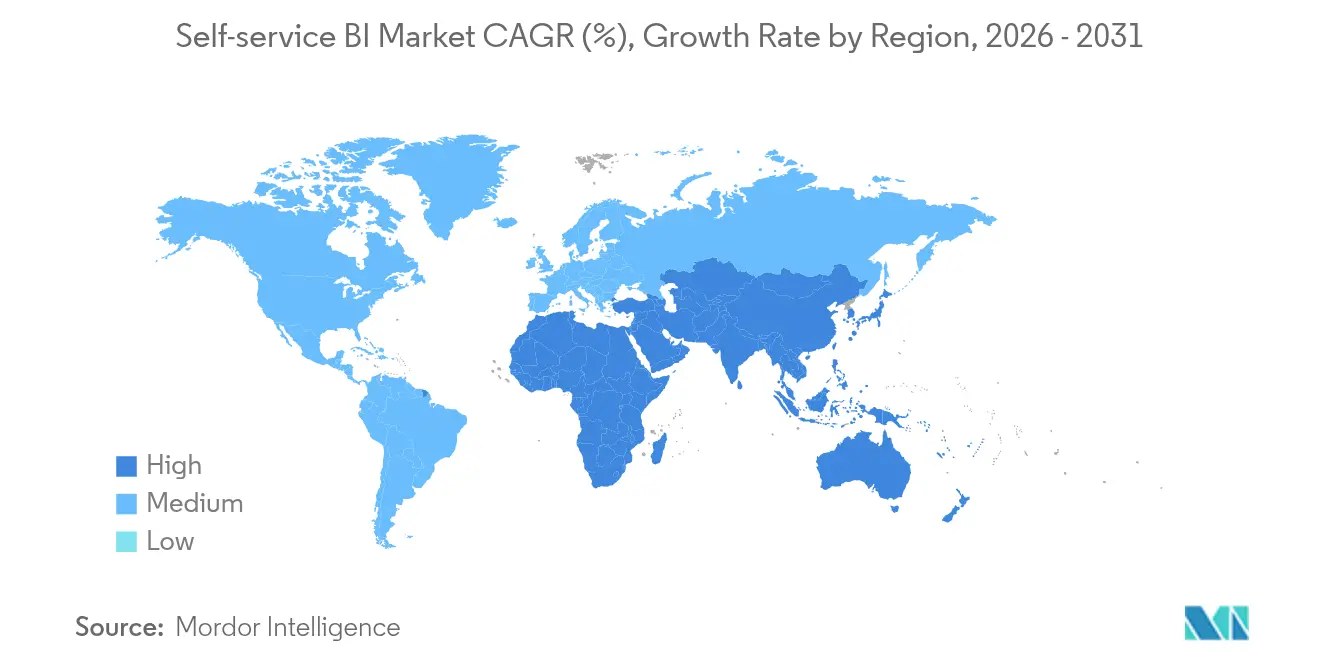
| Fastest Growing Market | Asia Pacific |
| Largest Market | North America |
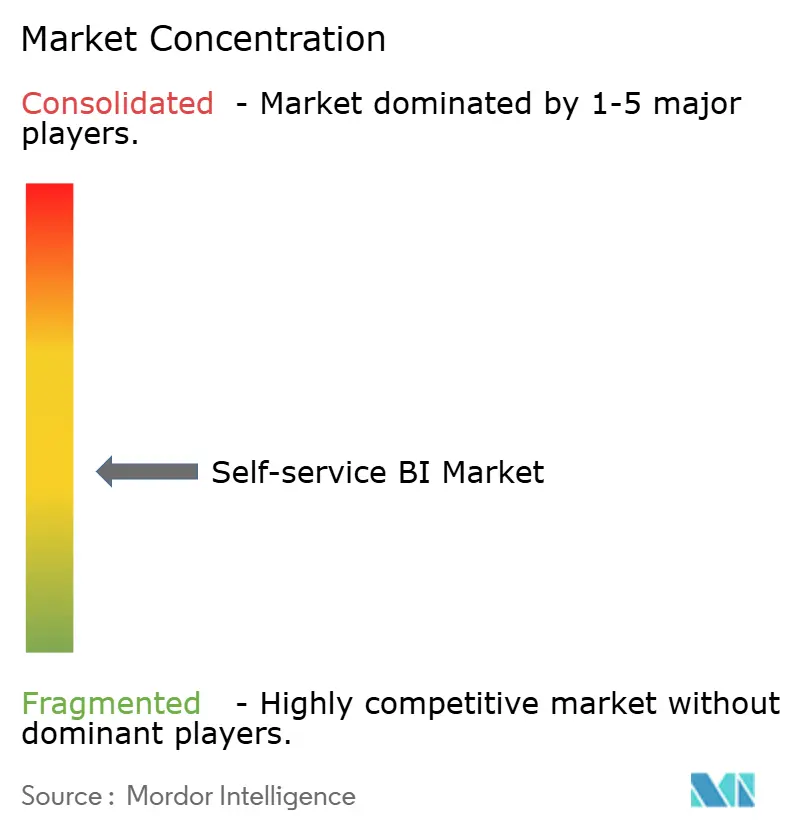
| Market Concentration | Medium |
Major Players *Disclaimer: Major Players sorted in no particular order Image © Mordor Intelligence. Reuse requires attribution under CC BY 4.0. | |
Self-service BI Market Analysis by Mordor Intelligence
The self-service BI market size is expected to grow from USD 7.10 billion in 2025 to USD 7.91 billion in 2026 and is forecast to reach USD 13.59 billion by 2031 at 11.41% CAGR over 2026-2031. Firms are scaling low-code analytics, embedding generative AI, and shifting workloads to cloud data warehouses, which shortens insight cycles and frees IT staff for strategic work. North American organizations lead adoption after proving that intuitive tools can cut reporting backlogs by roughly one-third, while Asia-Pacific businesses are catching up fast as cloud infrastructure matures. Vendors are racing to integrate natural-language querying that supports multilingual environments, a capability already boosting engagement among European users. Meanwhile, heightened attention to governance, driven by regulatory pressure and shadow-IT incidents, is steering purchasing toward platforms that pair open architectures with automated control features. [1]Mallikarjun Bussa, “Emerging Trends in Self-Service BI Platforms: Democratizing Data Insights,” International Journal of Scientific Research in Computer Science Engineering and Information Technology, doi.org
Key Report Takeaways
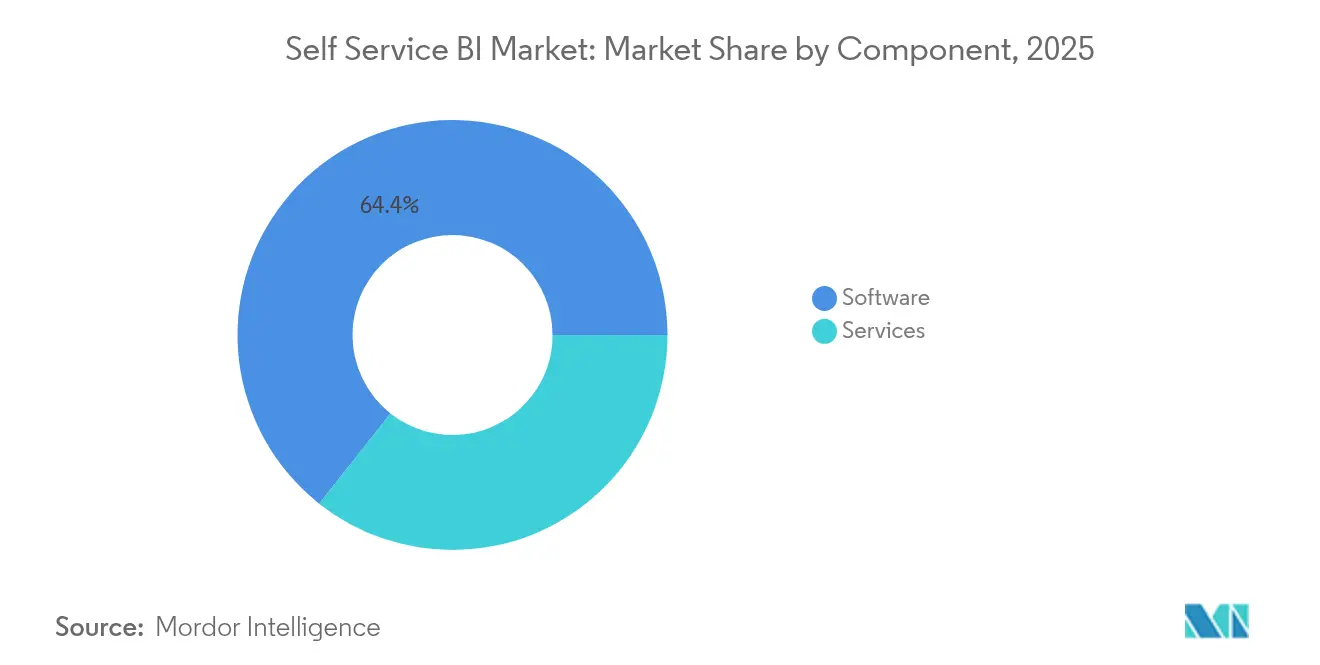
- By component, Software captured 64.35% of the self-service BI market share in 2025; the Services segment is advancing at a 14.92% CAGR to 2031.
- By deployment model, Cloud/On-Demand accounted for 72.40% of the self-service BI market size in 2025 and is growing at a 13.24% CAGR.
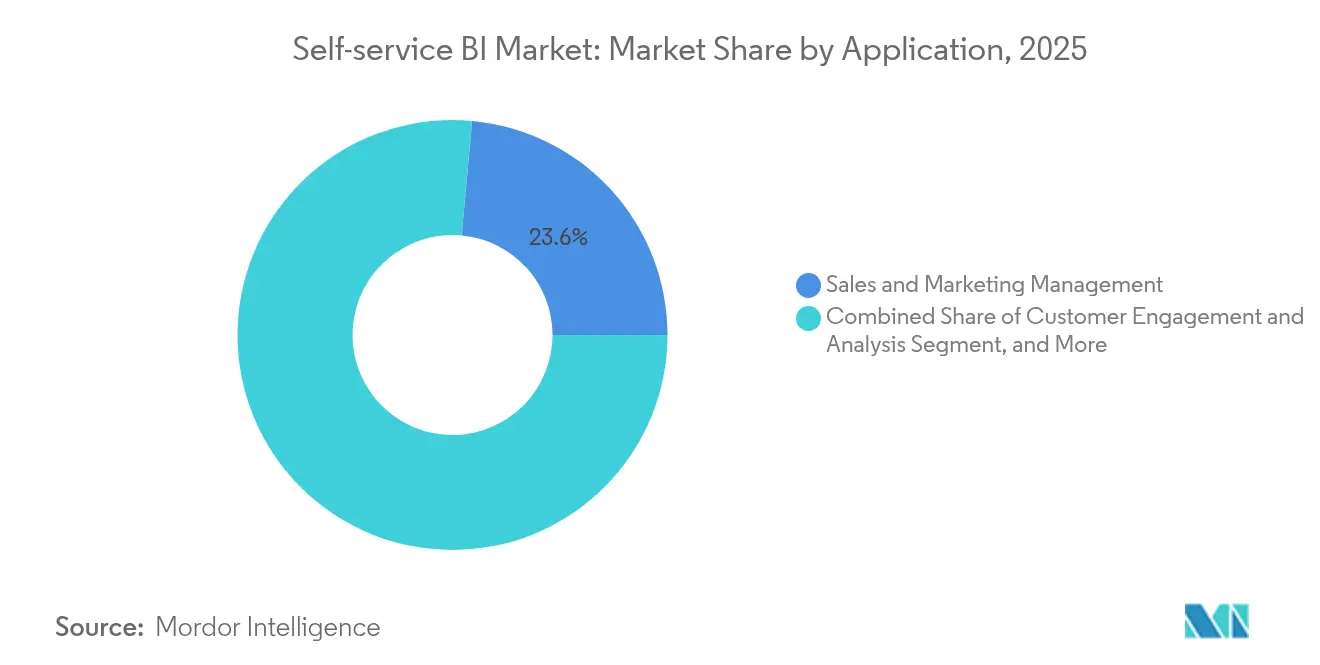
- By application, Sales & Marketing held 23.55% revenue share in 2025; Customer Engagement analytics is expanding at a 15.76% CAGR through 2031.
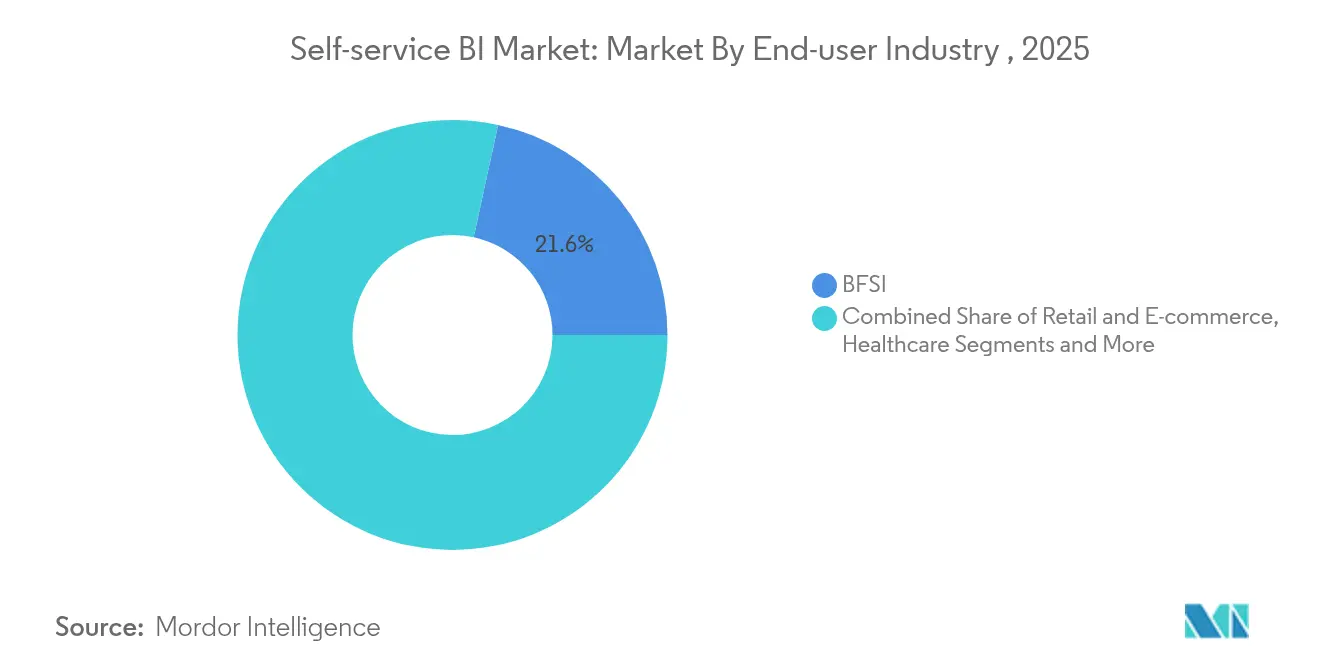
- By end-user industry, BFSI led with 21.60% of the self-service BI market size in 2025, while Healthcare is projected to expand at a 13.92% CAGR.
- By organization size, Large Enterprises commanded 67.25% of the self-service BI market share in 2025; Asia-Pacific is projected to grow at a 13.50% CAGR.
- By geography, North America commanded 41.50% of the self-service BI market share in 2025; SMEs are projected to grow at a 14.78% CAGR.
Note: Market size and forecast figures in this report are generated using Mordor Intelligence’s proprietary estimation framework, updated with the latest available data and insights as of 2026.
Global Self-service BI Market Trends and Insights
Drivers Impact Analysis*
| Driver | (~) % Impact on CAGR Forecast | Geographic Relevance | Impact Timeline |
|---|---|---|---|
| Democratization of Analytics via Low-code/No-code Tools | +3.2% | North America, Europe | Medium term (2-4 years) |
| Surge in Cloud-based Data Warehouses Accelerating Self-service Adoption | +2.7% | Asia-Pacific, North America | Short term (≤ 2 years) |
| Integration of Generative AI for Natural-Language Querying | +2.5% | Europe, North America | Medium term (2-4 years) |
| Embedded Analytics Demand from SaaS Vendors | +1.4% | Global | Medium term (2-4 years) |
| Rising Data-Literacy Programs Among Mid-Sized Enterprises | +1.1% | Global | Long term (≥ 4 years) |
| Regulatory Push for Data-Residency Compliance Driving Localized BI Platforms | +0.5% | Middle East & Africa | Medium term (2-4 years) |
| Source: Mordor Intelligence | |||
Democratization of analytics via low-code/no-code tools
Low-code interfaces let business professionals create dashboards without relying on developers, a shift most visible in North America where 80% of executives credit wider data access for faster decisions. Productivity for analytical tasks has risen 74% as citizen data scientists pair domain knowledge with simplified tooling, unearthing patterns traditional BI teams often overlook. Companies that married democratization with robust semantic layers cut backlog hand-offs and delivered insight within the operational window where actions still matter. This cultural change is expanding platform evaluation criteria from feature depth to the ease of onboarding non-technical staff, driving platform consolidation around intuitive drag-and-drop authoring and in-app guidance.
Surge in cloud-based data warehouses accelerating self-service adoption
Asia-Pacific organizations are leapfrogging legacy stacks by landing data in the cloud, eliminating bottlenecks that once restricted BI concurrency. With the cloud warehouse segment itself climbing at 27.64% CAGR, analytics teams now query fresh data without queuing jobs, shrinking report time by as much as 40%. Firms that align self-service rollouts with warehouse modernization gain triple-speed time-to-insight compared with siloed deployments. Centralized governance baked into these warehouses also raises data quality, enabling consistent metrics across departments. [2]Firebolt, “Cloud Data Warehouse Key Statistics & Industry Trends,” firebolt.io
Integration of generative AI for natural-language querying
Natural language search has become the final catalyst for truly self-served analytics. European organizations, long challenged by multilingual user bases, now see 50% more non-technical engagement after rolling out LLM-powered interfaces. Large language models turn conversational prompts into optimized SQL, then surface narrative explanations of trends, which shifts the perception of BI from a visualizer to an active advisor. Vendors highlight this capability as table stakes: buyers increasingly rank NLQ responsiveness above chart variety when scoring RFPs.
Embedded analytics demand from SaaS vendors
BFSI and retail software providers embed self-service dashboards directly into operational apps, which eliminates context-switching and drives a documented 35% lift in customer satisfaction. API-first BI platforms that allow white-label customization are therefore growing wallet share inside SaaS ecosystems. As this model matures, the distinction between transactional and analytical systems blurs, locking BI providers into long-term contracts and raising switching costs for end customers.
Restraints Impact Analysis*
| Restraint | (~) % Impact on CAGR Forecast | Geographic Relevance | Impact Timeline |
|---|---|---|---|
| Shadow-IT Risks from Uncontrolled Data Visualization Tools | -1.2% | Global | Short term (≤ 2 years) |
| Shortage of Data Governance Talent in Emerging Economies | -0.9% | Asia-Pacific, Middle East & Africa | Medium term (2-4 years) |
| High Migration Cost from Legacy BI to Self-service Stacks | -0.8% | North America, Europe | Short term (≤ 2 years) |
| Vendor Lock-in Concerns with Proprietary Semantic Layers | -0.6% | Global | Long term (≥ 4 years) |
| Source: Mordor Intelligence | |||
Shadow-IT risks from uncontrolled visualization tools
Unvetted tool adoption has generated conflicting KPIs and exposed sensitive datasets, costing non-compliant firms USD 1.03 million on average per incident. Marketing and finance units are frequent offenders because rapid iterations tempt them to sidestep IT. Best-in-class enterprises deploy catalog-driven governance, automated lineage, and role-based access that preserve agility yet curb risk, yielding 45% higher adoption than blanket lockdown approaches.
Shortage of data-governance talent in emerging economies
Emerging markets face acute hiring gaps, with 57% of CIOs naming governance expertise their top AI-analytics bottleneck. Vendors that bundle automated policy enforcement and role-specific training gain a foothold by offsetting the skills deficit. Companies rolling out self-service BI in phased sprints—first standardizing metadata, then widening access—create durable data cultures while managing resource constraints.
*Our forecasts treat driver/restraint impacts as directional, not additive. The impact forecasts reflect baseline growth, mix effects, and variable interactions.
Segment Analysis
By Component: Advisory services narrow the adoption gap
The software segment continues to anchor revenue, yet services revenue is compounding faster at 14.92% CAGR. Organizations that pair platform purchases with training programs report adoption rates 45% higher than tool-only buyers. Demand is shifting toward continuous enablement subscriptions that cover data-literacy upskilling and governance audits. As a result, implementation specialists are packaging industry-specific playbooks, aligning dashboards with vertical KPIs, and expediting time-to-value. The self-service BI market size for services is projected to reach USD 5.83 billion by 2031, reflecting sustained appetite for human expertise alongside automation.
Software vendors, meanwhile, prioritize AI feature parity, adding NLQ, automated insights, and embedded modes to remain competitive. The relentless update cadence pushes enterprises to favor modular architectures that let them swap analytic engines without ripping out semantic layers. This posture mitigates vendor lock-in concerns and supports mixed-tool environments that evolve as AI capabilities mature.


By Deployment Model: Cloud preference becomes irreversible
Cloud deployments own both usage and momentum, commanding 72.40% of current revenue and adding users at a 13.24% CAGR. Economies of scale let mid-market firms implement enterprise-grade analytics without capital outlay, leveling the playing field with larger peers. Moreover, distributed teams can collaborate on shared workspaces in real time, accelerating feedback loops. Security postures have evolved; encryption-at-rest, private links, and regional data centers now satisfy most regulatory audits, tempering earlier reservations about public cloud.
On-premises solutions persist in heavily regulated verticals where data residency is mandatory. Yet even there, hybrid designs are common: sensitive tables stay onsite while aggregated models sync to the cloud for broad exploration. Over the forecast period, the self-service BI market share for cloud is expected to edge past 80.85% as hyperscalers integrate BI tightly with their storage and AI services.
By Application: Customer engagement analytics outpaces traditional reporting
Customer Engagement & Analysis is the fastest mover with a 15.76% CAGR, reflecting the shift from descriptive to predictive insight. Retailers and subscription businesses mine behavioral data to pre-empt churn and personalize offers, improving retention metrics by double digits. Generative models further enhance this segment by auto-summarizing sentiment from call transcripts and social mentions, bringing unstructured data into the analytics fold.
Sales & Marketing remains the biggest slice at 23.55% of 2025 revenue. Dashboards tracking funnel velocity, campaign ROI, and territory alignment remain foundational. Emerging use cases extend into cross-sell propensity scoring and ABM targeting, enriching account views for go-to-market teams. As embedded analytics spreads, front-line sellers gain direct access to these insights inside CRM systems, closing the gap between analysis and action.
By End-user Industry: Healthcare narrows the lead
BFSI still contributes the largest spend, driven by risk models, fraud analytics, and regulatory reporting. Yet Healthcare is growing faster at 13.92% CAGR as electronic health records and value-based care push providers toward data-driven operations. Hospitals deploying self-service scheduling tools cut appointment cancellations by 40%, freeing clinical capacity and improving outcomes. Insurance payers are merging claims and wearable-device streams to personalize wellness programs, underscoring how healthcare data variety fuels BI demand.
Manufacturing is exploiting predictive maintenance dashboards that harvest sensor output to avoid unplanned downtime, while Telecommunications leverages network analytics to enhance customer experience. Government agencies, though slower to procure, recognize BI as central to transparency mandates and stimulus program tracking, positioning the sector for steady expansion after 2026.
By Organization Size: SMEs become the growth engine
Large Enterprises held 67.25% revenue in 2025 thanks to mature data estates and larger budgets. The growth spotlight now shifts to SMEs, whose 14.78% CAGR exceeds the overall self-service BI market growth by more than three points. Subscription-based pricing, low administration overhead, and verticalized templates de-risk adoption for lean teams. SMEs using self-service dashboards report 30% better performance metrics once reliance on spreadsheet reporting fades.
Vendors courting this segment tailor onboarding to non-specialists and bundle bite-size learning paths. Community-led support, marketplace connectors, and pay-as-you-grow licensing form the core of SME-oriented value propositions. Over the forecast horizon, wider SME penetration will broaden the self-service BI industry’s customer base and diversify feature roadmaps toward simplicity and speed.
Geography Analysis
North America retains 41.50% of self-service BI market revenue, buoyed by early adoption of low-code platforms and the presence of leading vendors. Financial services and healthcare providers there embed natural-language querying in day-to-day workflows, keeping user sentiment high and shadow-IT incidents under control through mature governance programs. R&D investments focus on advanced AI explainability, preparing systems to justify recommendations in regulated settings. Cross-border data-sharing rules remain a watchpoint, yet the region’s sophisticated cloud infrastructure continues to attract innovative analytics startups that expand platform ecosystems.
Asia-Pacific is the fastest growing territory, advancing at a 13.50% CAGR. China, India, Japan, and Australia demonstrate vigorous demand as domestic cloud giants and hyperscalers alike pour capital into data centers. SMEs in the region use mobile-first analytics to overcome desktop scarcity, with smartphone dashboards becoming the primary interface for many field employees. Talent shortages in data governance persist, prompting governments and academia to launch certification programs that should ease constraints after 2027. Manufacturing adoption is strong in Japan and South Korea, where predictive maintenance aligns with Industry 4.0 roadmaps, while financial hubs like Singapore emphasize customer analytics to differentiate regional banking services.
Europe shows steady uptake shaped by strict privacy statutes. Organizations balance democratization with GDPR compliance by opting for platforms that support fine-grained consent management and local data processing. Multilingual natural-language interfaces are especially valued, lifting engagement among non-technical staff by 50% in pilot projects. Western European cloud migration is accelerating after regulators clarified that encryption and local failover meet sovereignty requirements. Eastern Europe is catching up quickly as digital transformation funding flows into Poland, Romania, and the Czech Republic. Retail and discrete manufacturing dominate demand, though open-source alternatives gain traction in institutions wary of proprietary lock-in.
South America, the Middle East, and Africa remain early-stage yet promising. Brazil and Mexico head Latin American adoption, with telecom operators and banks seeking real-time customer views. Gulf Cooperation Council governments anchor investment in the Middle East, leveraging BI to support diversification agendas and smart-city initiatives. African uptake is fragmented; South Africa leads enterprise deployments, while Nigeria and Kenya show momentum through fintech ecosystems. Across these regions, cloud solutions enjoy preference owing to limited legacy estates, and mobile dashboards bridge infrastructure gaps in areas where desktop penetration is low.

Competitive Landscape
The self-service BI market displays moderate concentration. Microsoft Power BI, Salesforce Tableau, and Qlik retain lead positions due to embedded ecosystems and broad partner networks. Microsoft deepened its advantage by integrating GPT-4-Turbo for conversational analytics that shortens query build time dramatically. Tableau enhanced embedded options through new APIs, appealing to SaaS providers that view analytics as core product differentiators. Qlik invested in a lakehouse architecture on Apache Iceberg, signaling a pivot toward unified data management.
Cloud hyperscalers intensify competition. Google couples Looker with Vertex AI to deliver customizable AI insight tiles, while Amazon QuickSight leverages native data lake integration for cost-aware scaling. Specialist vendors ThoughtSpot and Sisense carve niches in search-based UX and white-label embedded BI, respectively. Open-source platforms gain mindshare among buyers wary of proprietary semantic layers that complicate multi-cloud strategies.
Strategic alliances and M&A shape the battlefield. BI vendors partner with data-catalog providers to fuse discovery and governance, while service integrators acquire niche consultancies to offer end-to-end modernization packages. Competitive success hinges less on charting features and more on ecosystem extensibility, AI breadth, and governance automation.
Self-service BI Industry Leaders
Microsoft Corporation
IBM
Oracle Corporation
SAP SE
SAS Institute
- *Disclaimer: Major Players sorted in no particular order

Recent Industry Developments
- May 2025: Qlik introduced a lakehouse built on Apache Iceberg that unifies structured and unstructured data analysis
- April 2025: Microsoft added GPT-4-Turbo NLQ and enhanced governance to Power BI
- March 2025: Google Cloud linked Looker with Vertex AI for advanced NL-powered visualizations
- February 2025: Salesforce expanded Tableau APIs for richer embedded analytics


Research Methodology Framework and Report Scope
Market Definitions and Key Coverage
Mordor Intelligence defines the self-service business intelligence market as the global revenues generated from purpose-built software platforms and related subscription or professional services that let non-technical employees prepare data, run queries, build visual dashboards, and share insights without coding or constant IT support. Products covered range from cloud-native suites to on-premise licenses that embed data preparation, visualization, and ad-hoc analytics in one interface.
Scope Exclusions: Purely managed analytics outsourcing contracts, traditional enterprise reporting tools lacking self-service functionality, and generic spreadsheet or database software are not included.
Segmentation Overview
- By Component
- Software
- Services
- By Deployment Model
- Cloud / On-Demand
- On-Premises
- By Application
- Sales and Marketing Management
- Customer Engagement and Analysis
- Fraud and Security Management
- Predictive Asset Maintenance
- Risk and Compliance Management
- Supply Chain and Procurement
- Operations Management
- By End-user Industry
- BFSI
- Retail and E-commerce
- Healthcare
- Manufacturing
- Telecommunications
- Media and Entertainment
- Transportation and Logistics
- Energy and Utilities
- Government and Defense
- By Organization Size
- Large Enterprises
- Small and Medium-sized Enterprises (SMEs)
- By Geography
- North America
- United States
- Canada
- Mexico
- South America
- Brazil
- Argentina
- Rest of South America
- Europe
- Germany
- United Kingdom
- France
- Italy
- Spain
- Rest of Europe
- Asia-Pacific
- China
- Japan
- South Korea
- India
- Rest of Asia-Pacific
- Middle East and Africa
- United Arab Emirates
- Saudi Arabia
- South Africa
- Rest of Middle East and Africa
- North America
Detailed Research Methodology and Data Validation
Primary Research
Mordor's team interviewed product managers at leading BI vendors, chief data officers in banking, retail, and healthcare, plus regional channel partners across North America, Europe, and Asia-Pacific. Discussions clarified average selling prices, typical user-per-license ratios, emerging AI add-ons, and barriers that slow seat expansion, allowing us to refine desk-based assumptions.
Desk Research
Our analysts began with public datasets such as U.S. Census ICT spending tables, Eurostat cloud adoption surveys, and OECD enterprise software price indices to ground uptake volumes and seat prices. Trade associations, including the Data & Analytics Association of America and the European Software Alliance, offered shipment trends and membership counts, while patent statistics from Questel signaled the pace of product innovation. Company 10-Ks, investor decks, and technology press releases then revealed vendor revenue splits between license, SaaS, and services lines. Paid sources like D&B Hoovers and Dow Jones Factiva assisted in verifying firm-level numbers. The sources listed are illustrative; many additional repositories supported fact finding and cross-checks.
Market-Sizing & Forecasting
A top-down build started with worldwide enterprise application software expenditure, which was then filtered through indicators such as self-service penetration rates by company size, cloud workload migration ratios, average seat counts per employee, and prevailing license or subscription prices. Select bottom-up checks, sampling public vendor revenues, partner channel data, and end-user adoption surveys, calibrated totals and adjusted for double counting. Forecasts to 2030 rely on multivariate regression that links seats and spend to predictors like public-cloud outlay, SME digitalization rates, data-literacy training budgets, macro GDP growth, and data-privacy regulation milestones. Where bottom-up inputs were sparse, modeled ranges were constrained to historical vendor guidance to avoid over-projection.
Data Validation & Update Cycle
Outputs pass anomaly scans, peer review, and variance reconciliation against external benchmarks before sign-off. The study refreshes every twelve months, with interim updates triggered by material events, large acquisitions, pricing shifts, or regulatory changes, so clients receive an up-to-date viewpoint.
Why Our Self-service BI Baseline Is Trusted
Published figures often diverge because firms differ on what counts as "self-service," whether services revenues are rolled in, and how aggressively future cloud migration is assumed.
Key gap drivers include: some publishers limit scope to software only; others fold broader self-service analytics or embedded BI into totals; a few apply aggressive double-digit price escalation without validating with seat expansion evidence; refresh cycles also vary.
Benchmark comparison
| Market Size | Anonymized source | Primary gap driver |
|---|---|---|
| USD 7.10 B (2025) | Mordor Intelligence | |
| USD 6.73 B (2024) | Global Consultancy A | Counts software only, omits professional services and smaller regional vendors |
| USD 10.66 B (2024) | Industry Association B | Blends self-service BI with wider self-service analytics and legacy reporting tools |
| USD 9.00 B (2024) | Regional Consultancy C | Applies uniform 15 % price growth and single-region interviews, limiting global representativeness |
The comparison shows that Mordor's balanced scope, mixed-method model, and annual refresh cadence deliver a dependable baseline grounded in transparent variables that decision-makers can easily trace and replicate.


Key Questions Answered in the Report
What is the current Self-service BI Market size?
The Self-service BI Market is projected to register a CAGR of 11.41% during the forecast period (2026-2031)
What is the current self-service BI market size?
The self-service BI market is valued at USD 7.91 billion in 2026.
How fast is the self-service BI market expected to grow?
The market is projected to expand at an 11.41% CAGR, reaching USD 13.59 billion by 2031.
Which deployment model is gaining the most traction?
Cloud/On-Demand deployment leads with 72.40% revenue share and is growing at a 13.24% CAGR as firms favor scalability and lower maintenance.
Which application segment is the fastest growing?
Customer Engagement & Analysis is advancing at a 15.76% CAGR due to rising demand for personalized customer insights.
Why are SMEs increasingly adopting self-service BI?
Subscription pricing, ease of use, and vertical templates enable SMEs to capture data-driven advantages once limited to large enterprises, driving a 14.78% CAGR in the segment.
What are the primary challenges to wider self-service BI adoption?
Shadow-IT risks and a global shortage of data governance talent remain the key hurdles; organizations counter them with stronger governance frameworks and targeted training.
Page last updated on:


