Market Overview
| Study Period | 2020 - 2031 |
|---|---|
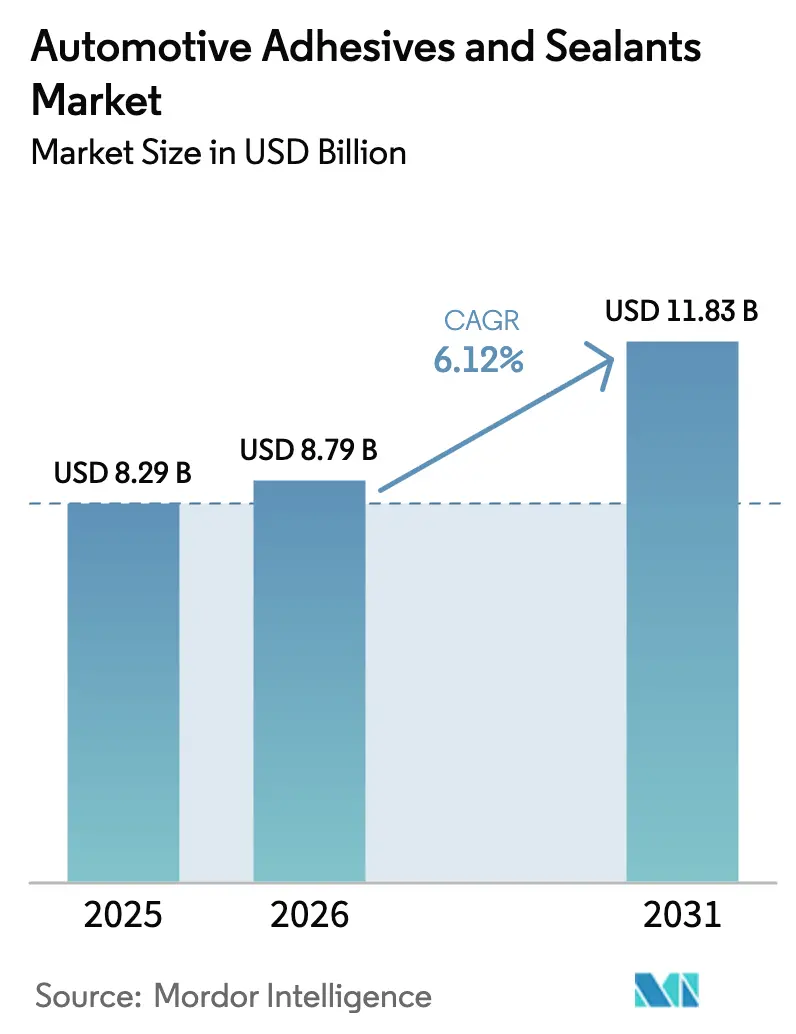
| Market Size (2026) | USD 8.79 Billion |
| Market Size (2031) | USD 11.83 Billion |
| Growth Rate (2026 - 2031) | 6.12% CAGR |
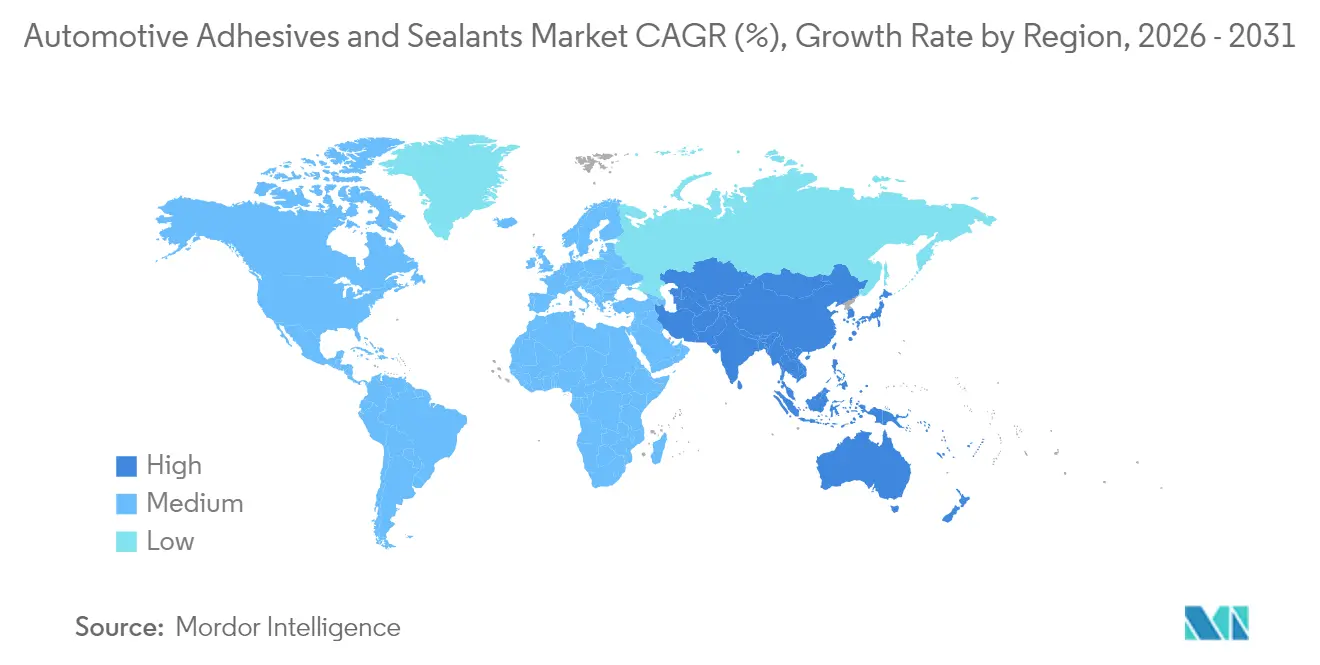
| Fastest Growing Market | Asia Pacific |
| Largest Market | Asia-Pacific |
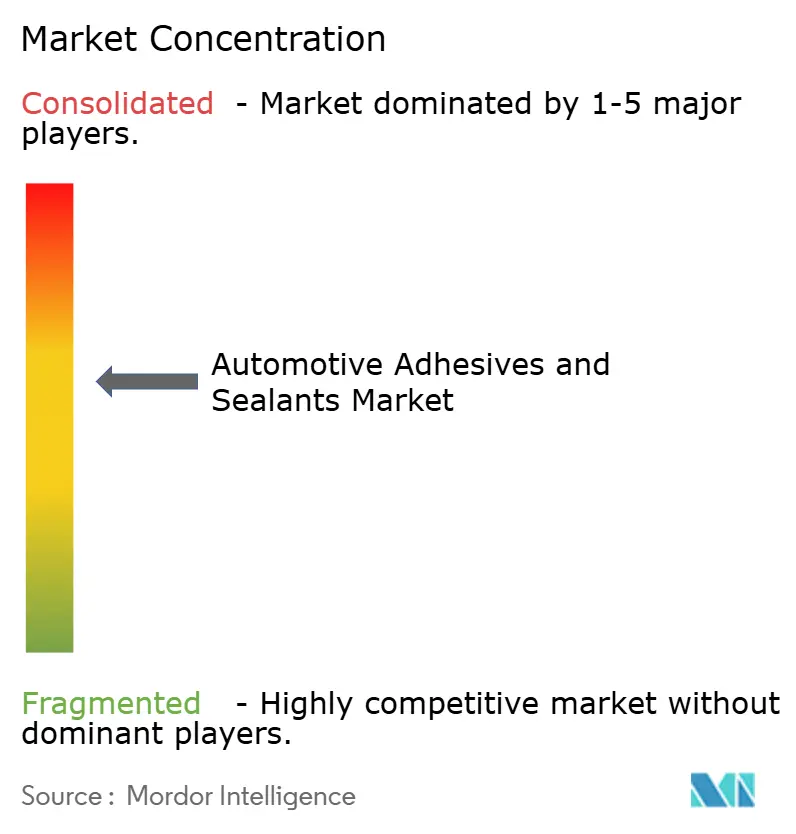
| Market Concentration | Medium |
Major Players *Disclaimer: Major Players sorted in no particular order Image © Mordor Intelligence. Reuse requires attribution under CC BY 4.0. | |
Automotive Adhesives And Sealants Market Analysis by Mordor Intelligence
Automotive Adhesives and Sealants market size in 2026 is estimated at USD 8.79 billion, growing from 2025 value of USD 8.29 billion with 2031 projections showing USD 11.83 billion, growing at 6.12% CAGR over 2026-2031. Ongoing electrification programs, rising lightweighting mandates, and the move toward multi-material car bodies underpin volume growth. Demand for IP68-grade battery protection is shifting bonding specifications away from mechanical fasteners to high-performance chemistries, while shorter takt times in vehicle plants encourage faster-curing technologies. The global expansion of electric vehicle (EV) output, especially across Asia-Pacific, widens the customer base, and regulatory initiatives that cap solvent emissions are accelerating the adoption of water-borne or reactive hot-melt products. Consolidation among chemical majors continues, yet smaller innovators that specialize in UV or debond-on-demand systems are carving out premium niches.
Key Report Takeaways
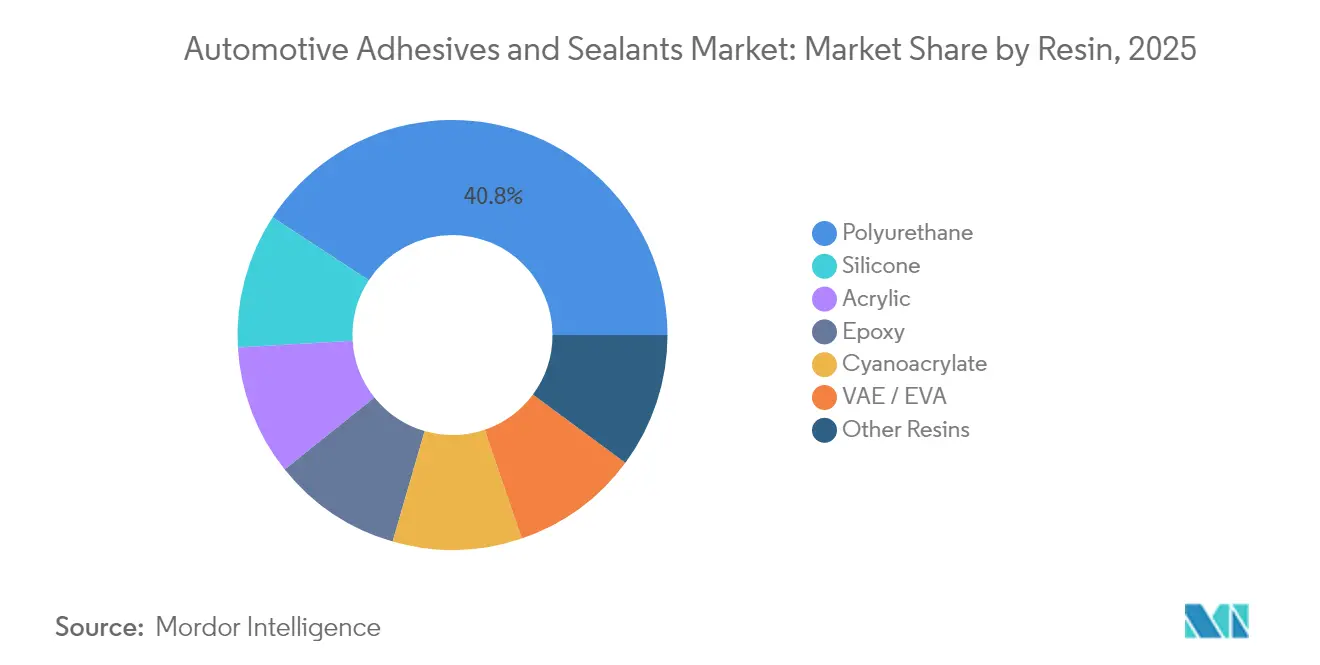
- By resin, polyurethane led with 40.78% of the automotive adhesives and sealants market share in 2025; silicone is projected to advance at a 6.68% CAGR through 2031.
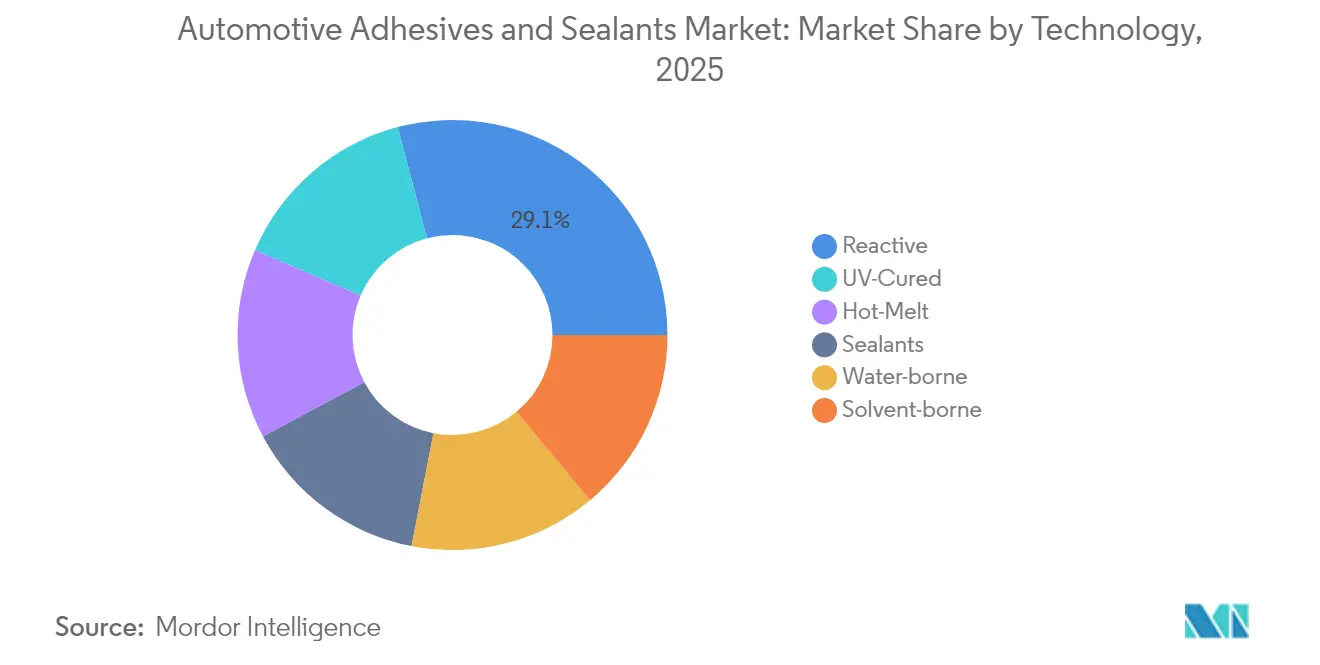
- By technology, reactive held 29.10% of the automotive adhesives and sealants market size in 2025, while UV-cured is set to expand at a 7.02% CAGR to 2031.
- By geography, Asia-Pacific commanded 37.08% of revenue in 2025 and is forecast to rise at a 6.95% CAGR to 2031.
Note: Market size and forecast figures in this report are generated using Mordor Intelligence’s proprietary estimation framework, updated with the latest available data and insights as of 2026.
Global Automotive Adhesives And Sealants Market Trends and Insights
Drivers Impact Analysis*
| Driver | (~) % Impact on CAGR Forecast | Geographic Relevance | Impact Timeline |
|---|---|---|---|
| Growing Demand for Lightweighting and Fuel-Efficiency | +1.8% | Global, with APAC and Europe leading adoption | Medium term (2-4 years) |
| Surge in EV Production and Battery Sealing Needs | +1.2% | APAC core, spill-over to North America and Europe | Short term (≤ 2 years) |
| Increased Adoption of Multi-Material Bodies | +0.9% | North America and EU premium segments, expanding to APAC | Medium term (2-4 years) |
| Shift to Bio-Based Chemistries for VOC/REACH Compliance | +0.7% | Europe primary, North America secondary | Long term (≥ 4 years) |
| IP68-Grade Battery Enclosure Sealing Requirements | +0.6% | Global EV manufacturing hubs | Short term (≤ 2 years) |
| Source: Mordor Intelligence | |||


Growing demand for lightweighting and fuel efficiency
Corporate fuel-economy targets now push automakers to swap overlap joints and rivets for structural adhesives that trim curb weight. Ford cut roughly 317 kg from the aluminum F-150 body using two-part epoxy bonds that spread loads over wider areas, enabling thinner panels and stronger crash zones. Carbon-fiber composites, once limited to aviation, offer further mass savings, though automotive budgets call for lower-temperature cure routes. Life-cycle assessments under ISO 14040 increasingly favor adhesive bonding over welds because curing ovens draw less power than resistance-spot welding cells. Fleet electrification magnifies these benefits as every kilogram saved translates into longer driving range.
Surge in EV production and battery sealing needs
Battery packs must keep water out while managing heat from -40 °C to 85 °C. Tesla’s 4680 cells prompted the use of silicone adhesives with 3 W/m·K thermal conductivity to form gap fillers that dissipate heat evenly[1]Tesla Inc., “4680 Cell Thermal Management,” tesla.com . Chinese cell maker CATL integrates modules directly into the pack, eliminating metal frames and raising adhesive volumes by up to 15% per vehicle. Immersion-cooling designs ask the bond to withstand direct electrolyte contact, and Europe’s end-of-life rules push for reversible chemistries that allow safe dismantling.
Increased adoption of multi-material bodies
Bonding aluminum, steel, and carbon-fiber panels sidesteps galvanic corrosion issues and accommodates mismatched thermal expansion. BMW pioneered carbon-fiber-reinforced plastic to aluminum joints on the i3, held together by acrylate adhesives formulated for flexible failure modes that protect passengers during impact. These hybrid structures cut weight without sacrificing rigidity, yet they demand adhesives that cure fast on mixed substrates and stay elastic over a wide temperature span.
Shift to bio-based chemistries for VOC/REACH compliance
The European Union now limits free formaldehyde to below 0.1 wt %, forcing suppliers to retool urea-formaldehyde blends. Henkel’s bio-based Loctite grades, derived from plant oils, pass automotive shear tests while slashing carbon footprints. Soy-based polyols are gaining, but ultraviolet stability still trails petroleum analogs, prolonging qualification. California’s South Coast Air Quality rules and the EU’s sustainable-finance taxonomy reinforce buyer preference for renewable feedstocks, even when cure times rise.
Restraints Impact Analysis*
| Restraint | (~) % Impact on CAGR Forecast | Geographic Relevance | Impact Timeline |
|---|---|---|---|
| Volatile Raw-Material Prices (Isocyanates, Epoxies) | -0.8% | Global, with APAC manufacturing most affected | Short term (≤ 2 years) |
| Stringent Solvent-Emission Regulations | -0.5% | Europe and North America primary impact | Medium term (2-4 years) |
| Right-To-Repair Legislation Curbing Permanent Bonding | -0.4% | Europe and North America, expanding globally | Long term (≥ 4 years) |
| Source: Mordor Intelligence | |||
Volatile raw-material prices (isocyanates and epoxies)
Methylene diphenyl diisocyanate (MDI) spot prices swung 40% during 2024 after unplanned outages in China, squeezing margins for polyurethane producers. Epoxy costs track propylene oxide volatility, and OEM contracts rarely permit mid-term price passes, compelling formulators to absorb spikes. Re-formulating around costlier inputs can delay product releases by up to 12 months because fresh bonds must clear crash, peel, and paint-shop tests.
Stringent solvent-emission regulations
California limits assembly-plant coatings to under 250 g/L VOC, encouraging water-borne or reactive hot-melt alternatives. These chemistries need extra surface prep and longer cure stages, raising line-time expenses for smaller tier suppliers. In Europe, REACH restrictions on specific solvents further pressure solvent-borne products, making low-emission formulations a licensing requirement.
*Our forecasts treat driver/restraint impacts as directional, not additive. The impact forecasts reflect baseline growth, mix effects, and variable interactions.
Segment Analysis
By Resin – Polyurethane leadership with silicone closing the gap
Polyurethane retained 40.78% of the automotive adhesives and sealants market share in 2025 thanks to broad usability across structures, glass bonding, and NVH damping. The segment benefits from two-part variants that reach 25 MPa tensile strength yet stay ductile during crashes. Suppliers such as Sika present crash-toughened grades that bond steel to aluminum without pre-heat, reducing energy demand on paint lines. Epoxy remains vital in engine bays, but its inherent brittleness restricts full-body use, while acrylics deliver quicker room-temperature cures for trim mounts. The silicone subset, forecast to grow 6.68% annually, answers EV battery demands for thermal stability from -40 °C to 150 °C and dielectric properties above 1,000 V.
Silicone uptake accelerates as cell-to-pack designs remove module casings, forcing a direct adhesive interface with coolants. Dow’s silicone gap fillers maintain viscosity after 3,000 charge cycles, giving OEMs confidence in pack warranties. Vinyl acetate ethylene (VAE) and ethylene-vinyl acetate (EVA) stay relevant in low-stress cabin fixtures where price outweighs heat performance. Hybrid chemistries that merge polyurethane backbones with silicone side chains aim to blend structural strength with high-temperature resilience, supporting future battery architectures.


By Technology – Reactive systems remain dominant as UV-cure surges
Reactive held 29.10% of the automotive adhesives and sealants market size in 2025. Their one-component design simplifies dispensing and eliminates solvent emissions. Moisture-curing hot melts, for instance, provide 30-second open times, enabling continuous flow processes without mixing errors. Hot-melts offer zero VOCs but can soften beyond 90 °C, limiting under-hood use. UV-cured platforms, advancing at 7.02% CAGR, finish within seconds under light, shrinking takt times for camera modules and sensor housings. DELO’s UV systems allow in-line quality checks via fluorescence, reducing rework. Water-borne dispersions comply with strict VOC statutes, yet extra moisture must evaporate, prolonging furnace cycles.
Emerging dual-cure options blend UV kick-off with secondary moisture or thermal set to ensure deep-section curing. Solvent-borne epoxies still serve body-shop areas where ultimate heat resistance tops 200 °C, but environmental levies speed their phase-down. Plant retrofits favor technologies that slot into existing robots, so suppliers tout cartridges that fit legacy gear while swapping to greener chemistries.
Geography Analysis
Asia-Pacific accounted for 37.08% of revenue in 2025 and is forecast to rise at a 6.95% CAGR to 2031 as China and India push EV capacities upward. China sold 9.5 million new-energy vehicles in 2024, creating record demand for battery-pack sealants and thermally conductive gap fillers. BYD’s blade battery employs thermally conductive silicone to sustain 3,000 charge cycles, further promoting the resin family. India’s incentives for domestic cell manufacture spur fresh orders for polyurethane structural grades that bond aluminum frames in upcoming SUV programs.
North America benefits from USD 100 billion in pledged EV investments by Ford, GM, and Tesla, yet differing state regulations and slower charging-infrastructure rollout temper overall growth versus Asia. Ford’s all-electric Lightning pickup showcases two-part epoxies that join its aluminum body in white while preserving crash performance. Mexico’s cost-competitive plants add regional volumes, and USMCA rules motivate OEMs to source adhesives locally.
Europe remains technology oriented, focusing on bio-based formulations to comply with REACH and carbon-neutral targets. Germany’s premium brands demand higher shear and peel thresholds, encouraging suppliers to propose hybrid polyurethane grades that match aluminum forming speeds. The continent’s lower vehicle output growth versus Asia keeps volume expansion moderate, yet its stringent solvent caps create opportunities for water-borne and hot-melt lines. Eastern Europe offers greenfield capacity for both cars and adhesive production, giving global suppliers room to expand.

Competitive Landscape
The automotive adhesives and sealants market shows moderate consolidation. Henkel’s USD 1.35 billion purchase of Adhesive Research strengthens vertical integration in specialty tapes relevant for battery assemblies[2]Henkel AG, “Acquisition of Adhesive Research,” henkel.com . 3M, BASF, and Sika rely on broad patent estates and global supply footprints to maintain bargaining power with OEMs. Nevertheless, specialty players such as DELO win high-margin contracts for UV-cured products installed on camera modules, lidar housings, and infotainment screens. Evonik’s VESTALITE debond-on-demand system illustrates emerging niches where reversible bonding meets recycling directives.
Strategic moves focus on capacity additions close to EV hubs. H.B. Fuller expanded Chinese output for reactive pur adhesives to shorten lead times and hedge shipping risk. Sika acquired MBCC’s admixture unit, also picking up automotive-grade tech assets that complement crash-toughened lines. OEMs increasingly expect suppliers to deliver not only chemistry but also application equipment and in-process monitoring, pushing adhesive companies to partner with robot-integrators and vision-system vendors. Compliance with ISO 9001 and ISO 14001 is now an entry ticket rather than a differentiator.
Automotive Adhesives And Sealants Industry Leaders
3M
H.B. Fuller Company
Henkel AG & Co. KGaA
Sika AG
Arkema
- *Disclaimer: Major Players sorted in no particular order

Recent Industry Developments
- July 2025: Henkel Adhesive Technologies India, a Henkel AG & Co. KGaA subsidiary, opened a new automotive warehouse in Chakan, Pune. The facility enhances Just-in-Time (JIT) deliveries and supports the region's manufacturing sector growth through 2030 and beyond.
- April 2025: PPG Industries acquired Revocoat from the Axson Group to expand its automotive adhesive and sealant offerings. Revocoat operates eight manufacturing facilities and an R&D center globally.


Global Automotive Adhesives And Sealants Market Report Scope
Acrylic, Cyanoacrylate, Epoxy, Polyurethane, Silicone, VAE/EVA are covered as segments by Resin. Hot Melt, Reactive, Sealants, Solvent-borne, UV Cured Adhesives, Water-borne are covered as segments by Technology. Asia-Pacific, Europe, Middle East & Africa, North America, South America are covered as segments by Region.By Resin
| Polyurethane |
| Acrylic |
| Cyanoacrylate |
| Epoxy |
| Silicone |
| VAE / EVA |
| Other Resins |
By Technology
| Reactive |
| Hot-Melt |
| Sealants |
| Solvent-borne |
| UV-Cured |
| Water-borne |
By Geography
| Asia-Pacific | China |
| India | |
| Japan | |
| South Korea | |
| ASEAN Countries | |
| Rest of Asia-Pacific | |
| North America | United States |
| Canada | |
| Mexico | |
| Europe | Germany |
| United Kingdom | |
| France | |
| Italy | |
| Russia | |
| NORDIC Countries | |
| Rest of Europe | |
| South America | Brazil |
| Argentina | |
| Rest of South America | |
| Middle East and Africa | Saudi Arabia |
| South Africa | |
| Rest of Middle East and Africa |
| By Resin | Polyurethane | |
| Acrylic | ||
| Cyanoacrylate | ||
| Epoxy | ||
| Silicone | ||
| VAE / EVA | ||
| Other Resins | ||
| By Technology | Reactive | |
| Hot-Melt | ||
| Sealants | ||
| Solvent-borne | ||
| UV-Cured | ||
| Water-borne | ||
| By Geography | Asia-Pacific | China |
| India | ||
| Japan | ||
| South Korea | ||
| ASEAN Countries | ||
| Rest of Asia-Pacific | ||
| North America | United States | |
| Canada | ||
| Mexico | ||
| Europe | Germany | |
| United Kingdom | ||
| France | ||
| Italy | ||
| Russia | ||
| NORDIC Countries | ||
| Rest of Europe | ||
| South America | Brazil | |
| Argentina | ||
| Rest of South America | ||
| Middle East and Africa | Saudi Arabia | |
| South Africa | ||
| Rest of Middle East and Africa | ||


Market Definition
- End-user Industry - In the automotive industry, both the OEM and after market adhesive and sealants applications are considered under the scope.
- Product - All adhesive and sealant products used in automotive industry are considered in the market studied
- Resin - Under the scope of the study, resins like Polyurethane, Epoxy, Acrylic, Cyanoacrylate, VAE/EVA, and Silicone are considered
- Technology - For the purpose of this study, Water-borne, Solvent-borne, Reactive, Hot Melt, UV Cured Adhesives, and Sealants technologies are taken into consideration.
| Keyword | Definition |
|---|---|
| Hot-melt Adhesive | Hot melt adhesives are generally 100% solid formulations, based on thermoplastic polymers. They are solid at room temperature and are activated upon heating above their softening point, at which stage they are liquid, and hence, can be processed. |
| Reactive Adhesive | A reactive adhesive is made up of monomers that react in the adhesive curing process and do not evaporate from the film during use. Instead, these volatile components become chemically incorporated into the adhesive. |
| Solvent-borne Adhesive | Solvent-borne adhesives are mixtures of solvents and thermoplastic, or slightly cross-linked polymers, such as polychloroprene, polyurethane, acrylic, silicone, and natural and synthetic rubbers (elastomers). |
| Water-borne Adhesive | Water-borne adhesives use water as a carrier or diluting medium to disperse a resin. They are set by allowing the water to evaporate or be absorbed by the substrate. These adhesives are compounded with water as a diluent, rather than a volatile organic solvent. |
| UV Cured Adhesive | UV curing adhesives induce curing and create a permanent bond without heating by using ultraviolet (UV) light or other radiation sources. An aggregation of monomers and oligomers is cured or polymerized by ultraviolet (UV) or visible light in a UV adhesive. Because UV is a radiating energy source, UV adhesives are often referred to as radiation curing or rad-cure adhesives. |
| Heat-resistant Adhesive | Heat-resistant Adhesives refer to those that do not break down under high temperatures. One aspect of a complicated system of circumstances is the adhesive's capacity to withstand disintegration brought on by high temperatures. As the temperature rises, adhesives may liquefy. They can withstand stresses resulting from differing coefficients of expansion and contraction, which might be an additional advantage. |
| Reshoring | Reshoring is the practice of moving commodity production and manufacturing back to the nation where the business was founded. Onshoring, inshoring, and back shoring are further terms used. Offshoring, the practice of producing items abroad to lower labor and manufacturing costs, is the opposite of this. |
| Oleochemicals | Oleochemicals are compounds produced from biological oils or fats. They resemble petrochemicals, which are substances made from petroleum. The oleochemical business is built on the hydrolysis of oils or fats. |
| Nonporous Materials | Nonporous materials are substances that do not permit the passage of liquid or air. Nonporous materials are those that are not porous, such as glass, plastic, metal, and varnished wood. Since no air can get through, less airflow is required to raise these materials, negating the requirement for high airflow. |
| EU-Vietnam Free Trade Agreement | A trade agreement and an investment protection agreement were concluded between the European Union and Vietnam on June 30, 2019. |
| VOC content | Compounds with limited solubility in water and high vapor pressure are known as Volatile Organic Compounds (VOCs). Many VOCs are human-made chemicals that are used and produced in the manufacture of paints, pharmaceuticals, and refrigerants. |
| Emulsion Polymerization | Emulsion polymerization is a method of producing polymers or connected groups of smaller chemical chains known as monomers, in a water solution. The method is often used to make water-based paints, adhesives, and varnishes, in which the water stays with the polymer and is marketed as a liquid product. |
| 2025 National Packaging Targets | In 2018, the Australian Environment Ministry set the following 2025 National Packaging Targets: 100% of the packaging must be reusable, recyclable, or compostable by 2025, 70% of plastic packaging must be recycled or composted by 2025, 50% of average recycled content must be included in packaging by 2025, and problematic and unnecessary single-use plastic packaging must be phased out by 2025. |
| Russian Government’s Import Substitution Policy | The Western sanctions suspended the distribution of several high-tech items to Russia, including those required by the raw material export sectors and the military-industrial complex. In response, the government launched an "import substitution" scheme, appointing a special commission to oversee its implementation in early 2015. |
| Paper Substrate | Paper substrates are paper sheets, reels, or boards with a base weight of up to 400 g/m2 that has not been converted, printed or otherwise altered. |
| Insulation Material | A material that inhibits or blocks heat, sound, or electrical transmission is known as Insulation Material. The variety of insulation materials includes thick fibers like fiberglass, rock and slag wool, cellulose, and natural fibers as well as stiff foam boards and sleek foils. |
| Thermal Shock | A temperature change known as thermal shock generates stress in a material. It commonly results in material breakdown and is especially prevalent in brittle materials like ceramics. When there is a quick temperature change, either from hot to cold or vice versa, this process occurs abruptly. It occurs more frequently in materials with poor heat conductivity and insufficient structural integrity. |


Research Methodology
Mordor Intelligence follows a four-step methodology in all our reports.
- Step-1: Identify Key Variables: The quantifiable key variables (industry and extraneous) pertaining to the specific product segment and country are selected from a group of relevant variables & factors based on desk research & literature review; along with primary expert inputs. These variables are further confirmed through regression modeling (wherever required).
- Step-2: Build a Market Model: In order to build a robust forecasting methodology, the variables and factors identified in Step-1 are tested against available historical market numbers. Through an iterative process, the variables required for market forecast are set and the model is built on the basis of these variables.
- Step-3: Validate and Finalize: In this important step, all market numbers, variables and analyst calls are validated through an extensive network of primary research experts from the market studied. The respondents are selected across levels and functions to generate a holistic picture of the market studied.
- Step-4: Research Outputs: Syndicated Reports, Custom Consulting Assignments, Databases & Subscription Platforms


