Scandinavia Construction Market Size and Share
Market Overview
| Study Period | 2020 - 2031 |
|---|---|
| Forecast Data Period | 2026 - 2031 |
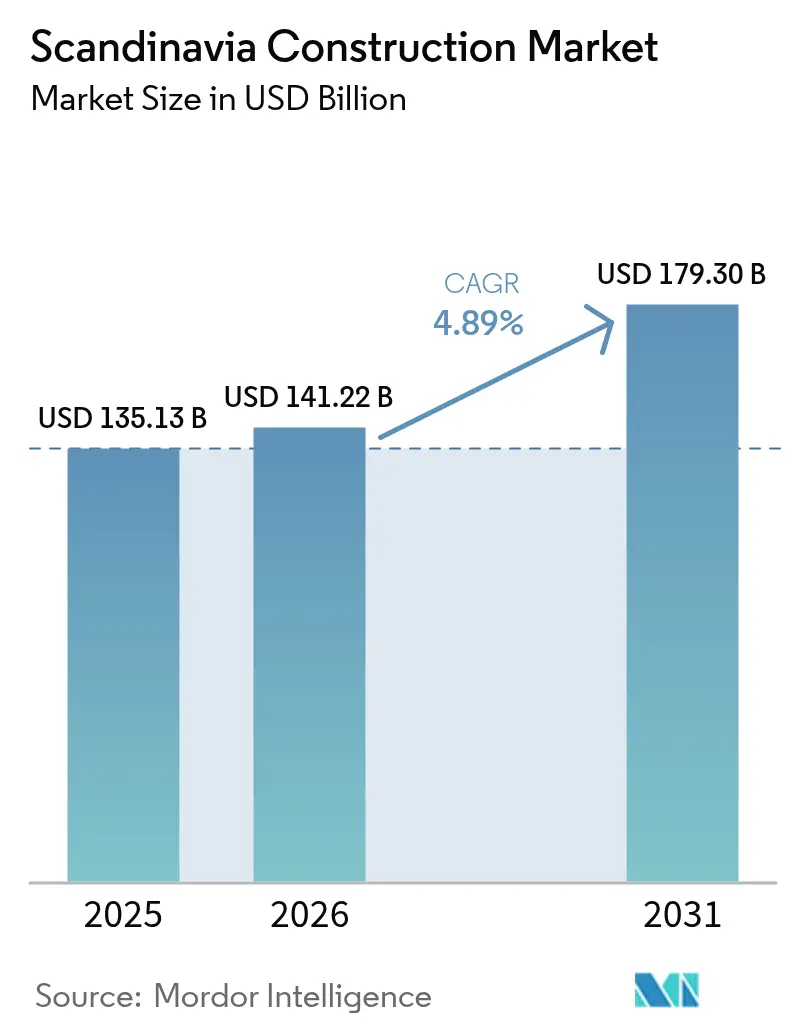
| Base Year Market Size (2025) | USD 135.13 Billion |
| Market Size (2026) | USD 141.22 Billion |
| Market Size (2031) | USD 179.30 Billion |
| Growth Rate (2026 - 2031) | 4.89% CAGR |
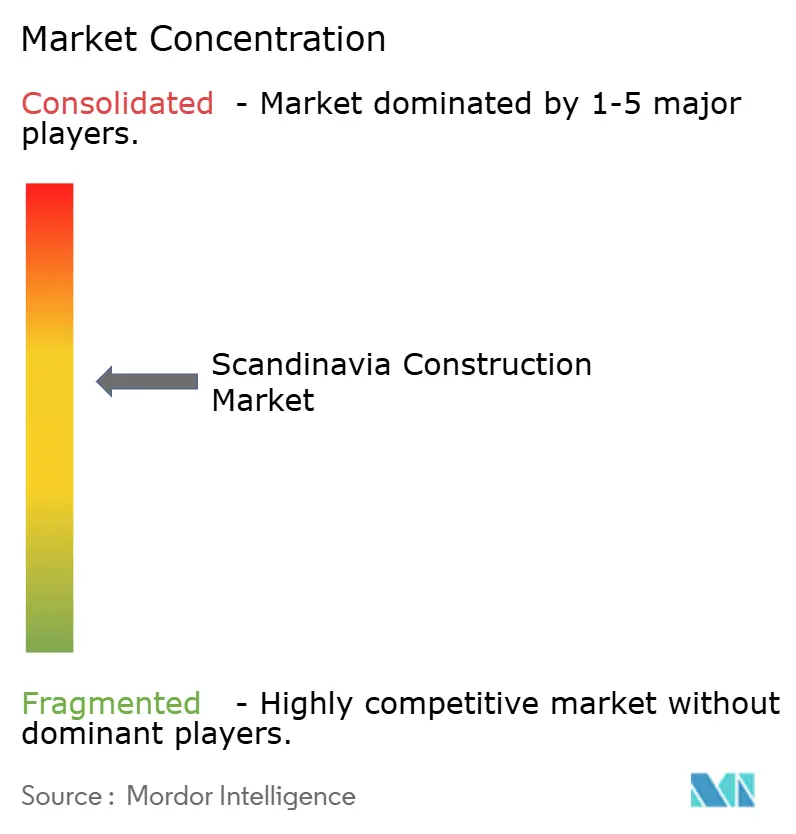
| Market Concentration | Medium |
Major Players *Disclaimer: Major Players sorted in no particular order Image © Mordor Intelligence. Reuse requires attribution under CC BY 4.0. | |
Scandinavia Construction Market Analysis by Mordor Intelligence
The Scandinavian construction market size was valued at USD 135.13 billion in 2025 and is estimated to grow from USD 141.22 billion in 2026 to reach USD 179.3 billion by 2031, at a CAGR of 4.89% during the forecast period (2026-2031). Growth is tilting away from speculative homebuilding toward infrastructure programs that hard-wire renewable-energy hubs, defense facilities, and strict energy-performance upgrades. A deep prefabrication culture, strong public-sector balance sheets, and low-carbon grid power continue to attract capital for data centers and power-to-X plants. Contractors that can navigate embodied-carbon rules, manage volatile timber supply, and integrate factory-built modules are positioned to win long-run maintenance-heavy contracts. Competitive discipline remains moderate because the top five incumbents still control the largest turnkey packages but face shrinking bid margins tied to fixed-price procurement formats[1]Skanska AB, “Annual Report 2025,” SKANSKA.COM.
Key Report Takeaways
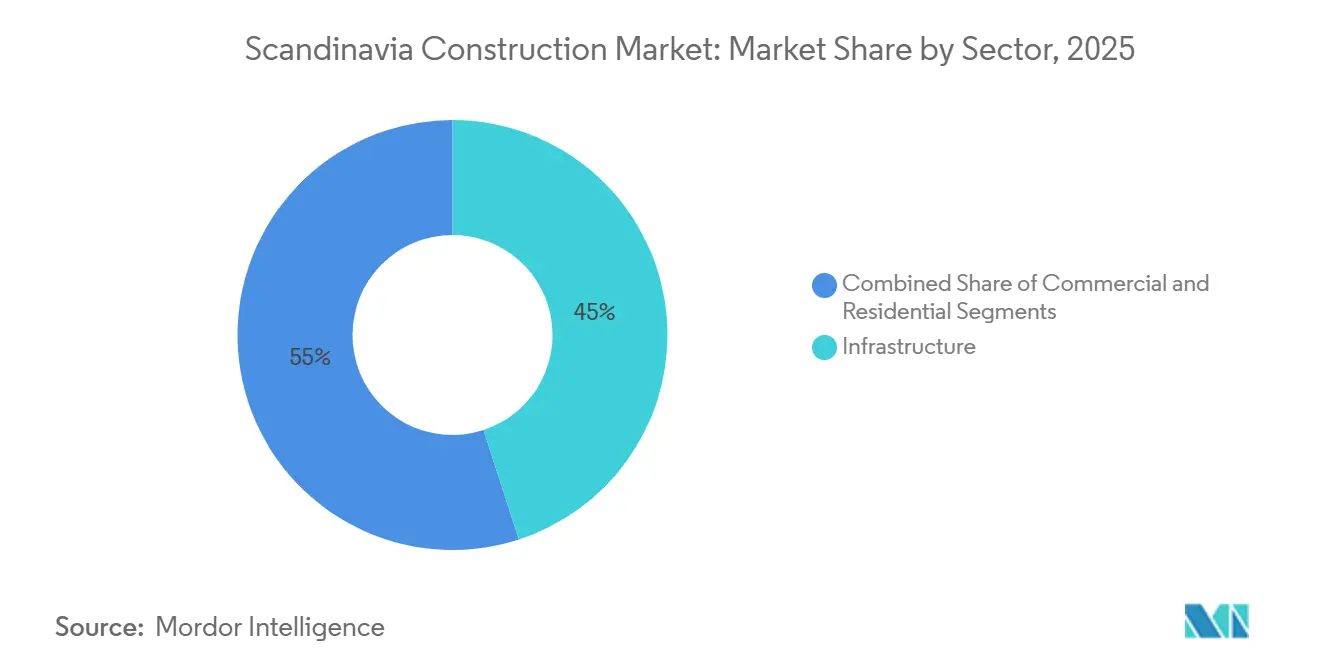
- By sector, infrastructure held 45% of the Scandinavian construction market share in 2025, while residential is projected to register the fastest 5.80% CAGR through 2031.
- By construction type, new-build projects commanded 60% share of the Scandinavian construction market size in 2025, whereas renovation is forecast to advance at a 5.00% CAGR to 2031.
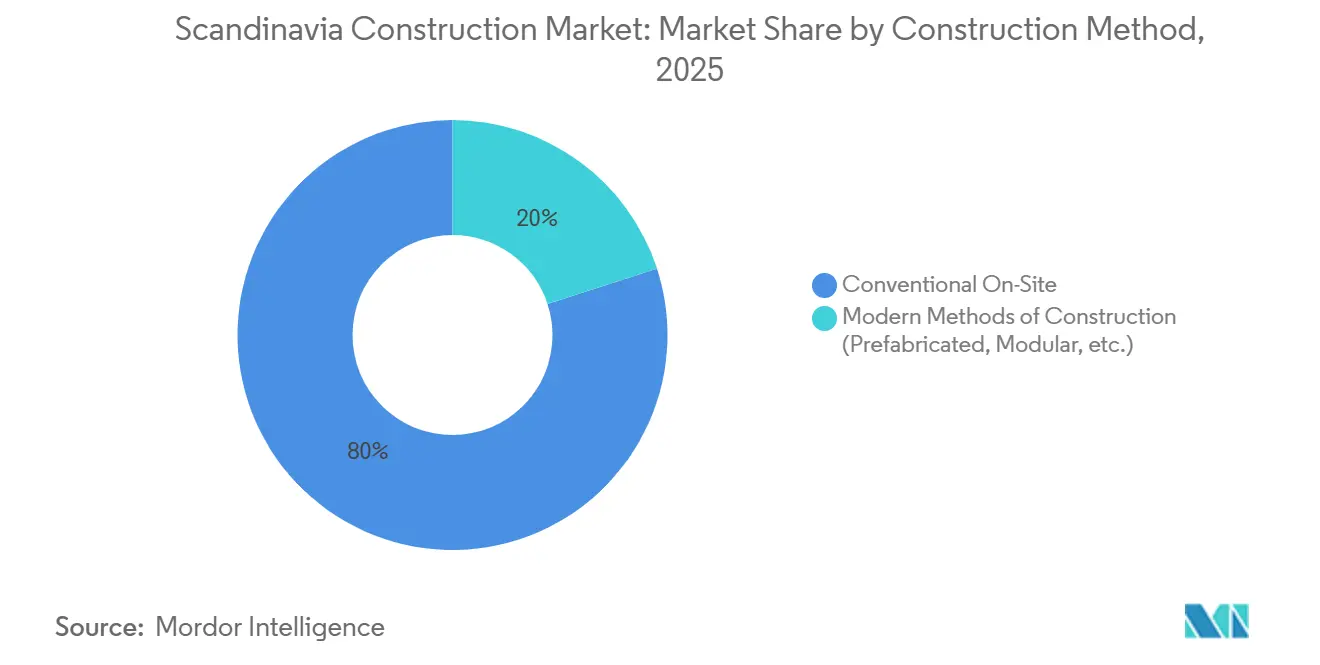
- By construction method, conventional on-site techniques retained an 80% share in 2025 and modern methods of construction are expanding at a 7.00% CAGR through 2031.
- By country, Sweden led with a 45% revenue share in 2025 and Norway is on track for the quickest 6.00% CAGR over 2026-2031.
Note: Market size and forecast figures in this report are generated using Mordor Intelligence’s proprietary estimation framework, updated with the latest available data and insights as of 2026.
Scandinavia Construction Market Trends and Insights
Drivers Impact Analysis*
| Drivers | (~) % Impact on CAGR Forecast | Geographic Relevance | Impact Timeline |
|---|---|---|---|
| Surge in prefabricated and modular housing | +0.9% | Sweden dominates; Denmark and Norway scaling adoption | Medium term (2-4 years) |
| Public-sector infrastructure acceleration | +1.1% | Region-wide; Sweden EUR 3.5 billion allocation | Short term (≤ 2 years) |
| Renewable-energy megaproject pipeline | +1.3% | Norway offshore wind; Denmark power-to-X hubs | Long term (≥ 4 years) |
| Energy-efficiency retrofit incentives | +0.8% | Denmark USD 45 million; Sweden USD 75 million annualized | Medium term (2-4 years) |
| Arctic and Baltic defense build-up | +0.6% | Norway USD 4.5 billion; northern Sweden installations | Long term (≥ 4 years) |
| Nordic data-center colocation boom | +0.7% | Sweden hyperscale dominance; Norway emerging | Medium term (2-4 years) |
| Source: Mordor Intelligence | |||
Surge in Prefabricated and Modular Housing
Factory-built units have shifted from niche to mainstream as municipalities demand quicker delivery of affordable homes. Sweden reached 90% prefabrication penetration in detached housing during 2025, outpacing the EU average and demonstrating that standardized modules cut on-site schedules to eight months. Joint ventures such as BoKlok supplied 12,000 dwellings priced 20-25% below conventional builds, and Denmark now obliges social-housing tenders above USD 7 million to include off-site feasibility studies[2]European Commission, “Energy Performance of Buildings Directive (Recast),” EUROPA.EU. Norway offers a 5% bid-score premium for modular bids, signaling a policy-led catch-up. As labor shortages intensify, modular housing underpins the residential segment’s 5.80% CAGR and reallocates scarce tradespeople to complex infrastructure projects.
Public-Sector Infrastructure Acceleration
The EU Recovery and Resilience Facility earmarked USD 3.8 billion for Swedish digital rail and grid upgrades, while Denmark’s 2025-2028 national plan sets aside USD 23 billion for transport links. Norway’s 2025-2036 blueprint budgets roughly USD 110 billion for highways, rail, and ferries. These outlays lock-in design-build work for at least five years and shift performance risk onto contractors through turnkey contracts with multi-year maintenance clauses. Larger incumbents absorb asphalt price volatility and wage inflation, squeezing smaller regionals and accelerating consolidation.
Renewable-Energy Megaproject Pipeline
Offshore wind and green-hydrogen projects are the fastest-growing civil-works niche. Norway’s 1.5 GW Utsira Nord floating wind zone alone commands more than USD 1.8 billion in construction value, from subsea cables to converter halls. Denmark’s 280 MW power-to-X award anchors an Esbjerg hydrogen hub. Pan-Nordic transmission corridors mandated by the Esbjerg Declaration will require seabed trenching crews and high-voltage specialists for decades, adding 1.3 percentage points to the forecast CAGR.
Energy-Efficiency Retrofit Incentives
The recast Energy Performance of Buildings Directive must be transposed by 29 May 2026. Denmark has injected USD 45 million into public-building retrofits and Sweden reinstated USD 75 million annual grants tied to lifecycle carbon caps. Heat-pump swaps, façade insulation, and solar-ready roofs turn renovation into a 5.00% CAGR engine. Performance-contracting models transfer savings risk to specialty firms, rewarding contractors with in-house energy analytics.
Restraints Impact Analysis*
| Restraint | (~) % Impact on CAGR Forecast | Geographic Relevance | Impact Timeline |
|---|---|---|---|
| Tight monetary policy cutting mortgage affordability | –0.7% | Sweden and Norway heavily exposed; Denmark partly insulated | Short term (≤ 2 years) |
| Skilled-labor shortages from aging workforce | –0.5% | Region-wide, acute in specialized trades | Medium term (2-4 years) |
| Embodied-carbon caps pushing up compliance costs | –0.3% | Sweden first mover; neighbors follow | Medium term (2-4 years) |
| Volatile supply of cross-laminated timber (CLT) | –0.2% | Norway most vulnerable, Sweden and Denmark diversifying | Long term (≥ 4 years) |
| Source: Mordor Intelligence | |||
Tight Monetary Policy Cutting Mortgage Affordability
Policy rates remained high through 2025, 2.5% in Sweden and 4.5% in Norway, while real wages stalled, pushing household debt ratios above 180% of income[3]Sveriges Riksbank, “Monetary Policy Report 2025,” RIKSBANK.SE. Fixed-rate norms dulled the effect of ECB easing in Denmark. The drag slices 0.7 percentage points off headline growth and shifts private developers toward institutional build-to-rent models. JM AB’s 2024 housing starts fell 20%, underscoring sensitivity.
Skilled-Labor Shortages from Aging Workforce
One-quarter of Sweden’s construction workforce will retire by 2030, and vocational enrollment dropped 15% between 2015-2024. Norway expects a 10,000-worker gap by 2028. Wage premiums erode margins and delay schedules, pushing firms to automate. Skanska’s factory units need 40% fewer on-site hours, but only a quarter of surveyed Nordic builders report productivity gains from digital tools.
*Our forecasts treat driver/restraint impacts as directional, not additive. The impact forecasts reflect baseline growth, mix effects, and variable interactions.
Segment Analysis
By Sector: Infrastructure Still Dominant but Residential Races Ahead
Infrastructure generated 45% of Scandinavian construction market revenue in 2025, powered by road, rail, and energy-grid programs. Yet residential shows the briskest 5.80% CAGR to 2031 because prefabricated units slash delivery times and relieve labor bottlenecks. Norway’s USD 400 million E6 Nordland highway and Sweden’s USD 780 million Huddinge hospital highlight mega-projects still funneled to incumbents. Meanwhile, BoKlok’s modular homes sell 20-25% below market and absorb first-time-buyer demand even amid rate pressure. Commercial growth is mixed: office demand cools, but data-center shells and mixed-use redevelopments keep volume intact.
Continued infrastructure dominance gradually pivots toward defense corridors and green-energy grids. Norway’s floating-wind substructures and Sweden’s rail-electrification lots draw on specialized marine and electrical crews, widening entry barriers. Residential’s ascent balances the portfolio and diffuses cyclicality, while commercial hinges on hyperscale colocation leases and retail-to-housing conversions in dense urban nodes.


By Construction Type: Renovation Gains Ground Under EPBD Clock
New construction captured 60% of 2025 value thanks to flagship transport links and greenfield housing, yet renovation is pacing a 5.00% CAGR through 2031 as EPBD deadlines force building owners to upgrade envelopes, HVAC, and on-site renewables. Denmark’s USD 45 million retrofit kitty targets schools and hospitals, and Sweden revived USD 75 million annual grants aligned with lifecycle GWP caps. The Scandinavian construction market size tied to renovation will climb as fossil-fuel boilers phase out and solar-readiness rules bite.
The renovation thrust has ripple effects: energy-performance contracting spreads risk between contractors and asset owners, while BIM-based audits streamline scope discovery. New-build pipelines remain healthy due to data centers and defense campuses, but profit pools tilt toward firms fluent in both deep-retrofit logistics and factory-installed net-zero systems.
By Construction Method: Modern Methods Break into Double-Digit Share
Conventional site-built projects still contributed 80% of output in 2025, yet modern methods of construction already enjoy a 20% slice and are on a 7.00% CAGR path. Sweden’s 90% module adoption in detached housing is the template; Denmark now requires feasibility checks for large public bids, and Norway offers tender score bonuses for off-site elements. The Scandinavian construction market share for factory solutions will rise as robotic lines shorten assembly times to eight months and cut site labor by 40%.
Hybrid adoption is spreading beyond homes into light-industrial shells and mezzanine offices inside logistics parks. Contractors need process-engineering skills, advanced QA, and just-in-time logistics coordination, competencies alien to traditional super-intendents. Conventional builds still dominate heavy civil jobs that resist modularization, but even there, precast bridge decks and tunnel linings gain traction.
By Investment Source: Public Funding Anchors the Market While Private Capital Accelerates
In 2025, public programs dominated 70% of the Scandinavian construction market, investing over USD 95 billion in highways, rail corridors, grid upgrades, and defense bases. Funding from national budgets, EU Recovery grants, and Norway’s sovereign wealth stabilized the pipeline with multi-year maintenance clauses, ensuring steady cash flows. Fixed-price contracts shifted cost-overrun risks to builders, tightening margins for those unable to hedge material volatility. Public clients mandated lifecycle-carbon declarations in bids, favoring firms with low-carbon concrete, certified timber, strong balance sheets, and compliance systems.
Private investments, at 30% of 2025 funding, are projected to grow at a 6.1% CAGR through 2031, driven by modular housing, hyperscale data centers, and power-to-X hubs. Brookfield’s USD 10 billion Swedish data-center program and BoKlok’s 12,000 factory-built homes highlight equity’s focus on quick builds and long-lease revenues. High policy rates push developers toward build-to-rent models funded by pension pools, reducing reliance on mortgage buyers. This shift is expected to raise private deals in the Scandinavian construction market to USD 70 billion by 2031. Private sponsors co-finance municipal retrofits via energy-performance contracts, sharing utility-bill savings. Tightening embodied-carbon caps drive demand for material passports, favoring contractors compliant with public-sector carbon audits.
Geography Analysis
Sweden’s 45% share stems from diversified pipelines that cover data centers, modular housing, and rail electrification, yet its CAGR trends lower at 4.50% as mortgage constraints weigh on speculative apartments. Land values near substations climbed 30% after Brookfield’s USD 10 billion commitment, illustrating how clean power arbitrage inflates industrial plots. Prefabrication factories clustered around Stockholm continue to feed both domestic and export demand.
Norway’s 6.00% CAGR makes it the regional pace-setter. The USD 400 million E6 Nordland highway, 1.5 GW Utsira Nord offshore wind zone, and USD 4.5 billion defense overhaul lock in civil-works sequences well into the 2030s. Elevated policy rates cool Oslo housing starts, but the oil-fund cushion keeps public capex flowing during downturns. Marine-grade contractors and Arctic-logistics specialists reap premium margins given harsh-weather constraints.
Denmark, though smaller, punches above its weight in climate mandates. The 280 MW Esbjerg hydrogen campus catalyzes pipeline, tank farm, and process-hall work, while the USD 45 million retrofit pot targets pre-1980 civic buildings. Mandatory IFC BIM on public jobs above USD 1.4 million trimmed coordination errors by 45%, and embodied-carbon caps arrive in 2026, effectively setting a Nordic template. Fixed-rate mortgage norms temper housing elasticity, but low unemployment tightens labor supply and feeds wage inflation.
Competitive Landscape
Skanska, NCC, Peab, Veidekke, and AF Gruppen jointly control backlogs exceeding USD 27 billion, yet none exceeds 20% individually. Skanska’s USD 780 million Huddinge hospital and USD 42 million Solna land sale highlight a strategy of land banking near power-dense nodes. Veidekke’s USD 400 million E6 Nordland and USD 77 million Mariestad upgrades illustrate turnover diversification and embedded O&M clauses. NCC shed residential exposure in 2024 to focus on public infrastructure, while Peab leans on in-house prefab lines for affordable housing.
AF Gruppen’s February 2026 purchase of 70% of H.A. Bygg for USD 13 million marks an early-stage land-grab in Sweden’s civil-works corridor. Digital adoption is uneven: 60% of firms trial AI, yet only 25% harvest double-digit productivity gains, leaving upside for data-rich early movers. Entry barriers inside defense work remain steep because NATO-level clearances exclude new challengers, effectively cartelizing a stable cash-flow niche.
White-space sits in energy-performance contracting, where guaranteed-savings models lure asset owners, and in advanced factory modules that combine timber-steel hybrids to offset CLT volatility. Multinationals eyeing the Scandinavian construction market must navigate embodied-carbon audits, tight labor pools, and fixed-price procurement, but can leverage the region’s green-power brand to pilot low-carbon materials.
Scandinavia Construction Industry Leaders
Veidekke ASA
Skanska AB (Sweden)
NCC AB
Peab AB
JM AB
- *Disclaimer: Major Players sorted in no particular order

Recent Industry Developments
- February 2026: AF Gruppen acquired 70% of H.A. Bygg Entreprenad AB for USD 13 million, boosting Swedish civil-works capacity ahead of large Trafikverket tenders.
- December 2025: Veidekke won a USD 10 million prefabricated timber housing contract in Linköping, trimming assembly to six months.
- December 2025: Peab secured a USD 12 million apartment project in Lund, leveraging its prefab line to undercut market prices by 15%.
- November 2025: Skanska sold a 40,000 m² Solna industrial plot for USD 42 million to a hyperscale data-center operator, reflecting 30% land premiums near substations.


Research Methodology Framework and Report Scope
Market Definitions and Key Coverage
Our study defines the Scandinavian construction market as all on-site and off-site works that create, extend, or refurbish buildings and civil infrastructure across Denmark, Sweden, and Norway, valued at the invoice price of labor, materials, and fixed equipment. New build, major renovations, and large maintenance projects are in scope.
Scope exclusion: very small DIY repairs and purely temporary structures fall outside this definition.
Segmentation Overview
- By Sector
- Residential
- Apartments and Condominums
- Villas and Landed Houses
- Commercial
- Office
- Retail
- Industrial and Logistics
- Others
- Infrastructure
- Transportation Infrastructure
- Energy and Utilities
- Others
- Residential
- By Construction Type
- New Construction
- Renovation
- By Construction Method
- Conventional On-Site
- Modern Methods of Construction (Prefabricated, Modular, etc.)
- By Investment Source
- Public
- Private
- By Country
- Denmark
- Sweden
- Norway
Detailed Research Methodology and Data Validation
Primary Research
To close data gaps, we interview contractors, materials suppliers, site engineers, project financiers, and municipal procurement officers across all three countries. These conversations clarify cost-per-square-meter shifts, typical lead times, average utilization rates, and near-term bid pipelines, which help us verify headline volumes and refine country-level price assumptions.
Desk Research
Analysts start with public data that anchor activity levels, such as annual production indices from Statistics Denmark, Statistics Norway, and Statistics Sweden, building-permit dashboards from Nordic national planning agencies, and Eurostat gross fixed capital formation tables. Trade-body bulletins from the Swedish Construction Federation and the Danish Construction Association add project pipelines, while energy-efficiency retrofit volumes come from the International Energy Agency. Company filings retrieved through D&B Hoovers and news flows from Dow Jones Factiva complement macro inputs and reveal tender backlogs and order books. These sources illustrate employment swings, materials inflation, and contract awards that feed our base calculations. The examples listed are illustrative; many other sources were reviewed to complete data collection and sense-check trends.
Market-Sizing & Forecasting
We build the 2024 baseline through a top-down roll-up of national construction output accounts, reconstructed into our scope and currency. Results are cross-checked with selective bottom-up tests, such as sampled average selling price multiplied by residential completions and supplier revenue roll-ups. Key variables modeled each year include building-permit area, civil-works tender value, material cost indices, labor productivity, housing-starts to population ratio, and public capital-spending plans. Forecasts to 2030 apply a multivariate regression that links those drivers to historical output, with scenario adjustments validated by our interview panel. Where bottom-up samples diverge, we adjust using weighted averages that favor the most reliable series.
Data Validation & Update Cycle
Outputs pass two rounds of peer review, followed by an anomaly screen that flags swings above one standard deviation versus historic norms. We reconnect with sources when large tenders, policy shifts, or price spikes occur. Mordor updates this model every twelve months and issues interim refreshes for material events, so clients always receive our latest view.
Why Mordor's Scandinavia Construction Baseline Commands Reliability
Published values often differ because providers choose unique sector mixes, price bases, and refresh cadences. Recognizing this, Mordor analysts disclose their scope choices and update rules, giving users a transparent starting point.
Key gaps arise when other publishers bundle minor household repairs, apply single-country deflators to tri-nation totals, or lock growth paths to unvalidated optimism. Our base year is built from official output accounts, our cost stack is country-specific, and our model is re-benchmarked annually, which limits drift.
Benchmark comparison
| Market Size | Anonymized source | Primary gap driver |
|---|---|---|
| USD 234.9 B | Mordor Intelligence | - |
| USD 130.5 B | Regional Consultancy A | Narrows scope to residential new-build only and uses constant 2020 prices |
| USD 135.0 B | Trade Journal B | Applies fixed exchange rate and omits renovation spending |
These comparisons show that when scope discipline, localized price tracking, and timely updates align, the resulting baseline, Mordor's, remains the dependable yardstick for strategic decisions.


Key Questions Answered in the Report
How big will Scandinavian construction spending be by 2031?
It is forecast to reach USD 179.3 billion, climbing from USD 141.22 billion in 2026 at a 4.89% CAGR.
Which segment is expanding the fastest?
Modern Methods of Construction is scaling at a 7.00% CAGR as labor shortages and speed-to-market pressures intensify.
Why is Norway’s growth outpacing its neighbors?
Large defense installations, offshore-wind grids, and strong sovereign-fund backing propel Norway to a 6.00% CAGR through 2031.
What is driving renovation demand?
The 2026 EPBD deadline forces deep retrofits to meet energy-performance and embodied-carbon caps, lifting renovation work at a 5.00% CAGR.
How are embodied-carbon rules affecting contractors?
Compliance adds design-documentation costs and favors firms sourcing low-carbon materials, yet it also creates first-mover pricing power on public bids.
Page last updated on:


