E-Retail Market Size and Share
Market Overview
| Study Period | 2021 - 2031 |
|---|---|
| Market Size (2026) | USD 4.08 Trillion |
| Market Size (2031) | USD 5.52 Trillion |
| Growth Rate (2026 - 2031) | 6.22% CAGR |
| Fastest Growing Market | Middle East and Africa |
| Largest Market | Asia Pacific |
| Market Concentration | Low |
Major Players *Disclaimer: Major Players sorted in no particular order Image © Mordor Intelligence. Reuse requires attribution under CC BY 4.0. | |
E-Retail Market Analysis by Mordor Intelligence
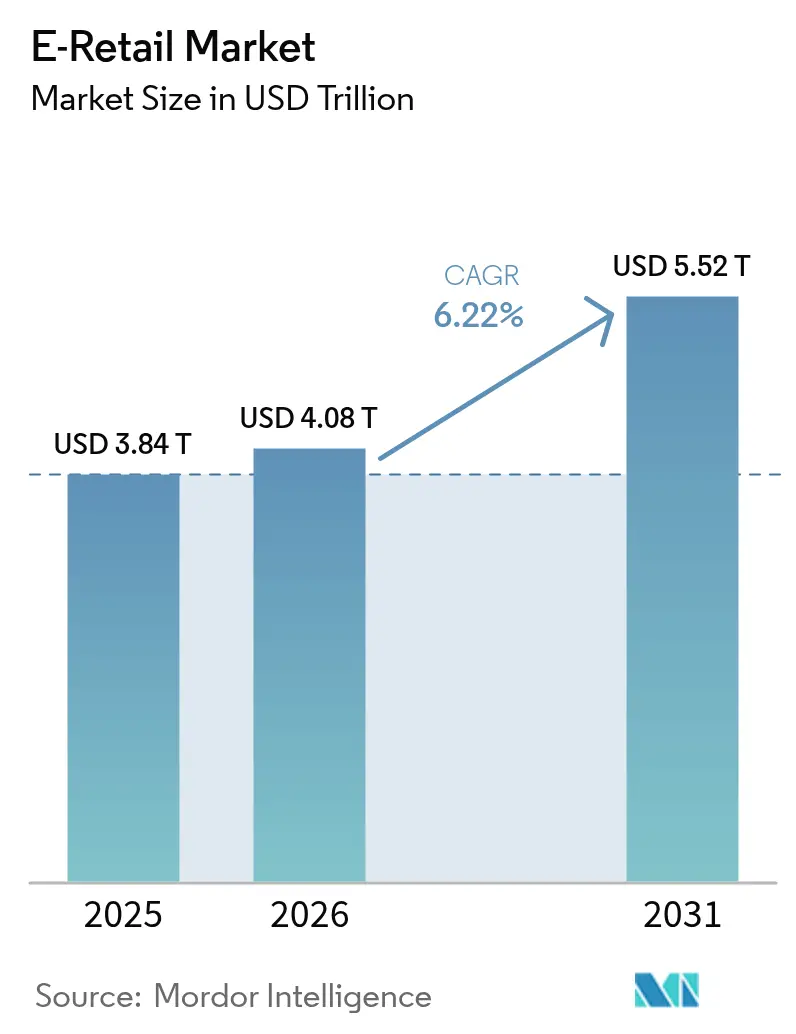
The global e-retail market size is projected to grow from USD 3.84 trillion in 2025 to USD 4.08 trillion in 2026 and reach USD 5.52 trillion by 2031, with a CAGR of 6.22% during 2026-2031. Growth in 2026 reflects normalization after pandemic-driven surges as digital shopping habits become widespread across income levels and regions. Faster checkouts and reduced friction from digital wallets are lowering cart abandonment rates. Mobile-first traffic continues to rise, supported by improved on-device experiences with conversion rates comparable to desktops. Platforms are integrating discovery and shopping through short videos and live commerce, reshaping brand acquisition strategies and increasing creator-led spending. Marketplace scale and omnichannel logistics remain key advantages, with first-party data and store-backed fulfillment driving sustainable growth despite tightening unit economics.
Key Report Takeaways
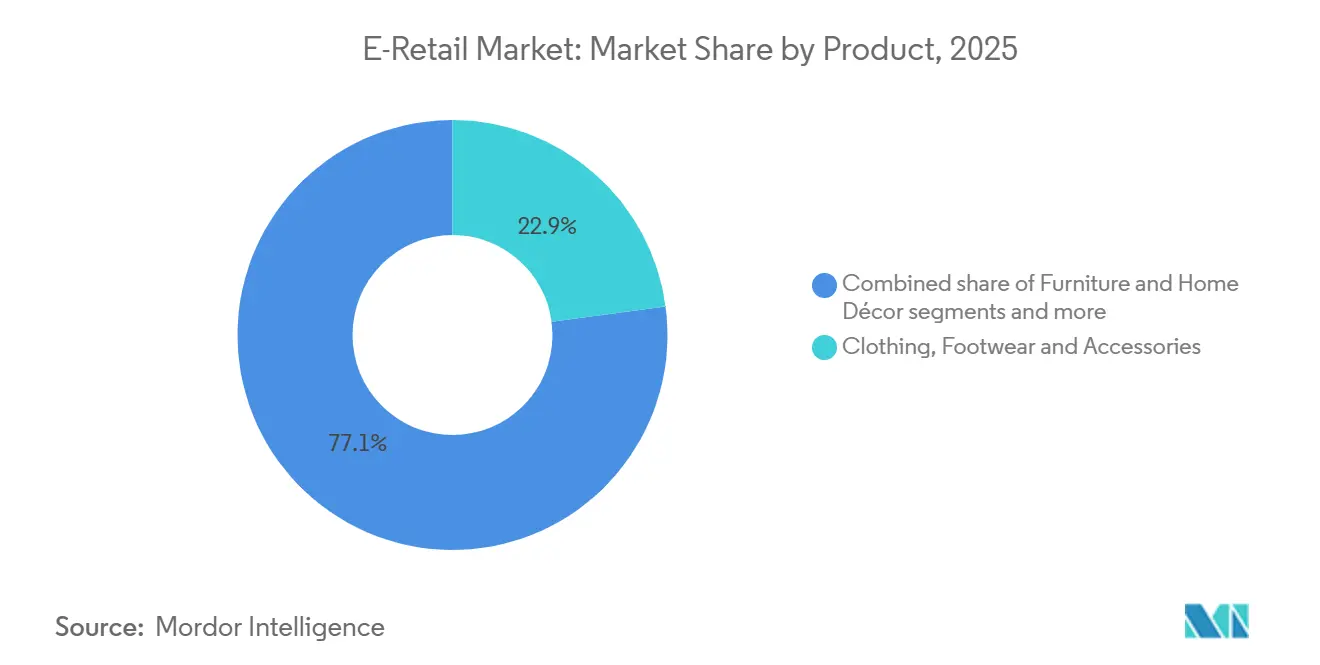
- By product, clothing, footwear, and accessories held 22.88% of the Global E‑retail market share in 2025, while food and grocery is forecast to expand at a 13.06% CAGR through 2031.
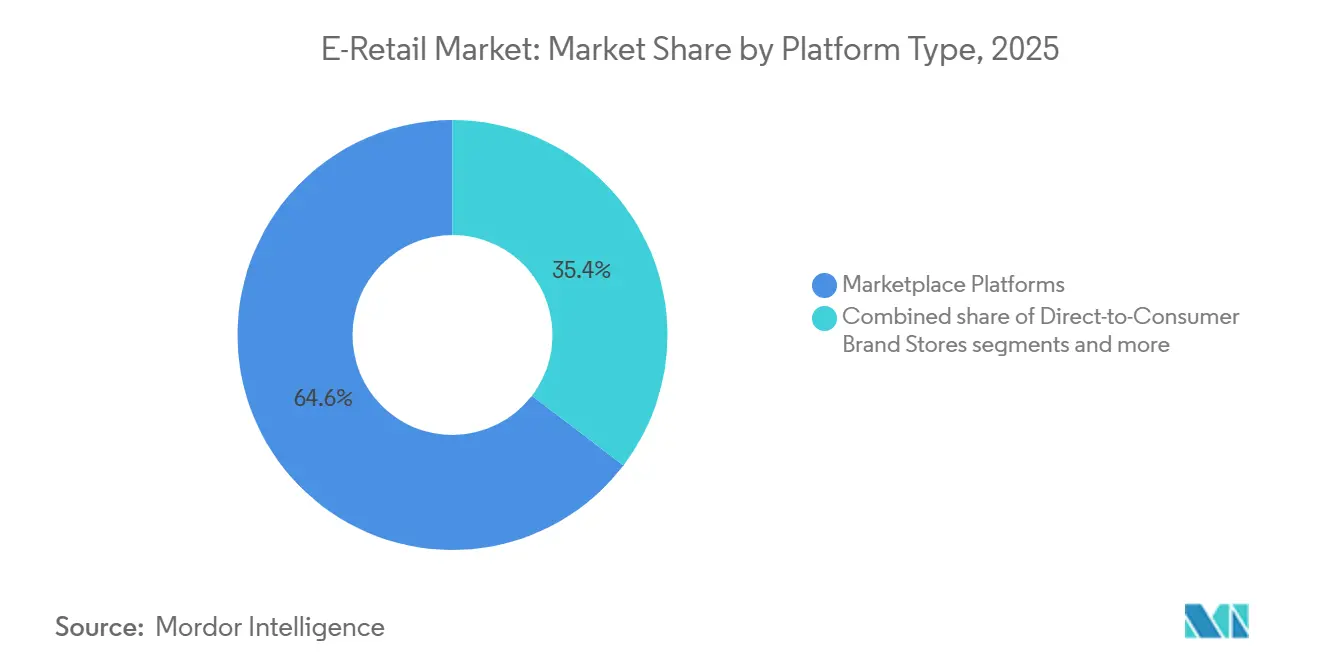
- By platform type, marketplace platforms accounted for 64.63% of the Global E‑retail market share in 2025, while social‑commerce platforms recorded the highest projected CAGR at 20.96% through 2031.
- By device, mobile represented 71.55% of the Global E‑retail market share in 2025, while connected TV and smart devices are set to grow at a 17.22% CAGR through 2031.
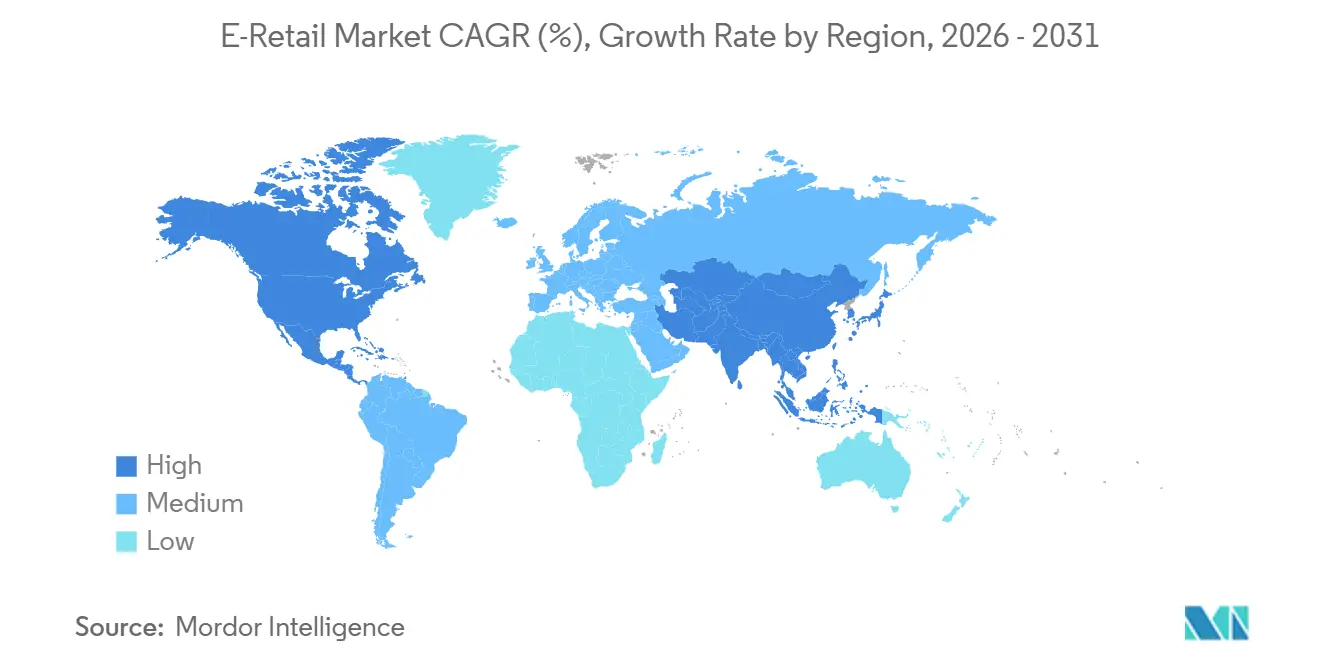
- By geography, Asia‑Pacific captured 59.78% of the Global E‑retail market share in 2025, while the Middle East & Africa is projected to expand at a 16.60% CAGR over 2026–2031.
Note: Market size and forecast figures in this report are generated using Mordor Intelligence’s proprietary estimation framework, updated with the latest available data and insights as of 2026.
Global E-Retail Market Trends and Insights
Drivers Impact Analysis*
| Drivers | (~) % Impact on CAGR Forecast | Geographic Relevance | Impact Timeline |
|---|---|---|---|
| Widespread smartphone adoption and affordable mobile internet are fueling e‑retail growth | +1.8% | Global, with Asia-Pacific and Middle East and Africa leading penetration gains | Medium term (2-4 years) |
| Expansion of secure digital payment systems is strengthening consumer trust | +1.5% | Global, China & India UPI/WeChat Pay, Brazil Pix, Middle East and Africa mada / M-Pesa | Short term (≤ 2 years) |
| Development of cross‑border logistics networks is enabling smoother e‑commerce flows | +0.9% | Global, RCEP economies, United States-Mexico-Canada corridor | Medium term (2-4 years) |
| Growing preference for convenience and on‑demand retail is reshaping shopping behavior | +1.2% | North America and Europe core, spill-over to urban Asia-Pacific and Latin America | Short term (≤ 2 years) |
| Live‑streaming‑driven social commerce is spurring impulse purchases | +1.0% | China, Southeast Asia, India, early adoption in North America | Medium term (2-4 years) |
| AI‑enabled hyper‑personalization in tier‑2 and tier‑3 cities is enhancing customer engagement | +0.8% | India, Indonesia, Vietnam, Brazil, Nigeria | Long term (≥ 4 years) |
| Source: Mordor Intelligence | |||
Widespread smartphone adoption and affordable mobile internet are fueling e‑retail growth
Smartphone adoption across emerging and developed markets drives mobile-first online shopping and steady conversions on handheld devices. Progressive web apps and one-tap authentication have reduced the gap between desktop and mobile checkout rates. Super-app ecosystems integrate payments, messaging, ride-hailing, food delivery, and shopping, lowering customer acquisition costs and concentrating user activity. First-party identities within these apps enhance retention by consolidating transaction histories, loyalty points, and financing. As 4G and 5G networks expand into tier-2 and tier-3 cities, new shoppers increasingly adopt mobile wallets over traditional cards, aligning the global e-retail market with instant payment practices in high-growth regions[1]NASSCOM Community, “Mobile Revolution in Retail: 5 Ways Mobility Boosts Business Growth,” NASSCOM, community.nasscom.in .
Expansion of secure digital payment systems is strengthening consumer trust
Digital wallets are gaining a larger share of electronic transactions at physical and online points of sale, reducing friction and fraud while enabling micro-merchants to accept payments without expensive terminals. Pix is expected to dominate online payments in Brazil by 2025, promoting instant settlement and lower merchant costs. In the Middle East, domestic schemes like mada are expanding across retail categories, encouraging wallet and account-to-account payments. Regulatory sandboxes in Gulf markets allow licensed players to test embedded finance features, reducing onboarding costs and accelerating compliant offerings. In Asia, growing wallet adoption is driving monetization beyond payments into credit decisioning and targeted advertising, using transaction data to optimize campaigns and loyalty programs at scale[2]Press Information Bureau (PIB), “IMF’s Admiration for India’s Success in Revolutionizing Digital Payments,” Government of India, pib.gov.in.
Development of cross‑border logistics networks is enabling smoother e‑commerce flows
Trade frameworks in Asia-Pacific reduce costs and simplify customs, enabling exporters to expand assortments and match local prices. Investments in regional fulfillment centers, bonded facilities, and automated sorting improve cross-border reliability, making next-day or two-day delivery feasible for more routes. Platform operators extend coverage to remote areas, addressing service gaps and increasing demand despite slower delivery speeds. Warehousing in transshipment hubs across the Gulf, Southeast Asia, and Mexico provides buffers against disruptions, stabilizing service during port congestion or security issues. Modal flexibility and cross-dock density are as important as delivery speed, as cost-to-serve and reliability are critical for maintaining margins in the global e-retail market during peak seasons.
Growing preference for convenience and on‑demand retail is reshaping shopping behavior
Consumers value speed for certain purchases but are willing to trade time for lower fees, creating a model of fast paid delivery and slower free shipping. Omnichannel retailers use sub-day delivery and pickup windows to build habits while leveraging store networks to optimize last-mile costs. Cost-conscious merchants promote consolidated shipments, reducing emissions and costs when buyers accept longer delivery times. Packaging and sustainability regulations in Australia and Europe mandate recyclability thresholds and extended producer responsibility, adding fees in high-return categories like apparel. Logistics providers and retailers narrow SKU offerings in high-return segments and invest in fit tools and improved product content to minimize returns, protecting contribution margins at scale[3]Vinculum Group, “Logistics Strategy: Speed and Cost – Finding the Sweet Spot in Last-Mile Delivery,” Vinculum, vinculumgroup.com.
Restraints Impact Analysis*
| Restraints | (~) % Impact on CAGR Forecast | Geographic Relevance | Impact Timeline |
|---|---|---|---|
| Concerns over cyber‑security and data privacy are undermining consumer confidence | -0.7% | Global, heightened in European Union GDPR, California CCPA, China PIPL | Short term (≤ 2 years) |
| High last‑mile delivery expenses in rural regions are inflating operational costs | -0.5% | North America rural, Latin America interior, Sub-Saharan Africa, India hinterlands | Medium term (2-4 years) |
| Carbon‑footprint regulations are restricting the practice of free product returns | -0.4% | European Union Extended Producer Responsibility, France anti-waste law, United States state EPR pilots | Medium term (2-4 years) |
| The shift to a cookieless future is reducing the accuracy of ad targeting | -0.6% | Global, Google Chrome third-party cookie deprecation Q1 2025, Apple ITP in place | Short term (≤ 2 years) |
| Source: Mordor Intelligence | |||
Concerns over cyber‑security and data privacy are undermining consumer confidence
Threat activity targeting e-commerce platforms increased through credential stuffing and API exploits, raising breach costs and diverting IT budgets from growth initiatives. GDPR fines and enforcement led multinationals to create separate data environments to reduce cross-border processing risks. Large retailers implemented zero-trust architectures and improved identity management, limiting lateral movement during incidents. Privacy changes in mobile ecosystems reduced third-party data targeting accuracy, impacting paid-media ROAS and increasing the importance of first-party relationships for DTC brands. Higher fixed costs for security and consent management created challenges for smaller operators, raising barriers to entry in the global e-retail market[4]GDPR Register, “GDPR Fines 2025: DPO Lessons,” GDPR Register, gdprregister.eu.
High last‑mile delivery expenses in rural regions are inflating operational costs
Last-mile delivery constitutes the largest share of logistics costs, with challenges intensifying in low-density areas due to poor route utilization and distant stops. Rural surcharges and peak-season fees increased in 2025 and 2026, making free shipping unviable for small orders and leading merchants to raise order thresholds. Rural coverage strategies focus on lockers, postal partnerships, and milk-run density, prioritizing efficiency over speed. In Latin America’s interior markets, scale advantages allow certain providers to dominate, enabling investments that competitors cannot match, improving reliability in specific corridors. Interoperable logistics frameworks, such as open networks, aim to expand carrier options for sellers, but managing fragmentation risks and fraud is critical to maintaining buyer trust at delivery points.
*Our forecasts treat driver/restraint impacts as directional, not additive. The impact forecasts reflect baseline growth, mix effects, and variable interactions.
Segment Analysis
By Product: Quick-Commerce Redefines Grocery Battleground
Clothing, footwear, and accessories accounted for the largest market share at 22.88% in 2025. Food and grocery are projected to grow at a 13.06% CAGR through 2031, reflecting a shift in the global e-retail market toward frequent purchases and faster deliveries. Quick-commerce services have expanded from major cities to secondary urban areas, offering sub-30-minute deliveries and localized assortments that encourage habitual grocery top-ups. Omnichannel retailers use store networks and optimized dispatch routes to enable same-day and express deliveries, making groceries more convenient. Electronics and home appliances see steady replacement-driven demand, supported by installation services and warranty add-ons, while furniture and home décor focus on visualization tools and SKU adjustments to reduce return costs.
Essential categories have grown faster than discretionary ones as consumers adopt post-pandemic delivery habits. Food and groceries’ 13.06% CAGR is driven by dark-store optimization, efficient store-picking, and wallet-linked reordering, boosting order frequency and retention. Electronics pricing in India aligns with online channels due to domestic manufacturing incentives, reducing import volatility. Furniture compliance costs have risen due to stricter material disclosure rules, increasing time-to-market and overheads. Improved fit and sizing tools in apparel reduce returns, stabilizing margins, while grocery and personal care drive global e-retail market growth.


By Platform Type: Social Commerce Disrupts Incumbent Share
Marketplace platforms are projected to hold a 64.63% share in 2025, while social-commerce platforms are expected to grow at a 20.96% CAGR through 2031. This indicates a shift in the global e-retail market toward feed-led and creator-led discovery methods. Global players leverage fulfillment density, advertising products, and buyer protection to maintain their presence in major categories and monetize traffic through retail media. Social video formats reduce the gap from awareness to purchase with native checkout integrations, lowering bounce rates and encouraging episodic shopping. Direct-to-consumer brands are expanding via owned domains and embedded storefronts in social feeds, supported by checkout extensibility and identity-linked loyalty programs that boost repeat purchases. Omnichannel e-stores convert proximity into speed and trust by using stores as fulfillment hubs, ensuring delivery reliability during demand spikes.
Regulatory scrutiny on large marketplaces is setting fee structure boundaries in key markets, moderating growth at scale while newer formats expand. Social platforms are investing in trust, safety, seller onboarding, and content moderation to meet transparency requirements, enabling broader category participation with reduced risks. Startups face high customer acquisition costs as performance media becomes less precise, driving consolidation or partnerships with marketplaces. Compliance certifications and data controls in Europe add fixed costs, favoring larger platforms. Over the forecast period, creator commerce and marketplace depth are expected to coexist, with budgets allocated to channels linking identity to transactions and proving incremental value.
By Device: Ambient Commerce Via Connected Screens
Mobile devices accounted for 71.55% of transaction value in 2025, while connected TVs and smart devices grew rapidly at a 17.22% CAGR through 2031. This reflects a shift in the global e-retail market toward convenient, on-the-sofa purchases. Mobile conversions rivaled desktop conversions due to advancements like progressive web apps, one-tap wallets, and biometric authentication. Desktops and tablets remained essential for high-consideration purchases, particularly in electronics and furniture, where larger screens aided decision-making. App-based shoppers had higher lifetime value than mobile web users, benefiting from features like push notifications and native wallets. Connected TVs became direct-response platforms, enabling QR scans and instant add-to-cart actions tied to broadcast content.
Between 2026 and 2031, mobile growth is expected to stabilize as penetration peaks, while connected screens are projected to gain traction as households integrate shopping into entertainment. Voice assistants and IoT devices are enabling automated reorder suggestions for consumables, reducing reliance on manual searches. Appliance manufacturers are embedding shopping features into connected devices, creating retail opportunities at the point of consumption and shortening purchase times for staples. Policy frameworks on AI-driven purchases and privacy emphasize clear consent mechanisms within device ecosystems. The combination of device-initiated orders and entertainment-driven shopping is expanding the global e-retail market beyond traditional app and browser channels.
Geography Analysis
Asia-Pacific accounted for 59.78% of global e-retail value in 2025, driven by China’s extensive online retail base and India’s increasing penetration. The Middle East & Africa is projected to grow at a 16.60% CAGR from 2026 to 2031. In China, major platforms dominate GMV while aligning costs with domestic policies. India’s open-network digital commerce enhances volume through interoperable logistics and payments, benefiting small merchants. Southeast Asia’s growth is supported by stronger fulfillment duopolies and improved cross-border logistics. Japan and South Korea focus on profitability and service quality, maintaining steady single-digit growth.
North America holds a significant share of global e-retail, led by the United States with deep marketplace penetration and dense omnichannel networks. Amazon remains the largest online retailer, while Walmart’s online revenue grew in 2026 due to increased marketplace participation and faster services. Canada’s penetration improved in 2025 through platform investments and mobile checkout innovations. Mexico’s growth is driven by better logistics and payment integration, while United States duty threshold changes in 2025 impacted cross-border pricing for low-cost imports.
Europe contributes meaningfully to global GMV, with platforms optimizing unit economics under stricter sustainability and privacy regulations. Textile rules increase circularity standards, influencing fast-fashion assortments. Retailers expand into Southern Europe with localized strategies, supported by Iberian logistics hubs. GDPR enforcement strengthens consent management and data compliance. Western Europe’s growth remains modest, while Central and Southern Europe improve payment adoption and delivery reliability.
South America grows at double-digit rates, led by Brazil’s instant payments, which enhance financial access and marketplace liquidity. Payment-linked lending supports inventory expansion. Regional hubs and cross-docking address high costs outside capitals. Installment plans sustain online conversions in Argentina and neighboring markets. Growth depends on logistics investments and policy stability.
The Middle East & Africa sees rapid growth, with Gulf markets advancing digital payments and logistics. Regional and global players expand offerings, while localized payments and COD options attract new shoppers. Sub-Saharan Africa uses hybrid delivery models to address infrastructure gaps. South Africa leads with higher penetration, though power issues affect operations. Egypt’s 2024 platform taxation improves compliance but adds short-term friction.

Competitive Landscape
The global e-retail market is fragmented globally but shows concentrated leadership in individual countries. No single player holds a dominant global share, though some dominate locally. Key players enhance margins through logistics, payments, and retail media, while social platforms leverage creator economics and native checkout for impulse-driven demand. Omnichannel retailers rely on store-based fulfillment for same-day and next-day delivery, a challenge for online-only players without significant capital investment. Opportunities remain in embedded finance, recommerce, and SME-focused B2B ordering, as these areas lag consumer channels. Strategic focus now includes checkout and identity management, where compliance and adaptability drive adoption of monetization features.
New entrants scale quickly using capital-light models and regulatory advantages, such as consignment-based cross-border selling that reduces inventory risks. Category specialists address specific challenges like fit, authentication, and delivery issues, minimizing returns and sustaining margins. Compliance costs in regulated markets like Europe favor established players with strong governance and data protection. Investments in anticipatory logistics and AI-driven inventory management aim to reduce delays and improve availability, boosting sales during peak periods. Between 2026 and 2031, market dynamics are expected to shift, with logistics efficiency, first-party data, and media-commerce integration becoming critical.
High customer acquisition costs and adjusted acquisition multiples are driving smaller DTC brands to seek exits or join multi-brand operators. Social commerce platforms are improving trust and safety measures to expand cross-border offerings and reduce fraud. Marketplaces are enhancing seller tools and fee structures to improve selection and service guarantees. Logistics providers are expanding warehousing in key areas to mitigate disruptions and accelerate cross-border parcel handling. Operators with profitable unit economics and robust first-party data are well-positioned to grow their market share as capital flows stabilize.
E-Retail Industry Leaders
Amazon.com Inc.
Alibaba Group (incl. Taobao & Tmall)
JD.com Inc.
Walmart Inc.
eBay Inc.
- *Disclaimer: Major Players sorted in no particular order

Recent Industry Developments
- February 2026: JD.com and the Future Investment Initiative (FII) Institute have formed a three-year strategic partnership to drive innovation and digital transformation in global logistics and supply chains. The collaboration integrates FII's global platform with JD.com's advanced logistics and smart infrastructure to deliver efficient and sustainable supply chain solutions. The partnership focuses on key growth markets, particularly in the Middle Eastern and African expansion corridors.
- January 2026: JD.com has partnered with the China-Britain Business Council to launch its Joybuy online retail platform in the UK by March 2026. The company plans to invest in warehousing and delivery infrastructure through JoyExpress, marking its first entry into a major European market.
- August 2025: Walmart introduced new marketplace seller features, including AI-powered listing tools, reduced referral fees, and expanded next-day delivery via Walmart Fulfillment Services in major United States cities. The initiative seeks to attract third-party sellers by enhancing their economic benefits and market reach.
- August 2025: JD Logistics opened its Dubai No.5 Warehouse in Jebel Ali Free Zone, UAE, spanning over 10,000 square meters. This facility, the ninth overseas in the Middle East, provides integrated warehousing services for Chinese electronics companies distributing to the UAE and Saudi Arabia.


Global E-Retail Market Report Scope
The Global E-Retail industry encompasses online retail platforms and digital commerce channels serving consumers worldwide. The market is segmented by product categories (home appliances & electronics, clothing & accessories, food & personal care, furniture & décor, others), platform type (marketplace platforms, D2C brand stores, omnichannel e-stores, subscription/flash-sales, social-commerce), device (mobile, desktop & tablet, connected TV & smart devices, others), and geography (North America, South America, Europe, Asia-Pacific, Middle East & Africa). The report identifies market drivers (smartphone adoption, secure payments, logistics expansion, convenience demand, social-commerce, AI personalization) and restraints (cybersecurity concerns, rural delivery costs, carbon-footprint regulations, cookieless ad targeting). It examines the regulatory landscape, technological advancements, supply-chain dynamics, and competitive intensity using Porter’s Five Forces. The study provides market size and value (USD) forecasts for all segments, along with company profiles, strategic moves, and opportunities such as embedded finance, BNPL monetization, and circular-commerce platforms.
| Home Appliances & Electronics |
| Clothing, Footwear & Accessories |
| Food & Personal Care |
| Furniture & Home Décor |
| Other Products |
| Marketplace Platforms |
| Direct-to-Consumer Brand Stores |
| Omnichannel Retailer E-Stores |
| Subscription & Flash-Sales Platforms |
| Social-Commerce Platforms |
| Mobile |
| Desktop & Tablet |
| Connected TV & Smart Devices |
| Others |
| North America | Canada |
| United States | |
| Mexico | |
| South America | Brazil |
| Peru | |
| Chile | |
| Argentina | |
| Rest of South America | |
| Europe | United Kingdom |
| Germany | |
| France | |
| Spain | |
| Italy | |
| BENELUX (Belgium, Netherlands, Luxembourg) | |
| NORDICS (Denmark, Finland, Iceland, Norway, Sweden) | |
| Rest of Europe | |
| Asia-Pacific | India |
| China | |
| Japan | |
| Australia | |
| South Korea | |
| South-East Asia (SG, MY, TH, ID, VN, PH) | |
| Rest of Asia-Pacific | |
| Middle East & Africa | United Arab Emirates |
| Saudi Arabia | |
| South Africa | |
| Nigeria | |
| Rest of Middle East & Africa |
| By Product | Home Appliances & Electronics | |
| Clothing, Footwear & Accessories | ||
| Food & Personal Care | ||
| Furniture & Home Décor | ||
| Other Products | ||
| By Platform Type | Marketplace Platforms | |
| Direct-to-Consumer Brand Stores | ||
| Omnichannel Retailer E-Stores | ||
| Subscription & Flash-Sales Platforms | ||
| Social-Commerce Platforms | ||
| By Device | Mobile | |
| Desktop & Tablet | ||
| Connected TV & Smart Devices | ||
| Others | ||
| By Geography | North America | Canada |
| United States | ||
| Mexico | ||
| South America | Brazil | |
| Peru | ||
| Chile | ||
| Argentina | ||
| Rest of South America | ||
| Europe | United Kingdom | |
| Germany | ||
| France | ||
| Spain | ||
| Italy | ||
| BENELUX (Belgium, Netherlands, Luxembourg) | ||
| NORDICS (Denmark, Finland, Iceland, Norway, Sweden) | ||
| Rest of Europe | ||
| Asia-Pacific | India | |
| China | ||
| Japan | ||
| Australia | ||
| South Korea | ||
| South-East Asia (SG, MY, TH, ID, VN, PH) | ||
| Rest of Asia-Pacific | ||
| Middle East & Africa | United Arab Emirates | |
| Saudi Arabia | ||
| South Africa | ||
| Nigeria | ||
| Rest of Middle East & Africa | ||


Key Questions Answered in the Report
What is the current size and growth outlook of the global e-retail market?
The global e-retail market size is USD 4.08 trillion in 2026 and is projected to reach USD 5.52 trillion by 2031 at a 6.22% CAGR, reflecting normalized but durable expansion across regions.
Which product categories lead and which are growing fastest in global e-retail?
Clothing, footwear, and accessories led with 22.88% share in 2025, while food and grocery is the fastest-growing category at a 13.06% CAGR through 2031, driven by quick-commerce and omnichannel fulfillment.
Which platforms and devices are shaping buying behavior in global e-retail?
Marketplaces held 64.63% share in 2025, social-commerce platforms are growing fastest at 20.96% CAGR, mobile accounted for 71.55% of transactions, and connected TV is the fastest-rising device segment at 17.22% CAGR through 2031.
Which regions lead global e-retail and where is growth strongest?
Asia-Pacific held 59.78% of 2025 value and the Middle East & Africa is the fastest-growing region at 16.60% CAGR over 2026-2031 due to digital payments expansion and logistics investment.
What are the top operational challenges facing e-retailers?
The most cited challenges are cybersecurity and privacy compliance, high last-mile costs in rural areas, sustainability-driven returns policies, and reduced ad-targeting accuracy in a cookieless environment.
How are retailers adapting to privacy changes and rising acquisition costs?
Retailers are investing in first-party data, retail media, checkout extensibility, and loyalty ecosystems to maintain addressability and to prove incrementality as third-party cookies phase out.
Page last updated on:


