Saudi Arabia Data Center Power Market Size and Share
Market Overview
| Study Period | 2020 - 2031 |
|---|---|
| Forecast Data Period | 2026 - 2031 |
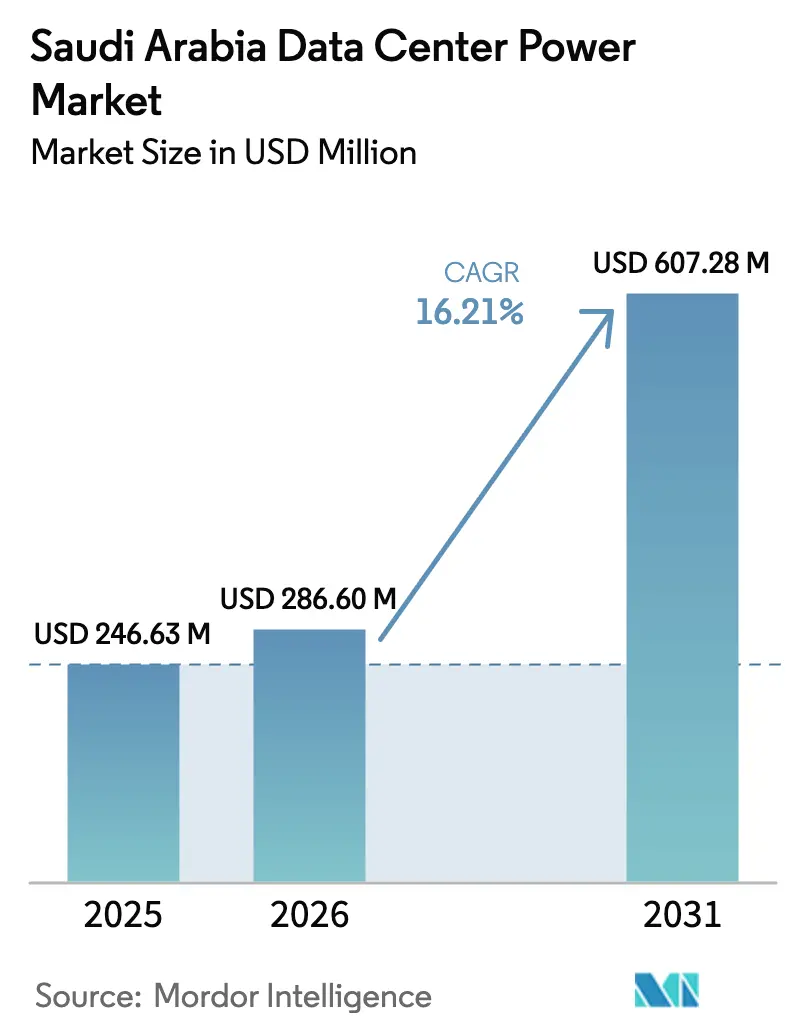
| Base Year Market Size (2025) | USD 246.63 Million |
| Market Size (2026) | USD 286.6 Million |
| Market Size (2031) | USD 607.28 Million |
| Growth Rate (2026 - 2031) | 16.21% CAGR |
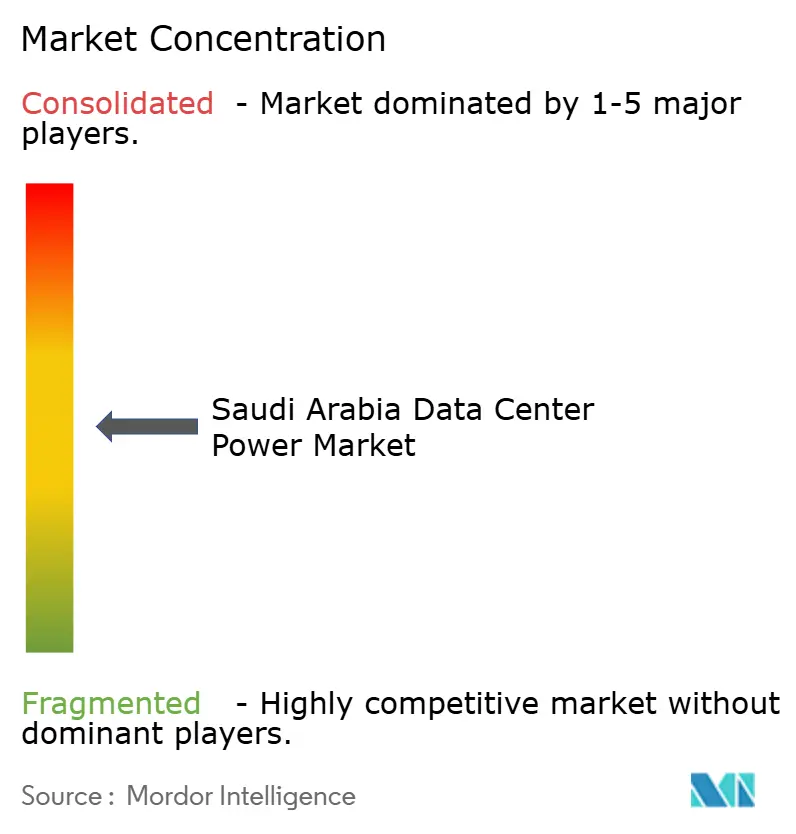
| Market Concentration | Medium |
Major Players *Disclaimer: Major Players sorted in no particular order Image © Mordor Intelligence. Reuse requires attribution under CC BY 4.0. | |
Saudi Arabia Data Center Power Market Analysis by Mordor Intelligence
The Saudi Arabia data center power market size is expected to grow from USD 246.63 million in 2025 to USD 286.6 million in 2026 and is forecast to reach USD 607.28 million by 2031 at 16.21% CAGR over 2026-2031. Vision 2030’s digital-infrastructure program, electricity pricing of USD 0.05/kWh, and more than USD 18 billion in announced hyperscaler projects are accelerating facility construction. Rising renewable-energy capacity, streamlined 2024 licensing rules, and the shift from VRLA to lithium-ion UPS strings are lowering operating expenses and improving uptime. Global vendors are securing local alliances to serve hyperscaler demand, while domestic manufacturing pacts aim to ease copper and battery shortages. Tier IV designs are gaining traction because AI workloads require 99.995% availability, and high-density racks above 30 kW are pushing operators toward modular 1.25 MW UPS frames. These trends position the Saudi Arabia data center power market as a regional benchmark for efficient, climate-aligned power architectures.
Key Report Takeaways
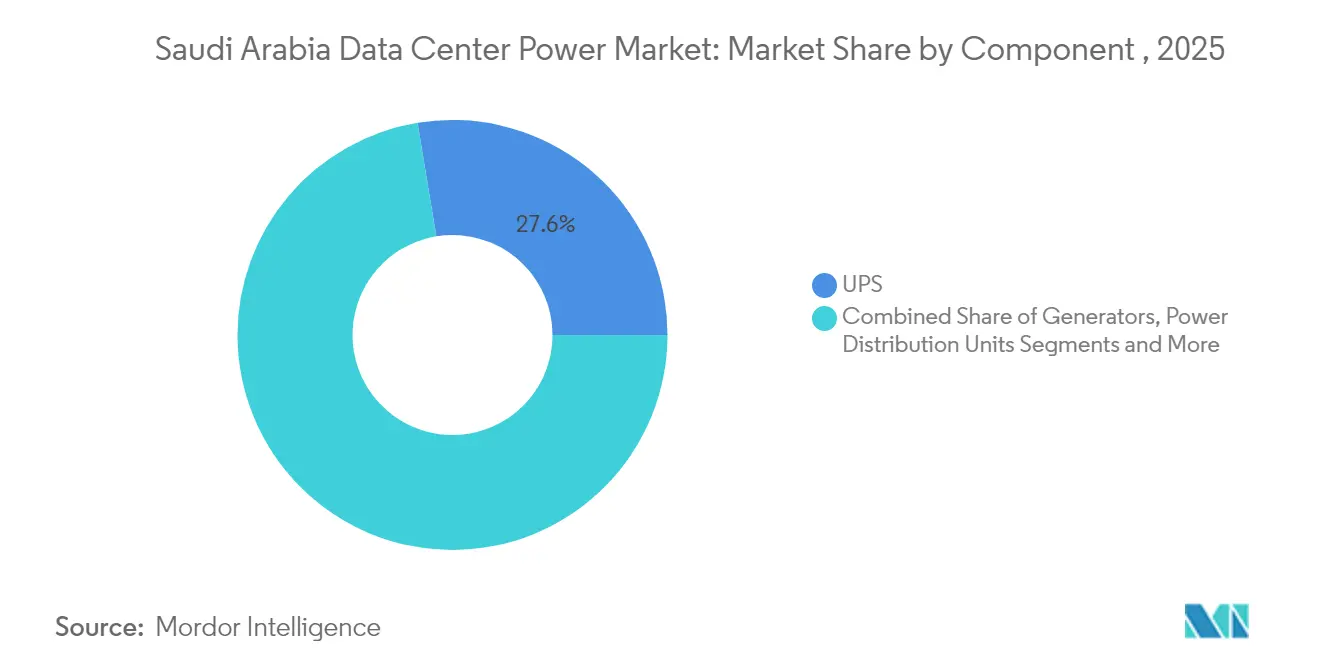
- By component, UPS systems led with 27.60% of the Saudi Arabia data center power market share in 2025, while power distribution units are forecast to grow at an 17.88% CAGR to 2031.
- By data-center type, colocation providers accounted for 51.90% of the Saudi Arabia data center power market size in 2025; hyperscale/cloud service providers are projected to expand at a 16.55% CAGR during 2026-2031.
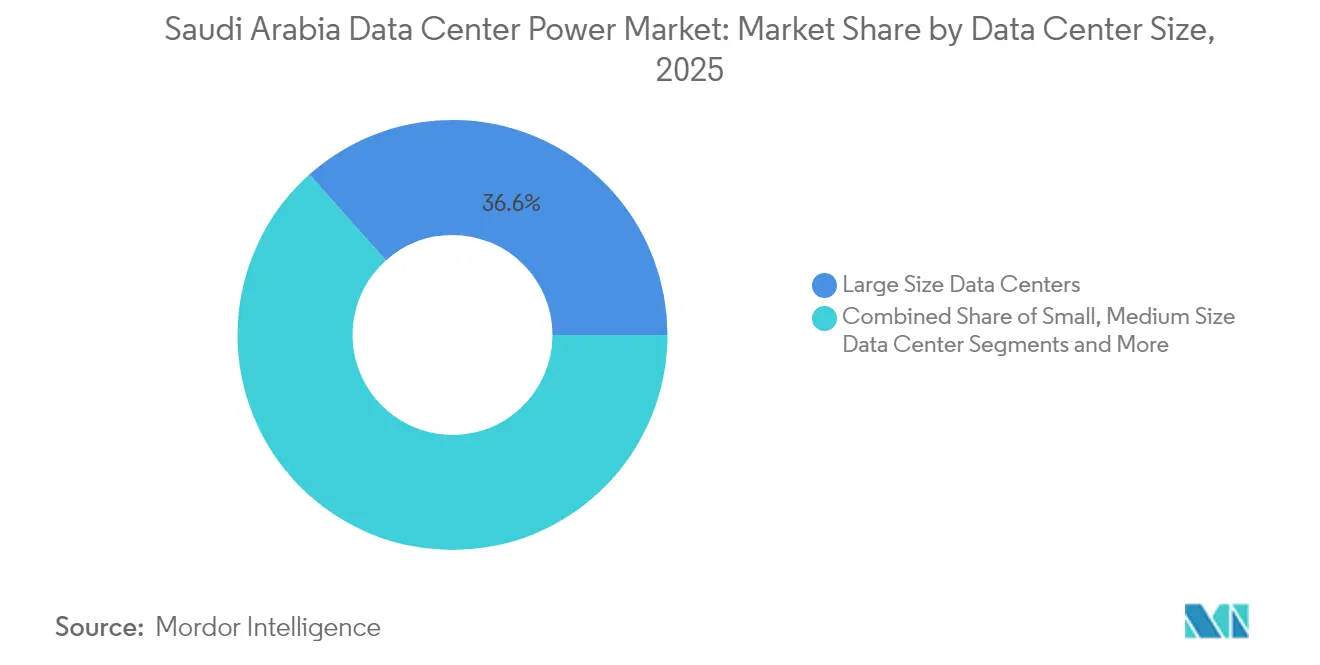
- By size, large facilities held 36.60% share of the Saudi Arabia data center power market size in 2025; mega facilities are expected to register a 16.84% CAGR through 2031.
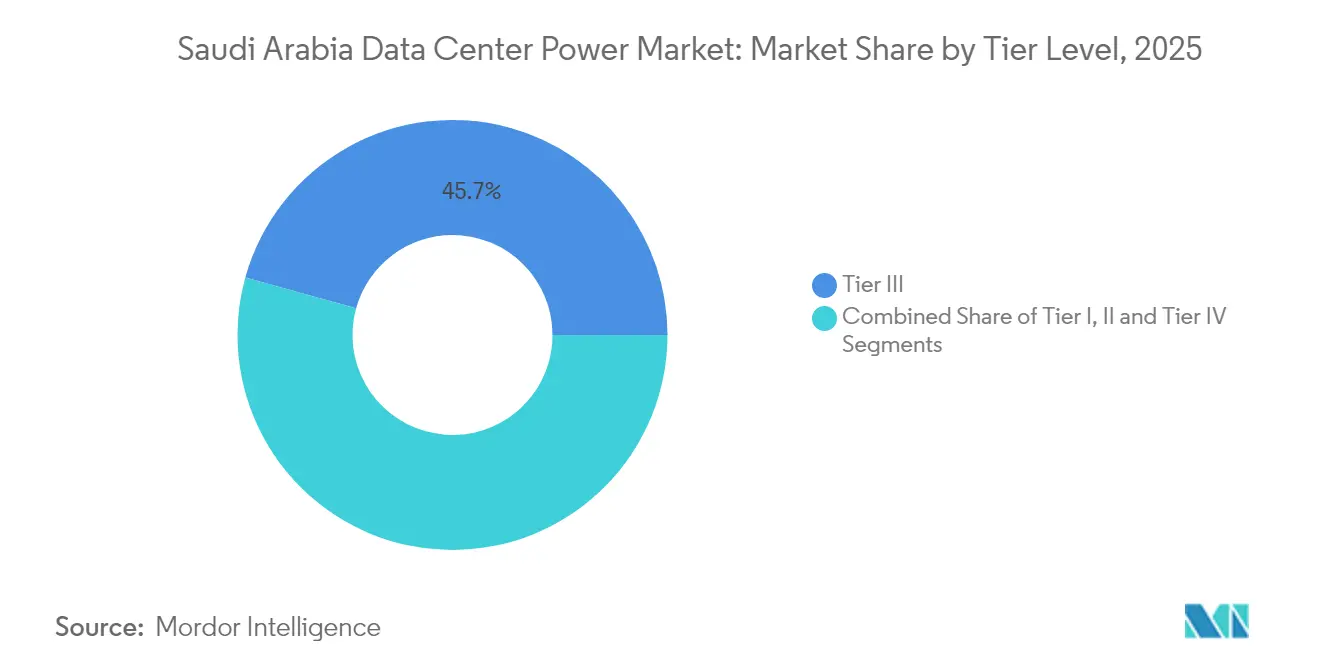
- By tier level, Tier III captured 45.70% share in 2025, but Tier IV is the fastest-growing category with an 18.22% CAGR.
Note: Market size and forecast figures in this report are generated using Mordor Intelligence’s proprietary estimation framework, updated with the latest available data and insights as of 2026.
Saudi Arabia Data Center Power Market Trends and Insights
Drivers Impact Analysis*
| Driver | (~) % Impact on CAGR Forecast | Geographic Relevance | Impact Timeline |
|---|---|---|---|
| Adoption of hyperscale & cloud facilities | +4.2% | Riyadh, Jeddah, Dammam | Medium term (2-4 years) |
| Vision 2030 digital-transformation push | +3.8% | NEOM, Red Sea Project | Long term (≥ 4 years) |
| Need to cut OPEX via high-efficiency power gear | +2.1% | Nationwide large facilities | Short term (≤ 2 years) |
| Hyperscaler FDI inflows (AWS, Google, Microsoft) | +3.5% | Major urban centers | Medium term (2-4 years) |
| Low-cost renewable PPAs enabling green power | +2.3% | Solar-rich provinces | Long term (≥ 4 years) |
| Demand-response revenue for backup assets | +1.6% | Grid-connected sites | Medium term (2-4 years) |
| Source: Mordor Intelligence | |||
Adoption of hyperscale & cloud facilities
Racks exceeding 30 kW demand 1.25 MW UPS frames with 99% efficiency, such as Schneider Electric’s Galaxy VXL, enabling Gulf Data Hub to keep PUE below 1.3 across its planned 240 MW campus. [1]Vertiv Press Office, “Gulf Data Hub Selects Vertiv UPS Systems for 240 MW Campus,” vertiv.comAWS’s USD 5.3 billion build-out and Microsoft’s multi-site schedule confirm the strategic pivot toward hyperscale footprints. Higher densities are cascading into specialized switchgear, direct-to-chip liquid cooling, and large-scale battery arrays that sustain AI algorithms at full load. This shift drives incremental revenue for local installers who integrate modular power blocks on compressed timelines. As a result, the Saudi Arabia data center power market is becoming the preferred testbed for next-generation high-density architectures.
Vision 2030 digital-transformation push
The Saudi Data & AI Authority enforces data-governance rules that are intertwined with power-system design because operators must add continuous monitoring and secure-by-design architectures. NEOM’s fully renewable 4 GW grid, coupled with plans for 1.2 million t/y of green hydrogen, showcases how national energy policy and data-center strategy align. [2]NEOM Media Relations, “DataVolt and NEOM to Build 1.5 GW AI-Driven Data Center,” neom.com Government targets of 58.7 GW renewable capacity by 2030 anchor long-term demand for inverters, smart switchgear, and hydrogen-ready generators. The rollout of smart-city districts in Riyadh and Jeddah further accelerates edge-facility deployment, creating new clusters inside the Saudi Arabia data center power market landscape.
Need to cut OPEX via high-efficiency power gear
Lithium-ion UPS strings lower total cost of ownership by 39% over a decade, offsetting higher capital outlays by shrinking cooling load, floor space, and replacement cycles.[3]Eaton Corporation, “Lithium-Ion UPS Lowers Total Cost of Ownership,” eaton.com Real-time DCIM suites now predict component failure, saving operators more than USD 100,000 per hour of avoided downtime. Battery energy storage systems are displacing diesel in N+1 designs, trimming fuel logistics and aligning with upcoming 2027 emission norms. The focus on granular metering helps colocation operators offer power-usage dashboards that satisfy tenant sustainability audits, reinforcing the Saudi Arabia data center power market leadership in OPEX discipline.
Hyperscaler FDI inflows (AWS, Google, Microsoft)
Foreign investors import rigorous templates that require Tier IV, N+1 redundancy across every power path and efficiency floors above 99%. Local component makers seeking qualification must adopt ISO-certified processes, stimulating technology transfer and job creation. Google Cloud’s workforce-training track, alongside Microsoft’s Data Center Academy, is expanding the domestic talent pool for high-voltage maintenance. These spillover benefits accelerate local content compliance while broadening the vendor base within the Saudi Arabia data center power market.
Restraints Impact Analysis*
| Restraint | (~) % Impact on CAGR Forecast | Geographic Relevance | Impact Timeline |
|---|---|---|---|
| High CAPEX & maintenance costs | -2.8% | Smaller operators nationwide | Short term (≤ 2 years) |
| Grid interconnection & permitting delays | -1.9% | New development zones | Medium term (2-4 years) |
| Shortage of Tier IV-skilled power engineers | -1.5% | Emerging tech hubs | Long term (≥ 4 years) |
| Upcoming diesel-emission curbs (2027) | -1.2% | Backup-power fleets | Medium term (2-4 years) |
| Source: Mordor Intelligence | |||
High CAPEX & maintenance costs
Lithium-ion packs cost two to three times more upfront than VRLA, while copper price spikes have lifted transformer quotes by up to 25% since 2024. Lead times for gas turbines now exceed 24 months, delaying go-live schedules for mid-market projects. Smaller operators lacking scale find it difficult to negotiate bulk discounts or service contracts, which prolongs payback periods and chills new entries into the Saudi Arabia data center power market.
Grid interconnection & permitting delays
Multi-agency reviews often stretch beyond 18 months, especially for high-voltage tie-ins in NEOM and Red Sea economic zones. Cyber-security mandates introduced in 2024 add an extra data-protection audit before connection, and environmental impact assessments for renewable co-location remain stringent. These bottlenecks defer revenue recognition and undermine project IRR, moderating growth within the Saudi Arabia data center power market in the medium term.
*Our forecasts treat driver/restraint impacts as directional, not additive. The impact forecasts reflect baseline growth, mix effects, and variable interactions.
Segment Analysis
By Component: UPS systems anchor reliability
UPS strings retained 27.60% of the Saudi Arabia data center power market in 2025 by revenue and continue to dominate refresh budgets. Lithium-ion adoption is rising because operators report 97% less replacement labor and 50% lower weight per kVA. Generators still underpin critical backup, but hydrogen-ready sets are entering pilot trials in NEOM. Switchgear and transfer switches hold steady demand as Tier IV configurations proliferate. Power distribution units posted the fastest 17.88% CAGR and integrate branch-circuit metering that feeds AI-based load-balancing platforms. Service lines installation, maintenance, training benefit from a skills gap that operators fill through multi-year support contracts. As power densities climb, remote-power panels and modular busways allow phased migration without service interruption, reinforcing spending resilience across the Saudi Arabia data center power market.


By Data Center Type: colocation dominance under pressure
Colocation sites captured 51.90% of the Saudi Arabia data center power market in 2025 by revenue but see share dilution as hyperscalers roll out dedicated campuses. Hyperscale/cloud service providers will log a 16.55% CAGR to 2031, driven by AI training clusters that require power densities above 30 kW/rack and contiguous land for 100 MW phases. Enterprise and edge facilities remain relevant for data-sovereignty and low-latency workloads, especially in financial hubs. Colocation operators respond with build-to-suit suites and bring-your-own-battery contracts that mirror hyperscaler efficiency.
Hyperscalers favor renewable power purchase agreements, often bundling 15-year solar hedges with on-site 100 MWh battery blocks. This model compresses power cost variability and sets a new baseline for the Saudi Arabia data center power market. Edge deployments in outer Riyadh suburbs now host content-delivery nodes under 500 kW, broadening the addressable base for micro-UPS and modular generators.
By Data Center Size: mega facilities set the pace
Large sites delivered 36.60% of 2025 revenue, yet mega facilities defined as 20-60 MW builds will see the highest 16.84% CAGR. Operators prefer 36-rack prefabricated modules that reduce build durations by 40%. The Saudi Arabia data center power market size for mega campuses is projected to exceed USD 255.4 million by 2031, buoyed by DataVolt’s 1.5 GW plan in NEOM. Small and medium sites retain importance for regional backups and regulated workloads, but cost per MW favors scaling up. Massive facilities above 60 MW are rare, confined to specialized exascale computing.
Mega sites pull through larger generator blocks, four-circuit switchgear rooms, and chilled-water batteries, unlocking volume discounts that tilt vendor competition toward turnkey bundles. Smaller facilities counter by offering rack-level liquid cooling and quick-connect lithium-ion cabinets.
By Tier Level: Tier IV adoption accelerates
Tier III remained the most common standard but lost share to Tier IV’s 18.22% CAGR. Hyperscale cloud zones demand concurrent maintainability across every subsystem, prompting twin power corridors and ring bus architectures. The Saudi Arabia data center power market size for Tier IV projects is slated to top USD 315.8 million by 2031. Tier I and II sites shrink as workloads migrate to multi-tenant clouds. Aggreko’s roll-out of battery-supported Tier IV Final rental gensets in Riyadh showcases how service providers address tight construction schedules and emission caps.
Tier IV sites typically deploy 2N+1 UPS layouts, quadrupling battery counts versus Tier III and producing significant opportunities for local fabrication of lithium-ion racks. Training demand for certified Tier IV electricians grows in parallel and spawns joint programs between vendors and technical colleges.
Geography Analysis
Riyadh concentrates the largest share of hyperscaler capital, leveraging mature fiber routes and proximity to regulators. Jeddah benefits from submarine-cable landings and lower coastal temperatures that trim chiller loads by 2-4 %. Dammam clusters around petrochemical plants where waste heat can be recovered to power absorption chillers, cutting effective PUE. NEOM’s greenfield zone champions fully renewable 1.5 GW architectures, turning the spotlight on hydrogen-capable gas turbines and smart MV switchgear. King Abdullah Economic City reduces interconnection timeframes to nine months for pre-qualified applicants, an advantage over the 18-month national average.
Solar yields averaging 2,200 kWh/m²/year offer compelling economics for behind-the-meter installations, especially where land banks are available. The eastern region’s heavy-industry grid is robust, allowing 120 MVA taps with minimal reinforcements, which appeals to HPC miners seeking short delivery cycles. Western coastal humidity challenges battery ventilation, encouraging operators to adopt pressurized lithium-ion cabinets
Competitive Landscape
Global OEMs such as Schneider Electric, Vertiv, ABB, and Eaton compete alongside regional specialists that focus on installation and aftermarket services. Vertiv’s tie-up with Gulf Data Hub secured multi-phase modular UPS orders, reflecting a partnership model that accelerates delivery while transferring know-how. Schneider Electric localizes Galaxy VXL assembly to qualify under local-content thresholds, reducing lead times by six weeks. ABB leverages digital twin software to guarantee 10-year uptime metrics, a differentiator in Tier IV bidding.
Domestic players engage through JV structures, highlighted by the USD 666 million MIS-BSF Capital deal aimed at scaling transformer and switchgear output. This initiative counters global copper shortages and keeps pricing predictable for hyperscale roadmaps. Eaton’s “Data Center as a Grid” concept unlocks demand-response revenue, a service bundled with its UPS rentals that permits facilities to export up to 20% of stored energy during peak periods.
Saudi Arabia Data Center Power Industry Leaders
Schneider Electric SE
ABB Ltd
Vertiv Group Corp.
Eaton Corporation plc
Caterpillar Inc.
- *Disclaimer: Major Players sorted in no particular order

Recent Industry Developments
- February 2025: Saudi Arabia began construction of a 2.5 GW grid-scale battery energy storage system valued at SAR 6.73 billion (USD 1.8 billion) to bolster reserve margins.
- February 2025: NEOM and DataVolt unveiled a USD 5 billion plan for a 1.5 GW AI-focused data center in Oxagon, targeting an operational launch in 2028.
- February 2025: Schneider Electric introduced the Galaxy VXL UPS platform rated at 1.25 MW with 99% eConversion efficiency; 9,000 units are slated for 2025 production.
- September 2024: MIS and BSF Capital closed a USD 666 million infrastructure deal to upgrade power and cooling across multiple Saudi facilities.


Research Methodology Framework and Report Scope
Market Definitions and Key Coverage
Our study frames the Saudi Arabia data center power market as all revenue generated inside the Kingdom from electrical solutions, UPS systems, generators, switchgear, PDUs, transfer switches, remote power panels, and energy-storage-linked systems, together with associated installation, maintenance, and training services that keep purpose-built data centers online. We, the analysts, size spend in US-dollar terms and track facilities across colocation, hyperscale/cloud, and enterprise or edge environments.
Scope exclusion: residential server rooms and telecom central-office power gear remain outside this assessment.
Segmentation Overview
- By Component
- Electrical Solutions
- UPS Systems
- Generators
- Diesel Generators
- Gas Generators
- Hydrogen Fuel-cell Generators
- Power Distribution Units
- Switchgear
- Transfer Switches
- Remote Power Panels
- Energy-storage Systems
- Service
- Installation and Commissioning
- Maintenance and Support
- Training and Consulting
- Electrical Solutions
- By Data Center Type
- Hyperscaler/Cloud Service Providers
- Colocation Providers
- Enterprise and Edge Data Center
- By Data Center Size
- Small Size Data Centers
- Medium Size Data Centers
- Large Size Data Centers
- Massive Size Data Centers
- Mega Size Data Centers
- By Tier Level
- Tier I and II
- Tier III
- Tier IV
Detailed Research Methodology and Data Validation
Primary Research
Multiple touchpoints with facility engineers, EPC contractors, and power-gear OEM managers across Riyadh, Jeddah, and Dammam validated load assumptions, price spreads, and commissioning timelines. Interviews also clarified how Vision 2030 incentives are altering purchase cycles, letting us reconcile secondary trends with on-ground reality.
Desk Research
Mordor's team consulted public datasets from the Communications, Space & Technology Commission, Ministry of Energy electricity-tariff filings, Saudi General Authority for Statistics trade codes, and customs import logs that detail HS-level flows of UPS frames and diesel gen-sets. Company filings, investor presentations, and reputable press archives retrieved via Dow Jones Factiva and D&B Hoovers offered further pricing and project leads. Standards from The Uptime Institute, insights from the GCC Interconnection Authority, and patent traces on Questel helped us benchmark tier design choices and lithium-ion adoption. These references illustrate, not exhaust, the desk sources considered.
Market-Sizing & Forecasting
A top-down reconstruction started with installed IT load (MW) and average power-infrastructure cost per MW; these values were derived from project disclosures and tariff-adjusted BOM benchmarks, then multiplied to reach the 2024 baseline. Supplier roll-ups and sampled ASP × volume checks offered a selective bottom-up lens before totals were fixed. Key variables like rack density migration, lithium-ion share, diesel-to-gas generator mix, hyperscale capex cadence, and tier-IV penetration drive the model. Multivariate regression links those inputs to spend, while scenario analysis handles tariff reforms and renewable PPAs. Gaps in vendor shipment data are bridged with regionally averaged margins discussed during primary calls.
Data Validation & Update Cycle
Outputs pass variance screens against historical electric-equipment imports and regional tender awards; anomalies trigger re-engagement with sources before sign-off. Reports refresh each year, and interim updates follow material project awards, ensuring clients receive an up-to-date baseline.
Why Our Saudi Arabia Data Center Power Baseline Earns Trust
Published estimates often diverge because firms pick different cost stacks, timing cut-offs, and refresh cadences.
Key gap drivers include: some studies bundle cooling or cabling spend, others omit services, and several freeze their models at announced rather than committed projects, whereas Mordor analysts revisit pipeline status each quarter and convert values using the prevailing SAR-USD midpoint.
Benchmark comparison
| Market Size | Anonymized source | Primary gap driver |
|---|---|---|
| USD 246.63 M (2025) | Mordor Intelligence | - |
| USD 263.17 M (2024) | Regional Consultancy A | Bundles cable-trays and cooling modules, uses 2024 base |
| USD 130.10 M (2024) | Trade Journal B | Captures capex on electrical equipment only, excludes services and mega-projects |
| USD 104.24 M (2024) | Industry Association C | Focuses solely on UPS spend, omits generators and PDUs |
These comparisons show that once scope and project-status filters are aligned, Mordor's figure sits mid-band, offering decision-makers a balanced and transparently sourced starting point.


Key Questions Answered in the Report
What is driving the rapid growth of the Saudi Arabia data center power market?
Vision 2030 incentives, low electricity prices, and USD 18 billion in hyperscaler commitments are the main contributors to its 16.21% CAGR.
Which component segment leads revenue?
UPS systems hold the top position with 27.60% revenue share because they safeguard uptime for mission-critical workloads
Why are Tier IV facilities expanding faster than other tiers?
AI and cloud workloads require 99.995% availability, prompting operators to adopt Tier IV N+1 redundancy across all power paths.
How do renewable PPAs benefit data-center power economics?
Solar contracts at USD 0.0104/kWh allow operators to lock in low rates and meet sustainability goals without compromising reliability.
Page last updated on:


