Sarcoma Drugs Market Size and Share
Market Overview
| Study Period | 2020 - 2031 |
|---|---|
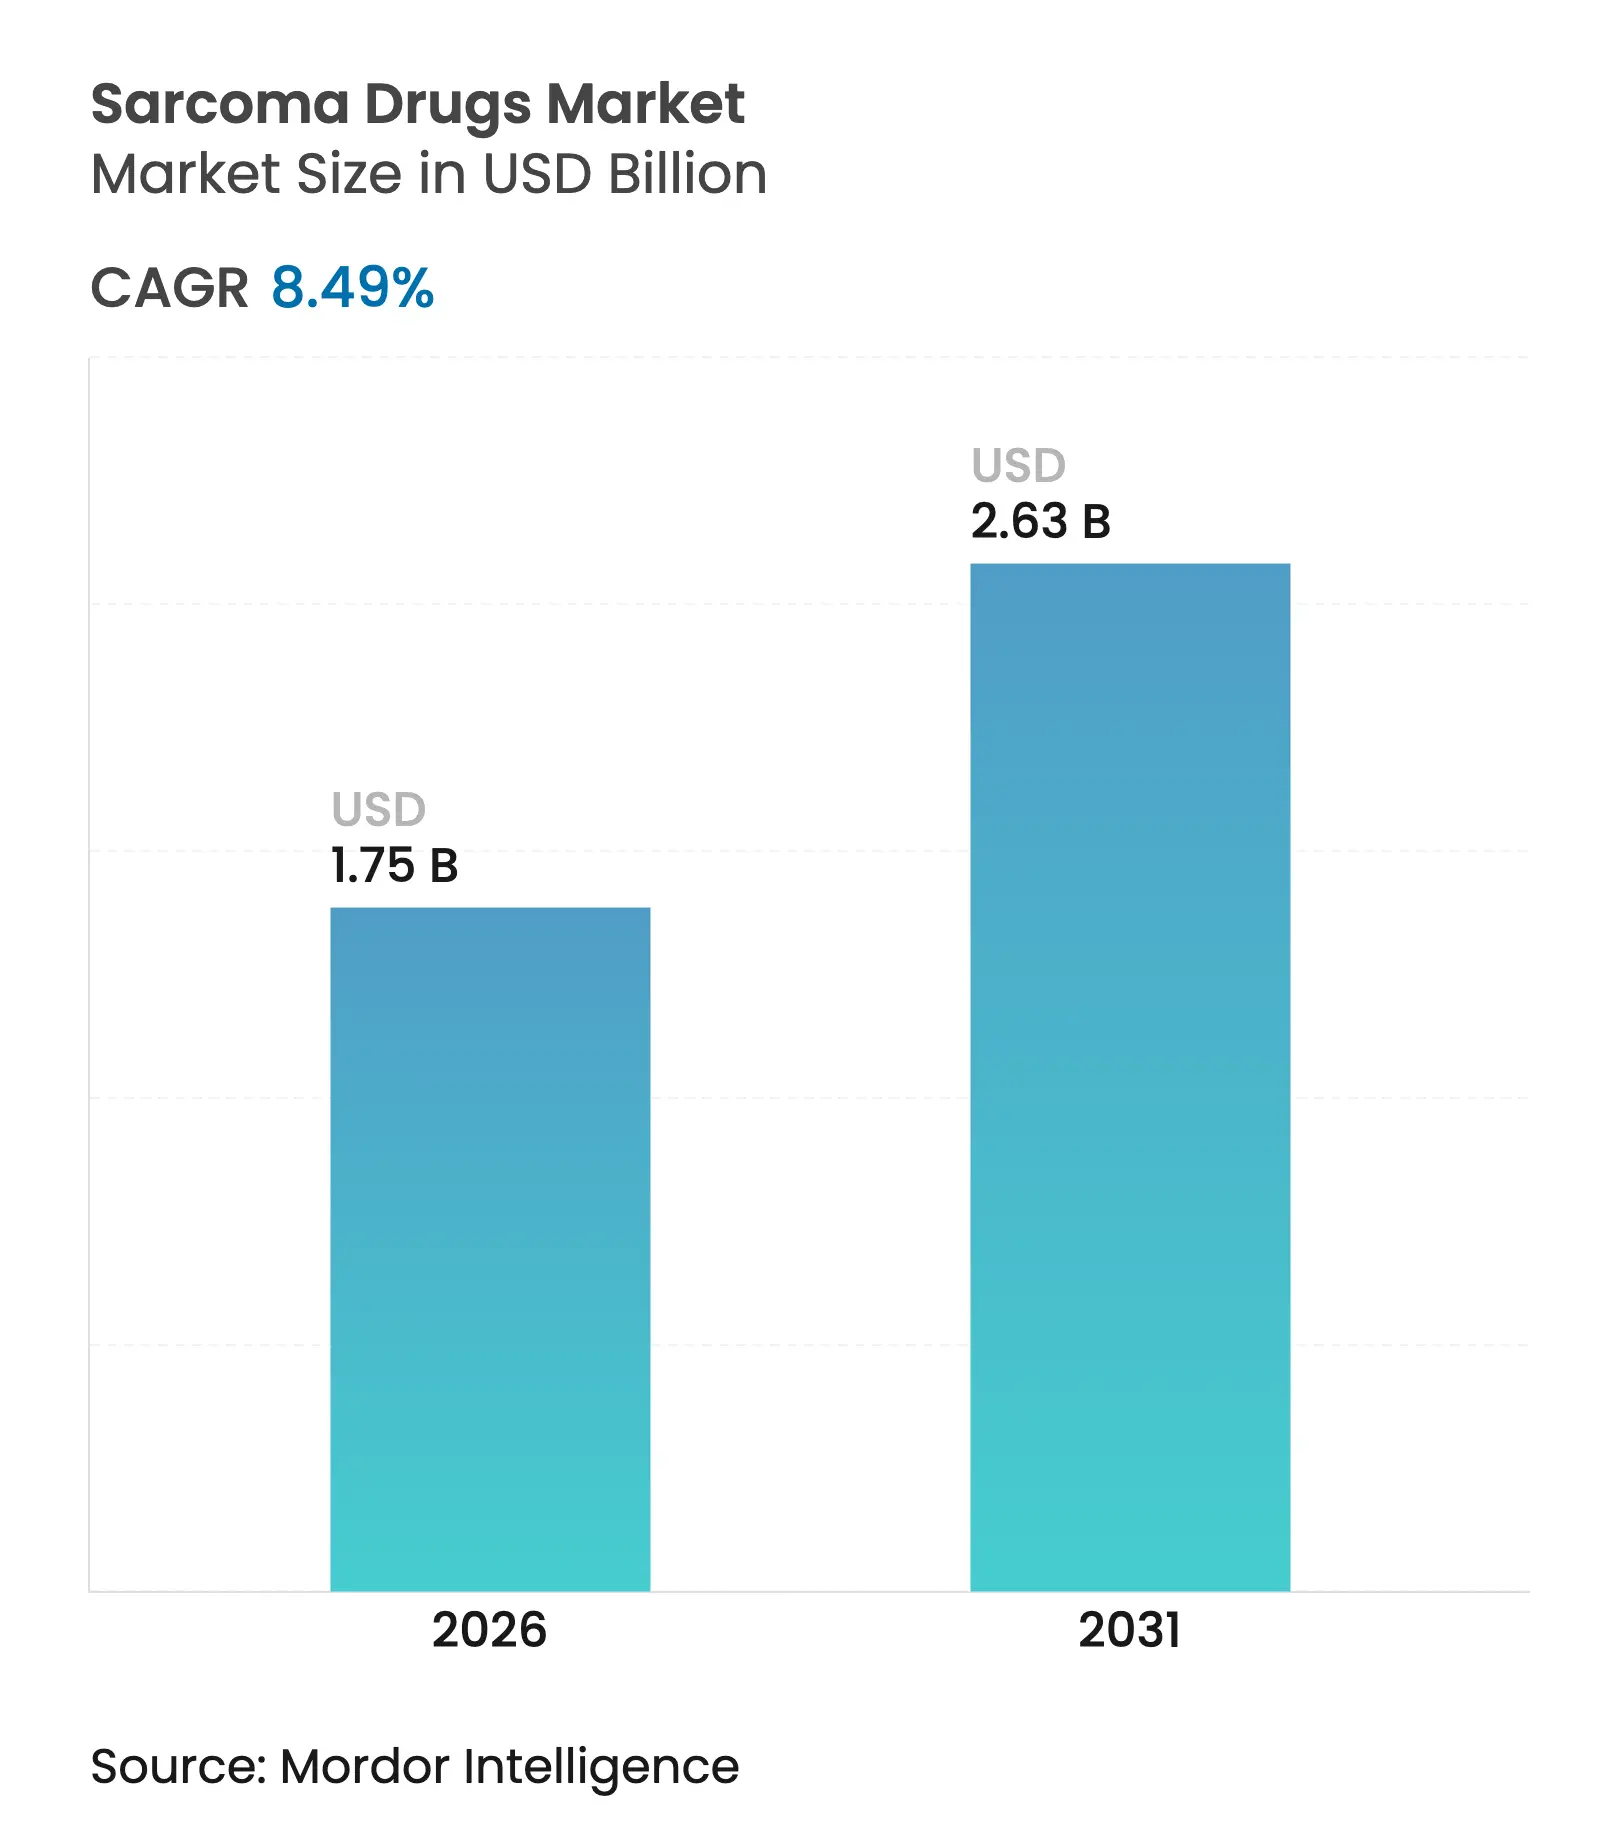
| Market Size (2026) | USD 1.75 Billion |
| Market Size (2031) | USD 2.63 Billion |
| Growth Rate (2026 - 2031) | 8.49 % CAGR |
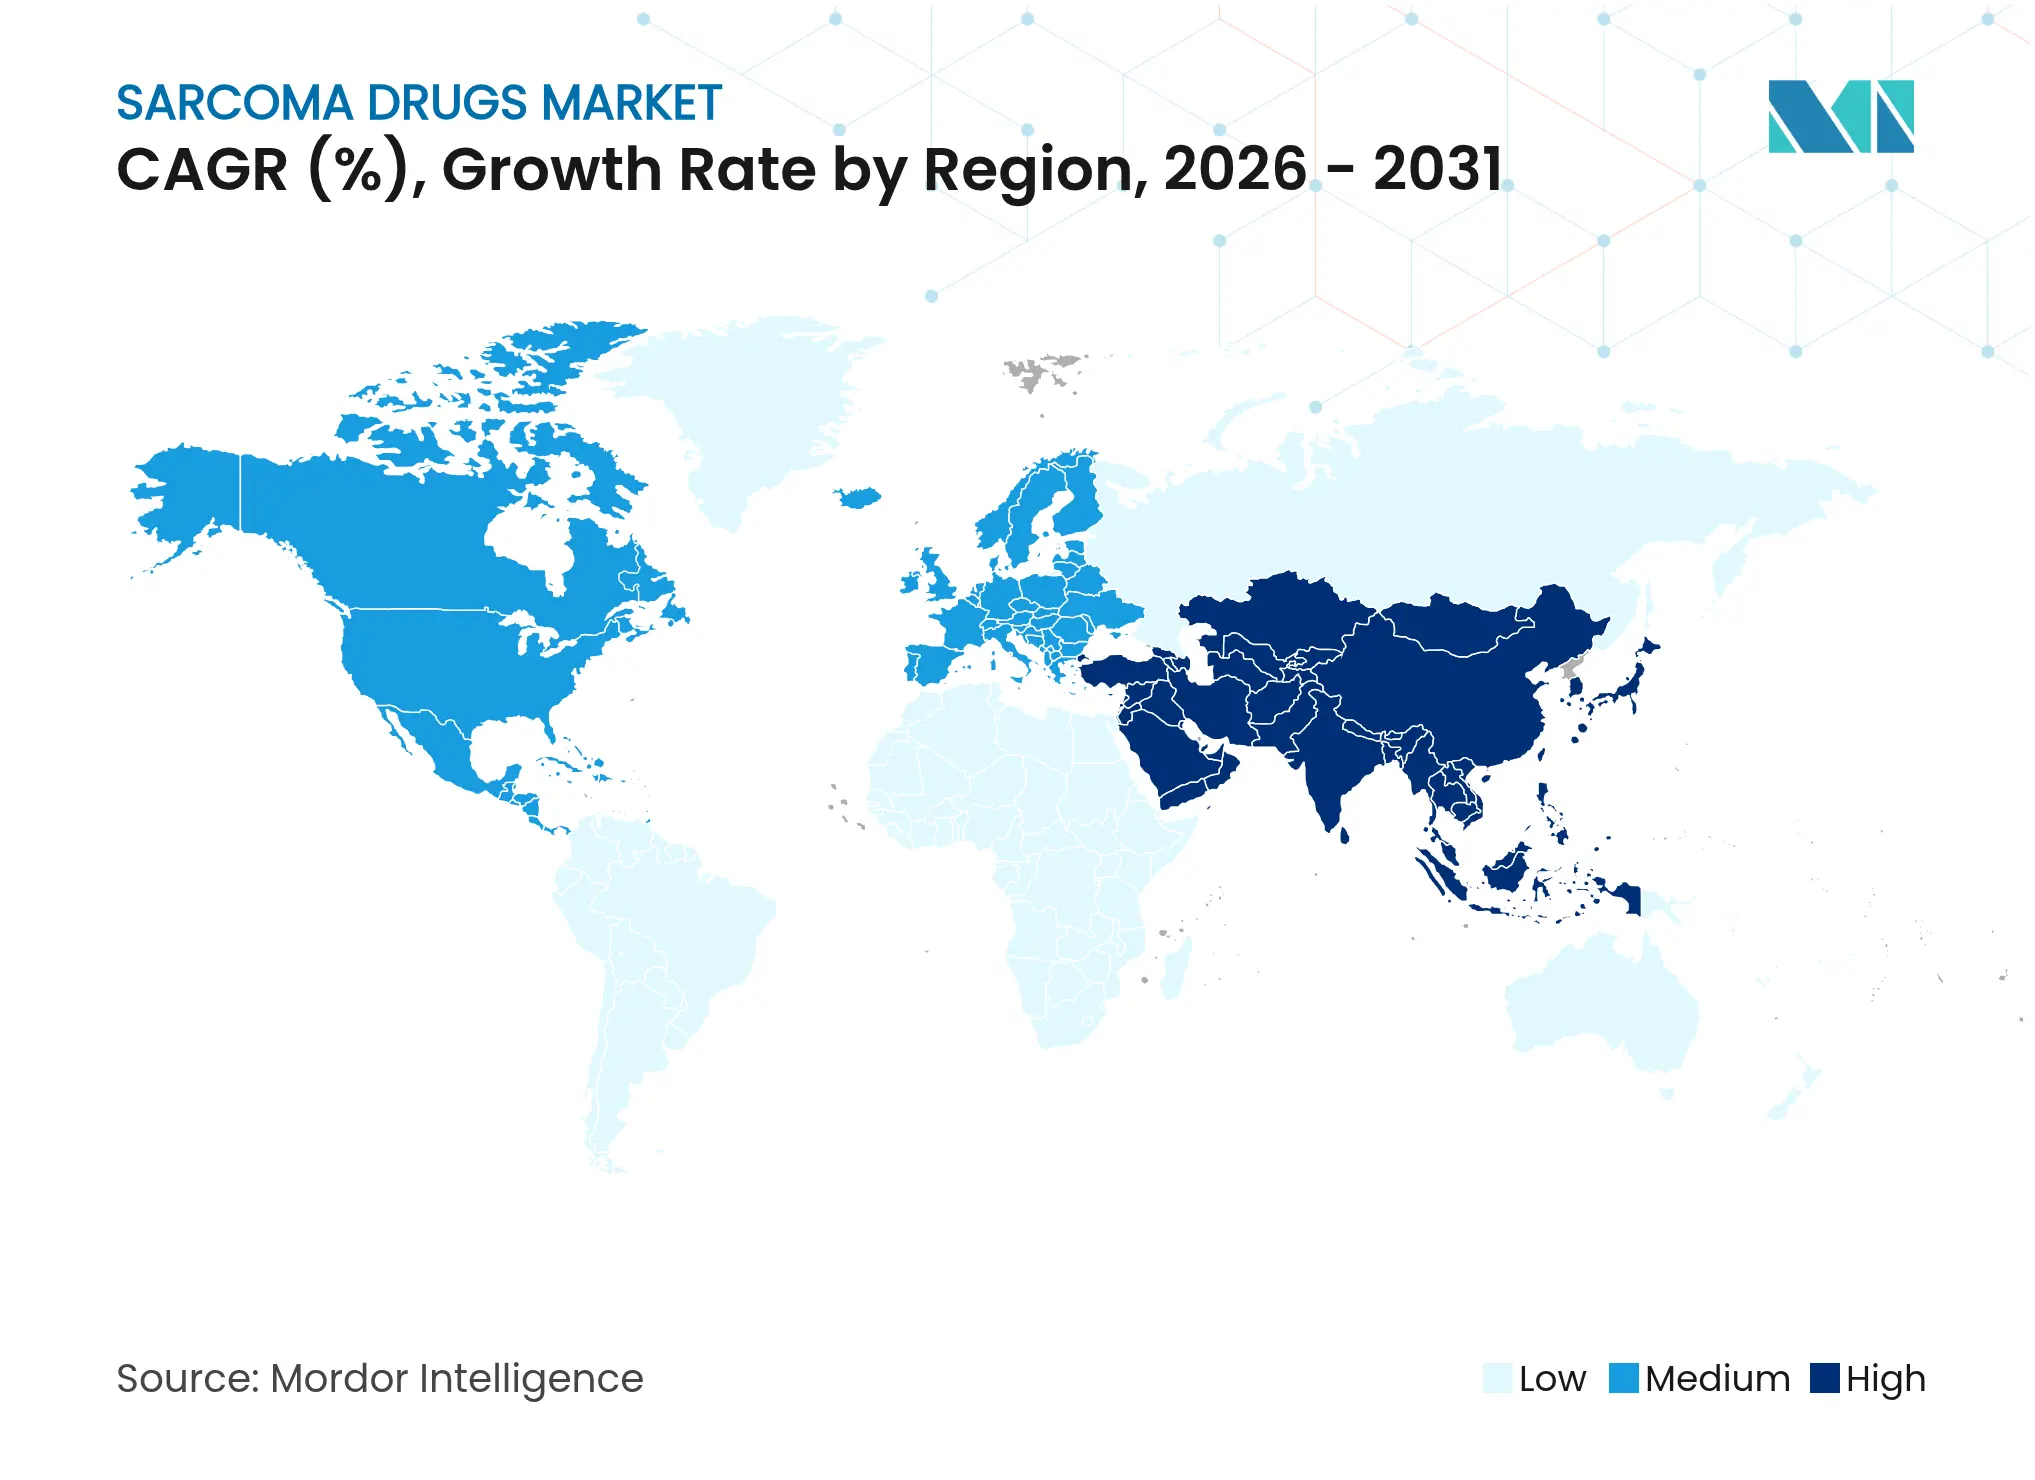
| Fastest Growing Market | Asia Pacific |
| Largest Market | North America |
| Market Concentration | High |
Major Players *Disclaimer: Major Players sorted in no particular order. Image © Mordor Intelligence. Reuse requires attribution under CC BY 4.0. |
Sarcoma Drugs Market Analysis by Mordor Intelligence
Sarcoma drugs market size in 2026 is estimated at USD 1.75 billion, growing from 2025 value of USD 1.61 billion with 2031 projections showing USD 2.63 billion, growing at 8.49% CAGR over 2026-2031. The current sarcoma drugs market growth stems from faster regulatory reviews, orphan-drug incentives and rising pharmaceutical investment in precision oncology. Breakthrough approvals—such as Tecelra for synovial sarcoma and Romvimza for tenosynovial giant cell tumor—validate the commercial potential of rare-tumor assets, while radioligand programs backed by large-scale isotope manufacturing move the modality toward mainstream use. Consolidation deals by Merck KGaA and ONO Pharmaceutical illustrate how multinationals are building scale in the sarcoma drugs market through targeted acquisitions. Regional dynamics add further momentum: North America benefits from robust reimbursement for orphan drugs, whereas Asia-Pacific gains from China’s aggressive price negotiations paired with expanding diagnostic infrastructure.
Key Report Takeaways
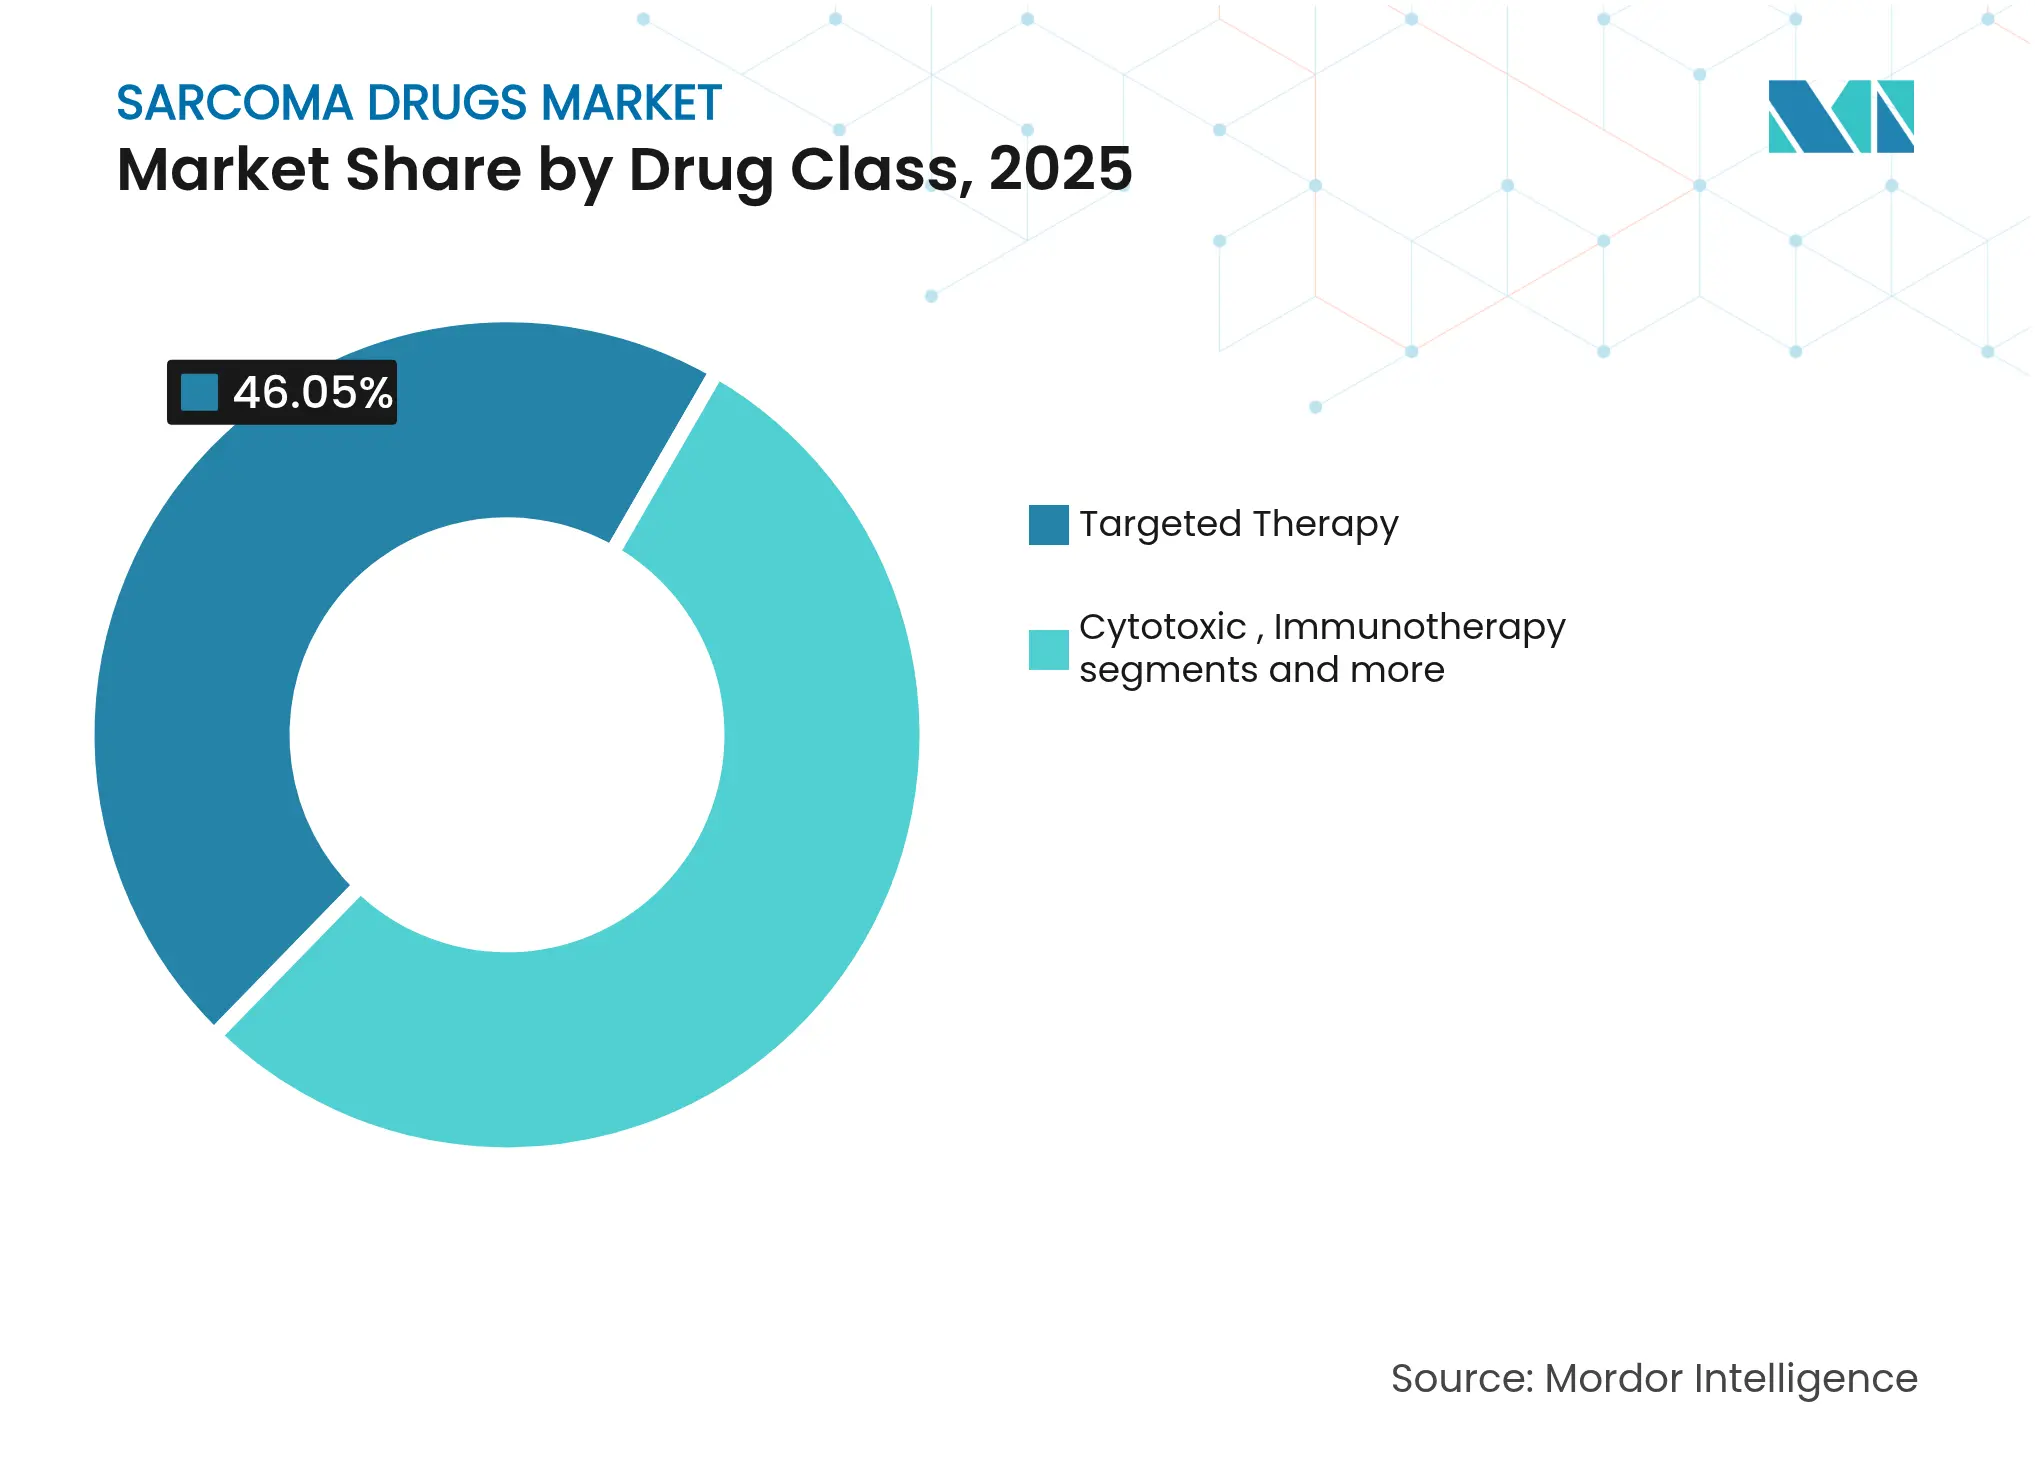
- By drug class, targeted therapy led with 46.05% of sarcoma drugs market share in 2025; immunotherapy is projected to grow at 8.95% CAGR through 2031.
- By indication, soft tissue sarcoma accounted for 50.85% of sarcoma drugs market size in 2025, while osteosarcoma is set to expand at 9.27% CAGR to 2031.
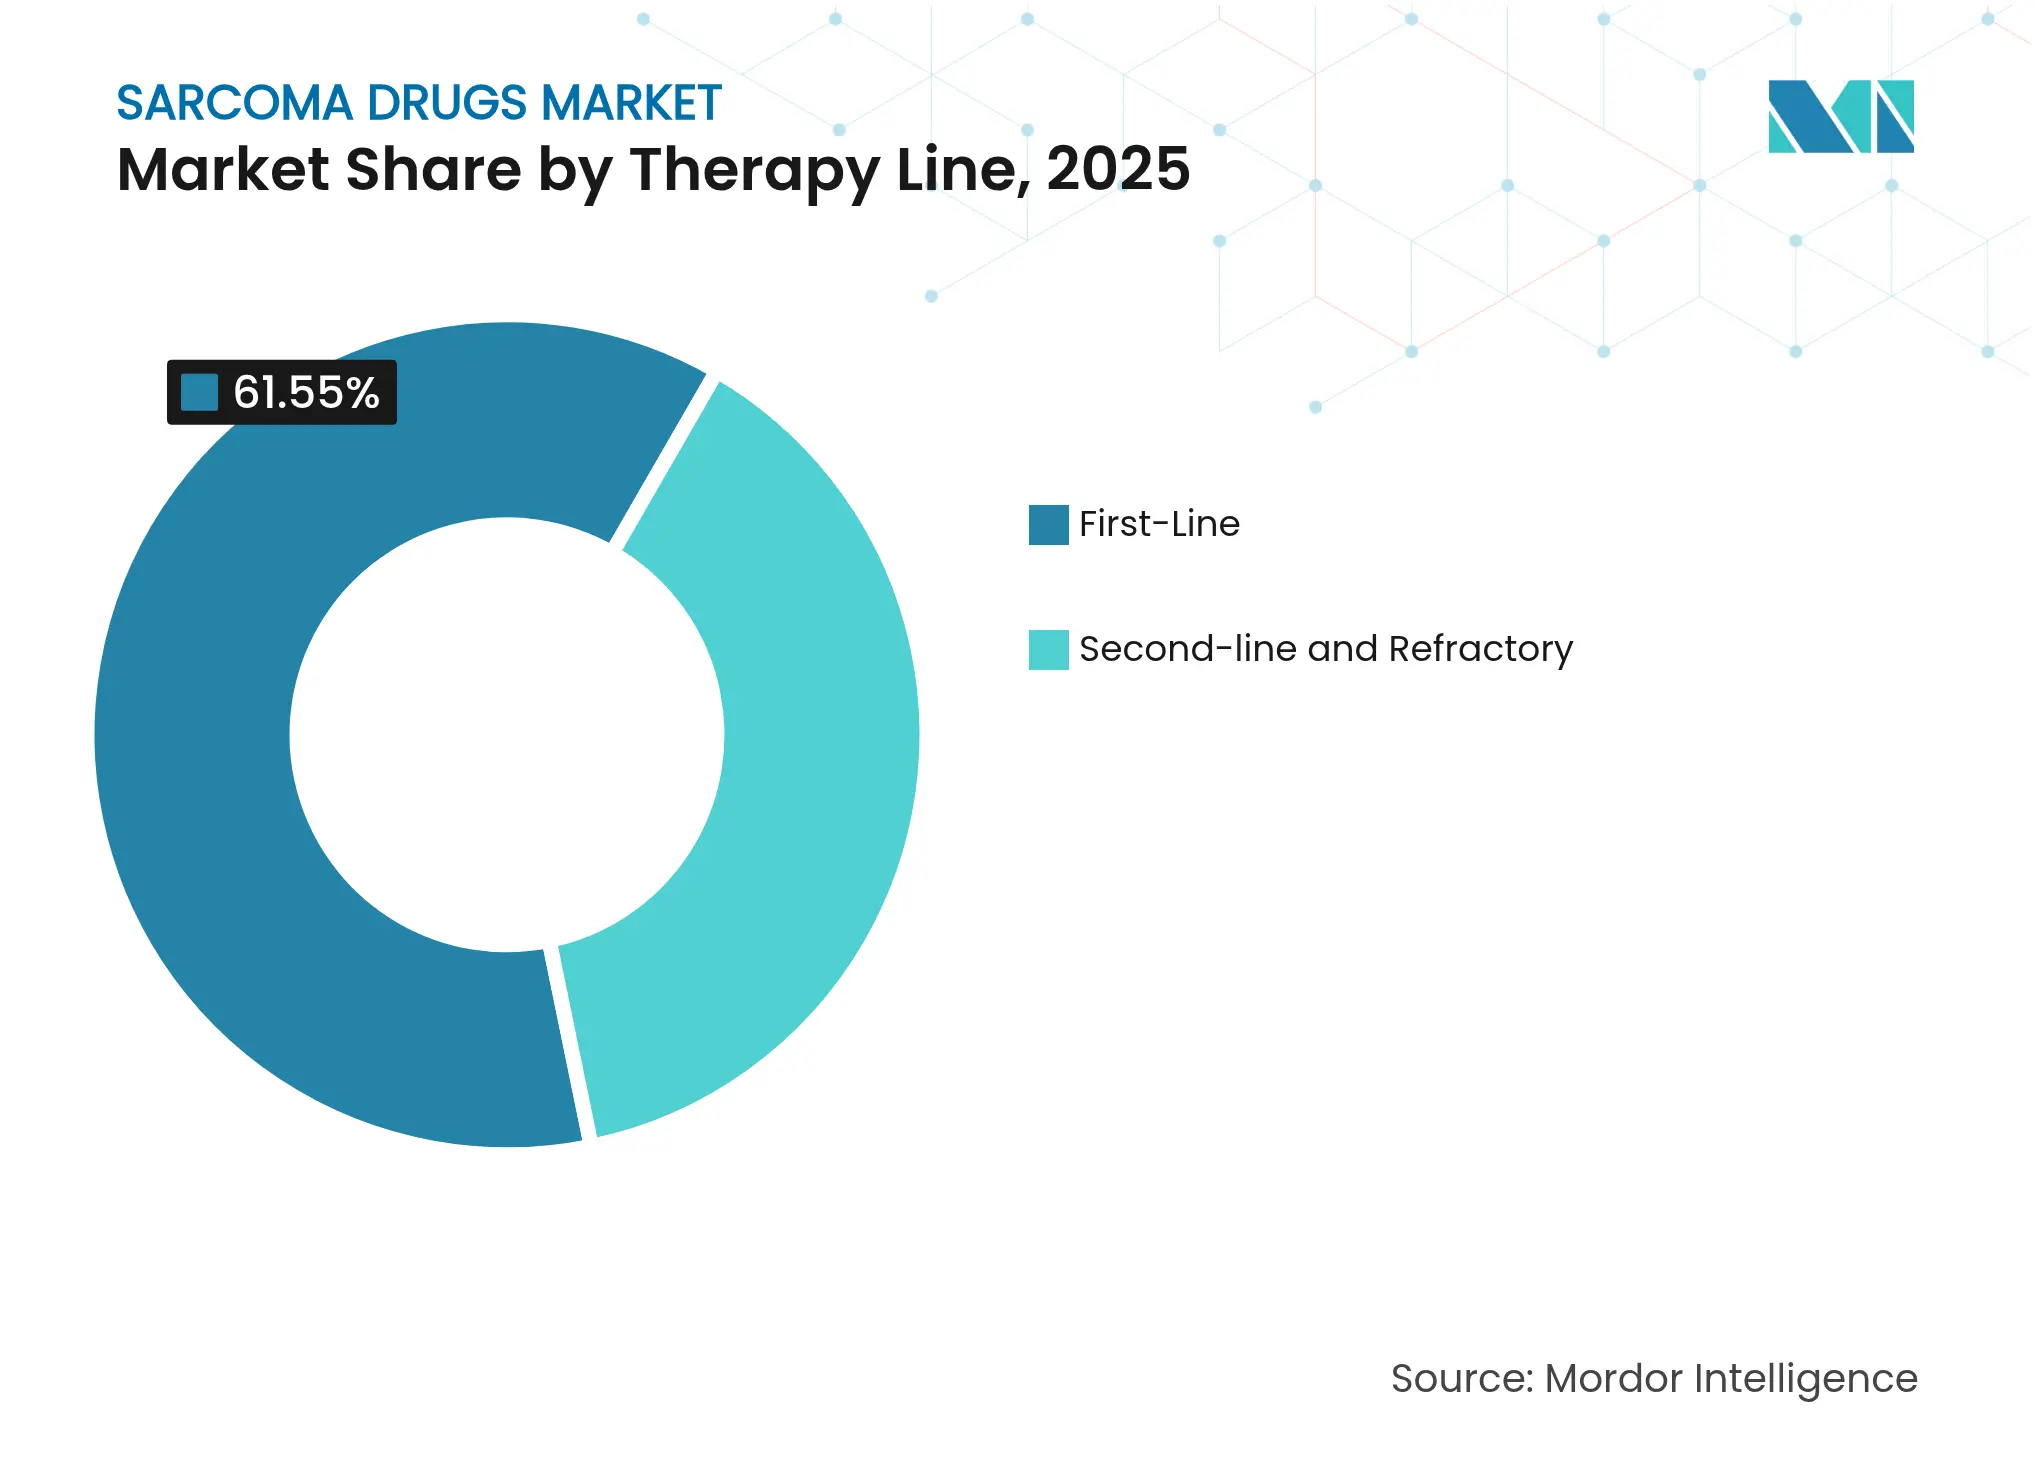
- By therapy line, first-line regimens represented 61.55% of sarcoma drugs market size in 2025; second-line and refractory care advances at 9.95% CAGR.
- By route of administration, injectables commanded 80.35% share of sarcoma drugs market size in 2025, yet oral agents are rising at 9.54% CAGR.
- By geography, North America retained 39.85% sarcoma drugs market share in 2025, whereas Asia-Pacific is forecast to post a 10.35% CAGR through 2031.
Note: Market size and forecast figures in this report are generated using Mordor Intelligence's proprietary estimation framework, updated with the latest available data and insights as of 2026.
Global Sarcoma Drugs Market Trends and Insights
Driver Impact Analysis
| Driver | (~) % Impact on CAGR Forecast | Geographic Relevance | Impact Timeline | |||
|---|---|---|---|---|---|---|
Rising incidence of sarcoma cases Rising incidence of sarcoma cases | +1.8% | Global, with higher rates in North America & Europe | Long term (≥ 4 years) | (~) % Impact on CAGR Forecast:+1.8% | Geographic Relevance:Global, with higher rates in North America & Europe | Impact Timeline:Long term (≥ 4 years) |
Accelerated approvals & orphan-drug incentives Accelerated approvals & orphan-drug incentives | +2.1% | North America & EU core, expanding to APAC | Medium term (2-4 years) | |||
Uptake of precision & immuno-oncology agents Uptake of precision & immuno-oncology agents | +1.9% | Global, led by developed markets | Medium term (2-4 years) | |||
Growing payer acceptance of multi-kinase oral TKIs Growing payer acceptance of multi-kinase oral TKIs | +1.4% | North America & EU, gradual APAC adoption | Short term (≤ 2 years) | |||
Radioligand therapies' commercialization momentum Radioligand therapies' commercialization momentum | +1.2% | North America & EU initially, selective APAC markets | Long term (≥ 4 years) | |||
Crowdfunded early-access programs in major economies Crowdfunded early-access programs in major economies | +0.7% | North America & EU, emerging in Australia | Short term (≤ 2 years) | |||
| Source: Mordor Intelligence | ||||||
Rising Incidence of Sarcoma Cases
Global epidemiology shows a 2.3% annual rise in sarcoma diagnoses, and the United States registered 15,000 new soft tissue sarcoma patients in 2024, 12% above the 2019 baseline[1]International Agency for Research on Cancer, “Cancer Incidence Statistics 2024,” iarc.who.int. Higher detection from advanced imaging and genetic testing supports steady demand that insulates the sarcoma drugs market from cyclical swings. Pediatric osteosarcoma is increasing quickly across industrializing Asia-Pacific economies, highlighting a need for broader geographic therapeutic reach. Environmental and occupational exposures add to the caseload, underpinning long-run market volume expansion.
Accelerated Approvals & Orphan-Drug Incentives
The U.S. FDA Real-Time Oncology Review has cut review timelines to roughly six months, while the European Medicines Agency’s PRIME framework offers earlier scientific input and concurrent assessment. Twenty-three sarcoma-linked approvals have been issued since 2024 under orphan-drug rules, providing seven-to-ten-year exclusivity that offsets high R&D costs. Venture and private-equity investors have responded by directing greater capital toward small-population oncology assets, strengthening the late-stage pipeline that feeds the sarcoma drugs market.
Uptake of Precision & Immuno-Oncology Agents
Companion diagnostics now guide 67% of treatment decisions at specialized centers, doubling historical genomic testing rates and lifting response outcomes to 34% from 15% previously. Broader next-generation sequencing adoption stems from an 18% cost decline through 2024, making comprehensive genomic profiling routine in sarcoma care[2]Nature Biotechnology, “Genomic Sequencing Cost Trends in Oncology,” nature.com. Combination checkpoint blockade has produced 42% objective responses in microsatellite instability-high tumors, widening clinical confidence and elevating immunotherapy’s contribution to sarcoma drugs market growth.
Radioligand Therapies for Micro-Metastatic Disease
Phase III lutetium-177 conjugates target rare neuroendocrine sarcomas, and recent FDA breakthrough designations point to first commercial launches in the forecast period. Supply chains, however, remain tied to limited isotope production, making security of radioisotope supply a strategic priority for sponsors. Early provider contracts suggest that first movers may secure long-term pricing power once manufacturing scale issues resolve.
Restraint Impact Analysis
| Restraint | (~) % Impact on CAGR Forecast | Geographic Relevance | Impact Timeline | |||
|---|---|---|---|---|---|---|
High treatment cost & reimbursement gaps High treatment cost & reimbursement gaps | -1.6% | Global, most pronounced in emerging markets | Medium term (2-4 years) | (~) % Impact on CAGR Forecast:-1.6% | Geographic Relevance:Global, most pronounced in emerging markets | Impact Timeline:Medium term (2-4 years) |
Limited patient pool for late-phase trials Limited patient pool for late-phase trials | -1.1% | Global, affecting all pharmaceutical companies | Long term (≥ 4 years) | |||
Drug resistance & short duration of TKI response Drug resistance & short duration of TKI response | -0.9% | Global, particularly impacting targeted therapy segments | Medium term (2-4 years) | |||
Radio-isotope supply bottlenecks Radio-isotope supply bottlenecks | -0.8% | North America & EU primarily, expanding globally | Short term (≤ 2 years) | |||
| Source: Mordor Intelligence | ||||||
High Treatment Cost & Reimbursement Gaps
Annual therapy expenses run from USD 180,000 to USD 320,000, and not all payers classify new sarcoma medicines as cost-effective. The United Kingdom’s National Institute for Health and Care Excellence declined three applications in 2024 on value grounds[3]National Institute for Health and Care Excellence, “Technology Appraisal Decisions 2024,” nice.org.uk. Middle-income markets remain price-sensitive, with 78% of sarcoma care financed out-of-pocket. Although manufacturer assistance helps, only 23% of eligible patients receive support, reducing addressable demand and restraining sarcoma drugs market growth.
Limited Patient Pool for Late-Phase Trials
As a rare cancer group, sarcoma recruits fewer than 1% of all oncology trial participants, stretching Phase III timelines by up to two years and complicating regulatory submissions. Adaptive-design guidance offers flexibility, yet multicountry execution remains complex. Sponsors increasingly blend registry and real-world evidence into datasets, but cross-jurisdiction acceptance varies, prolonging time to approval and capping the expansion pace of the sarcoma drugs industry.
Segment Analysis
By Drug Class: Targeted Therapy Dominance Amid Immunotherapy Surge
Targeted therapy produced USD 0.74 billion in revenue in 2025, equal to 46.05% of the sarcoma drugs market. Multi-kinase inhibitors cover a broad mutation spectrum and remain standard after demonstrating durable control across several subtypes. Cytotoxic chemotherapy still plays a role for pediatric osteosarcoma, yet its share is edging down in favor of precision options. Immunotherapy grows fastest, at a 8.95% CAGR, as PD-1/PD-L1 blockade earns label extensions. The sarcoma drugs market size for immunotherapy is projected to cross USD 0.43 billion by 2031, while ongoing Phase III radioligand programs may unlock fresh value beyond 2027.
Second-generation targeted agents such as tazemetostat widen the class footprint by modulating epigenetic drivers. Pipeline trends also feature bispecific antibodies that pair tumor-associated antigens with immune activators, suggesting future convergence of targeted and immuno-oncology modalities. Competitive intensity remains moderate, with leading firms defending positions through incremental label additions rather than entirely new mechanisms. Smaller biotech entrants scout micro-niche indications that large companies overlook, diversifying therapeutic choice in the sarcoma drugs market.
Note: Segment shares of all individual segments available upon report purchase
By Indication: Soft Tissue Sarcoma Leadership with Osteosarcoma Momentum
Soft tissue sarcoma occupied 50.85% of sarcoma drugs market size in 2025, reflecting its higher incidence and broader therapeutic toolkit. Objective response rates have risen with multi-kinase inhibitors and immunotherapy combinations, supporting incremental revenue. Osteosarcoma grows fastest at a 9.27% CAGR on the back of immunotherapy plus radioligand developments that improve outcomes for pediatric and adolescent cohorts. Ewing sarcoma gains momentum from early-phase CAR-T investigations, while gastrointestinal stromal tumors stabilize due to sequential KIT and PDGFRA inhibitor use.
Regulators encourage subtype-tailored programs, enabling smaller pivotal trials and speedier approvals. Basket-trial frameworks reduce redundancy and pool biomarker-defined patients across histologies. These forces collectively widen product breadth, increasing the overall sarcoma drugs market size over the forecast horizon. Still, ultra-rare subtypes demand collaborative funding models or risk commercial underinvestment.
By Therapy Line: First-Line Stability with Refractory Innovation
First-line protocols held 61.55% of sarcoma drugs market size in 2025, anchored by standard doxorubicin-based chemotherapy plus newer targeted add-ons. Progression on initial regimens creates a growing second-line pool, which expands at a 9.95% CAGR as biomarker stratification identifies salvage candidates. Resistance-directed therapies deliver meaningful extension in progression-free survival and set a precedent for lifelong sequencing, turning refractory care into a durable revenue ladder for pharmaceutical companies.
Clinical programs increasingly consider molecular-failure patterns in design, moving away from histology-driven endpoints. Real-world datasets, such as those from the NCI-MATCH initiative, feed into label expansion filings and shorten development cycles. As sequencing algorithms mature, physicians can personalize later-line selections, elevating both efficacy and sarcoma drugs market share for novel agents aimed at resistant disease.
Note: Segment shares of all individual segments available upon report purchase
By Route of Administration: Injectables Dominate the Market, While Oral Agents are Gaining Traction Due to Convenience
Injectable formats remain essential for monoclonal antibodies, radioligands, and cell therapies, generating 80.35% of 2025 sarcoma drugs market size. Yet oral products increase at 9.54% CAGR because patient surveys show a strong preference for home dosing in chronic settings. Bioequivalence guidelines from the EMA support once-daily oral conversions for earlier iv molecules, removing some administration hurdles. Subcutaneous formulations, while technically injectable, offer outpatient convenience and may erode hard boundaries between administration routes.
Adherence data indicates that patients stay on oral TKIs longer than on iv-only regimens, strengthening real-world effectiveness. Pharmaceutical formulation teams thus prioritize oral R&D for pipeline agents whenever molecular characteristics allow. Over time, wider oral availability could narrow cost differences and accelerate adoption across both premium and budget-constrained markets, adding lift to the sarcoma drugs market.
Geography Analysis
North America generated 39.85% of 2025 revenue, supported by the FDA orphan-drug framework and near-universal payer coverage for designated therapies. Nearly 78% of U.S. sarcoma patients now undergo genomic profiling within one month of diagnosis, leading to faster therapy alignment and higher drug utilization. Canadian group purchasing moderates list prices while keeping volume high, reinforcing the region’s baseline share in the sarcoma drugs market.
Asia-Pacific, however, stands out with a 10.35% CAGR through 2031 as China and India scale oncology infrastructure and streamline approvals. China authorized five sarcoma medicines in 2024 under parallel-review pilots that mirror U.S. timelines. India’s specialized cancer institutes have begun adopting next-generation sequencing platforms, strengthening precision-medicine ecosystems. Japan’s Sakigake pathway and South Korea’s conditional reimbursement for targeted agents further consolidate the region’s momentum.
Europe maintains steady expansion through centralized EMA authorization, though national health-technology assessments constrain uptake for high-priced entrants. Germany’s IQWiG and France’s temporary authorization programs balance cost and access. The United Kingdom funnels rare-cancer treatments into the Cancer Drugs Fund, carving out budget for 2024 allocations worth GBP 47 million. Eastern European markets lag on reimbursement but participate in multinational trials, giving local physicians early familiarity that later drives adoption.

Competitive Landscape
Market Concentration
The sarcoma drugs market remains moderately fragmented because subtype diversity prevents one-drug dominance. Top multinational oncology firms hold scale advantages in distribution, yet emerging biotechs win share in niche molecular segments via faster innovation cycles. Companion-diagnostic partnerships help lock in prescriber loyalty, and precision targeting mitigates competitive overlap. Patent filings cluster around multi-kinase and immune-checkpoint synergies, but freedom-to-operate gaps still appear in epigenetic and radioligand fields, allowing late entrants room to participate.
The FDA 505(b)(2) route enables follow-on branded products with partial data reliance, but complex manufacturing deters quick biosimilar encroachment. Large-scale acquisitions, illustrated by Pfizer’s purchase of Seagen, underscore a trend toward pipeline buying rather than internal build. Pediatric formulations and ultra-rare therapies remain underserved; forward-looking companies explore risk-sharing or outcome-based agreements to unlock these areas, diversifying the sarcoma drugs industry revenue mix.
Sarcoma Drugs Industry Leaders

*Disclaimer: Major Players sorted in no particular order
Recent Industry Developments
- May 2025: Thermosome obtained FDA Orphan-Drug Designation for its soft tissue sarcoma candidate
- January 2025: FDA granted breakthrough therapy designation to letetresgene autoleucel for unresectable or metastatic myxoid/round-cell liposarcoma
Table of Contents for Sarcoma Drugs Industry Report
1. Introduction
- 1.1Study Assumptions & Market Definition
- 1.2Scope of the Study
2. Research Methodology
3. Executive Summary
4. Market Landscape
- 4.1Market Overview
- 4.2Market Drivers
- 4.2.1Rising Incidence of Sarcoma Cases
- 4.2.2Accelerated Approvals & Orphan-Drug Incentives
- 4.2.3Uptake of Precision & Immuno-Oncology Agents
- 4.2.4Growing Payer Acceptance of Multi-Kinase Oral TKIs
- 4.2.5Radioligand Therapies for Micro-Metastatic Disease
- 4.2.6Crowdfunded Early-Access Programs in Major Economies
- 4.3Market Restraints
- 4.3.1High Treatment Cost & Reimbursement Gaps
- 4.3.2Limited Patient Pool for Late-Phase Trials
- 4.3.3Drug resistance & short duration of TKI response
- 4.3.4Radio-Isotope Supply Bottlenecks
- 4.4Value / Supply-Chain Analysis
- 4.5Regulatory Landscape
- 4.6Technological Outlook
- 4.7Porter’s Five Forces
- 4.7.1Threat of New Entrants
- 4.7.2Bargaining Power of Suppliers
- 4.7.3Bargaining Power of Buyers
- 4.7.4Threat of Substitutes
- 4.7.5Competitive Rivalry
5. Market Size & Growth Forecasts (Value)
- 5.1By Drug Class
- 5.1.1Cytotoxic Chemotherapy
- 5.1.2Targeted Therapy
- 5.1.3Immunotherapy (Checkpoint, Cytokine, Cell-based)
- 5.1.4Radioligand & Other Novel Agents
- 5.2By Indication
- 5.2.1Soft Tissue Sarcoma
- 5.2.2Osteosarcoma
- 5.2.3Ewing Sarcoma
- 5.2.4Gastro-intestinal Stromal Tumor (GIST)
- 5.2.5Liposarcoma & Others
- 5.3By Therapy Line
- 5.3.1First-line
- 5.3.2Second-line & Refractory
- 5.4By Route of Administration
- 5.4.1Injectable
- 5.4.2Oral
- 5.5By Region
- 5.5.1North America
- 5.5.1.1United States
- 5.5.1.2Canada
- 5.5.1.3Mexico
- 5.5.2Europe
- 5.5.2.1Germany
- 5.5.2.2United Kingdom
- 5.5.2.3France
- 5.5.2.4Italy
- 5.5.2.5Spain
- 5.5.2.6Rest of Europe
- 5.5.3Asia-Pacific
- 5.5.3.1China
- 5.5.3.2India
- 5.5.3.3Japan
- 5.5.3.4South Korea
- 5.5.3.5Australia
- 5.5.3.6Rest of Asia-Pacific
- 5.5.4South America
- 5.5.4.1Brazil
- 5.5.4.2Argentina
- 5.5.4.3Rest of South America
- 5.5.5Middle East and Africa
- 5.5.5.1GCC
- 5.5.5.2South Africa
- 5.5.5.3Rest of Middle East and Africa
6. Competitive Landscape
- 6.1Market Concentration
- 6.2Market Share Analysis
- 6.3Company Profiles (includes Global level Overview, Market level overview, Core Segments, Financials as available, Strategic Information, Market Rank/Share for key companies, Products & Services, and Recent Developments)
- 6.3.1Novartis AG
- 6.3.2Pfizer Inc.
- 6.3.3F. Hoffmann-La Roche Ltd
- 6.3.4Eli Lilly and Company
- 6.3.5Bayer AG
- 6.3.6Daiichi Sankyo Company Ltd
- 6.3.7Eisai Co. Ltd
- 6.3.8Johnson & Johnson (Janssen)
- 6.3.9Takeda Pharmaceutical Company Ltd
- 6.3.10AbbVie Inc.
- 6.3.11Bristol Myers Squibb Co.
- 6.3.12Amgen Inc.
- 6.3.13Blueprint Medicines Corp.
- 6.3.14Deciphera Pharmaceuticals Inc.
- 6.3.15Ipsen SA
- 6.3.16Karyopharm Therapeutics Inc.
- 6.3.17Adaptimmune Therapeutics plc
- 6.3.18Incyte Corp.
- 6.3.19AstraZeneca plc
- 6.3.20Regeneron Pharmaceuticals Inc.
7. Market Opportunities & Future Outlook
- 7.1White-space & Unmet-need Assessment
Research Methodology Framework and Report Scope
Market Definitions and Key Coverage
Segmentation Overview
- By Drug Class
- Cytotoxic Chemotherapy
- Targeted Therapy
- Immunotherapy (Checkpoint, Cytokine, Cell-based)
- Radioligand & Other Novel Agents
- Cytotoxic Chemotherapy
- By Indication
- Soft Tissue Sarcoma
- Osteosarcoma
- Ewing Sarcoma
- Gastro-intestinal Stromal Tumor (GIST)
- Liposarcoma & Others
- Soft Tissue Sarcoma
- By Therapy Line
- First-line
- Second-line & Refractory
- First-line
- By Route of Administration
- Injectable
- Oral
- Injectable
- By Region
- North America
- United States
- Canada
- Mexico
- United States
- Europe
- Germany
- United Kingdom
- France
- Italy
- Spain
- Rest of Europe
- Germany
- Asia-Pacific
- China
- India
- Japan
- South Korea
- Australia
- Rest of Asia-Pacific
- China
- South America
- Brazil
- Argentina
- Rest of South America
- Brazil
- Middle East and Africa
- GCC
- South Africa
- Rest of Middle East and Africa
- GCC
- North America
Detailed Research Methodology and Data Validation
Primary Research
Desk Research
Market-Sizing & Forecasting
Data Validation & Update Cycle
Why Mordor's Sarcoma Drugs Baseline Commands Reliability
Benchmark comparison
| Market Size | Anonymized source | Primary gap driver | ||
|---|---|---|---|---|
USD 1.61 B (2025) | Mordor Intelligence | Anonymized source:Mordor Intelligence | Primary gap driver: | |
USD 1.48 B (2025) | Global Consultancy A | Counts only soft-tissue sarcomas and applies hospital-purchase prices without manufacturer rebates | ||
USD 2.10 B (2025) | Research Firm B | Aggregates diagnostics and supportive-care revenues and inflates totals with list-price growth assumptions | ||
USD 1.40 B (2023) | Industry Journal C | Uses older baseline year and excludes immunotherapies still under accelerated approval |