
Solid Tumor Therapeutics Market Size and Share
Market Overview
| Study Period | 2020 - 2031 |
|---|---|
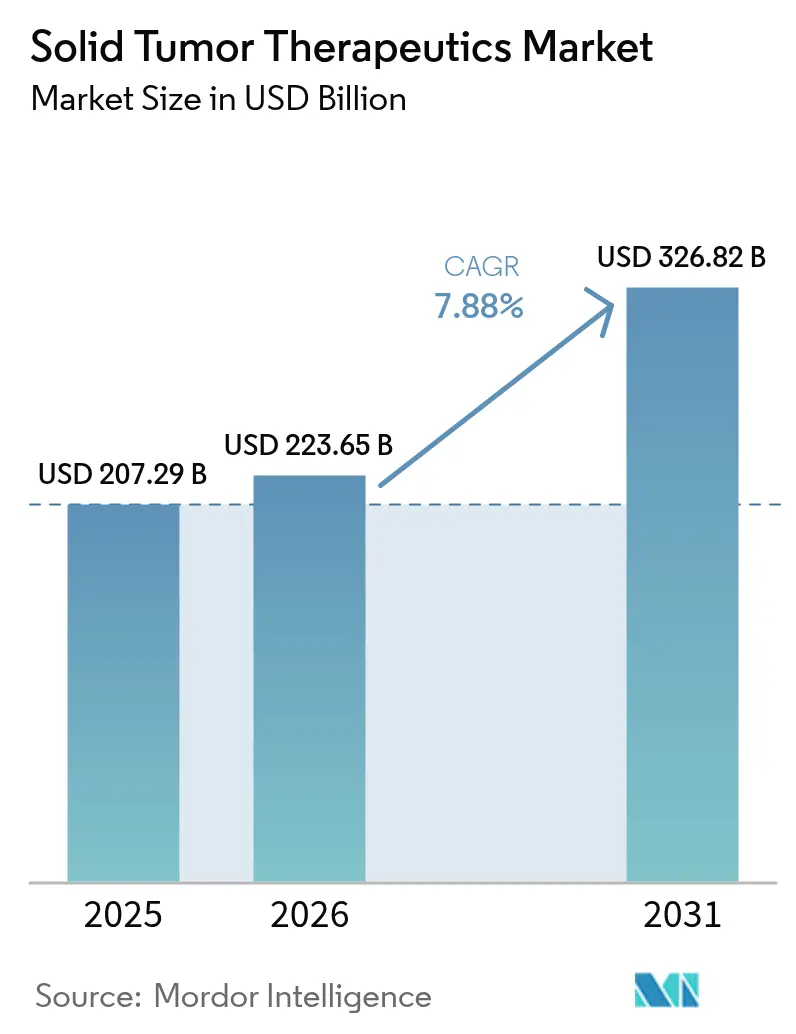
| Market Size (2026) | USD 223.65 Billion |
| Market Size (2031) | USD 326.82 Billion |
| Growth Rate (2026 - 2031) | 7.88 % |
| Fastest Growing Market | Asia Pacific |
| Largest Market | North America |
| Market Concentration | Medium |
Major Players *Disclaimer: Major Players sorted in no particular order Image © Mordor Intelligence. Reuse requires attribution under CC BY 4.0. | |
Solid Tumor Therapeutics Market Analysis by Mordor Intelligence
The solid tumor therapeutics market size is expected to grow from USD 207.29 billion in 2025 to USD 223.65 billion in 2026 and is forecast to reach USD 326.82 billion by 2031 at 7.88% CAGR over 2026-2031. Robust innovation in antibody-drug conjugates, immune-checkpoint inhibitor combinations, and biomarker-driven regimens is expanding clinical options and broadening patient pools. Rising cancer prevalence—projected at 32 million new cases annually by 2050—sustains long-term demand, while value-based reimbursement pilots in the United States and outcome-linked contracts in Europe are strengthening payer confidence. North America preserves pricing leadership through strong intellectual-property protections, yet Asia-Pacific is closing the innovation gap as regulatory agencies accelerate approvals. Consolidation among large multinational companies and mid-cap biotech firms is reshaping competitive positioning, and investment in AI-enabled discovery partnerships is shortening pre-clinical timelines.
Key Report Takeaways
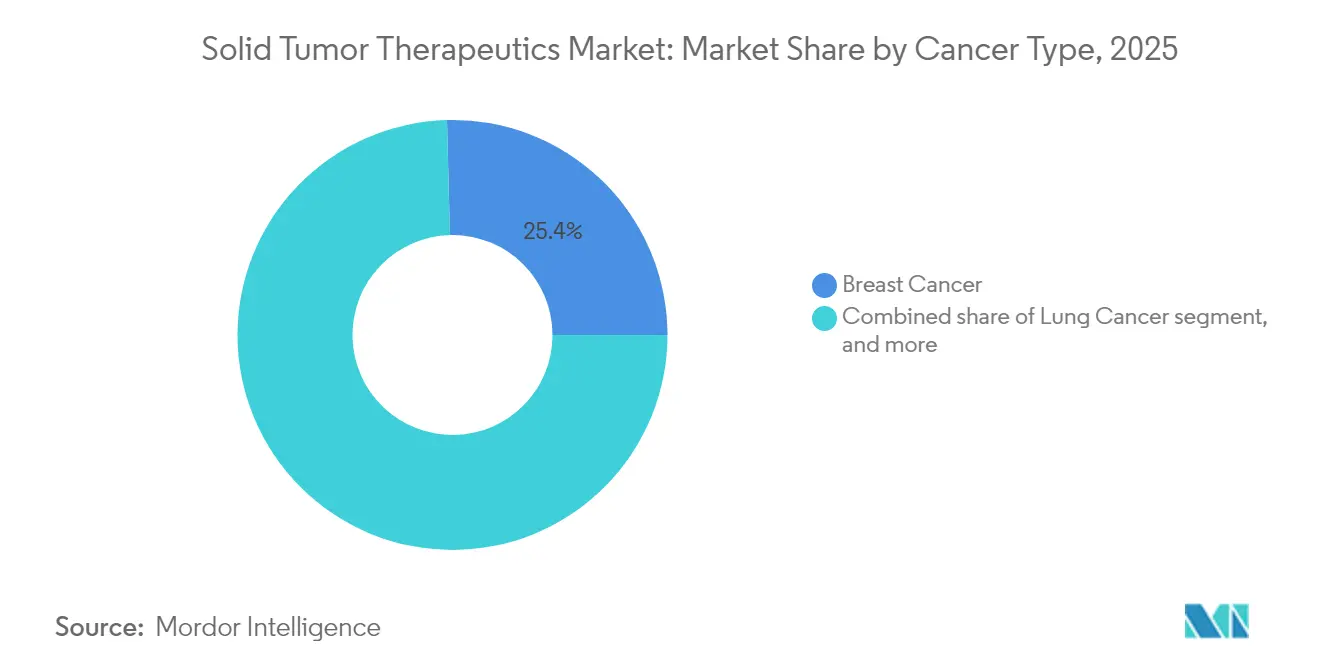
- By cancer type, breast cancer led with 25.41% revenue share in 2025, whereas prostate cancer is projected to expand at 10.16% CAGR through 2031.
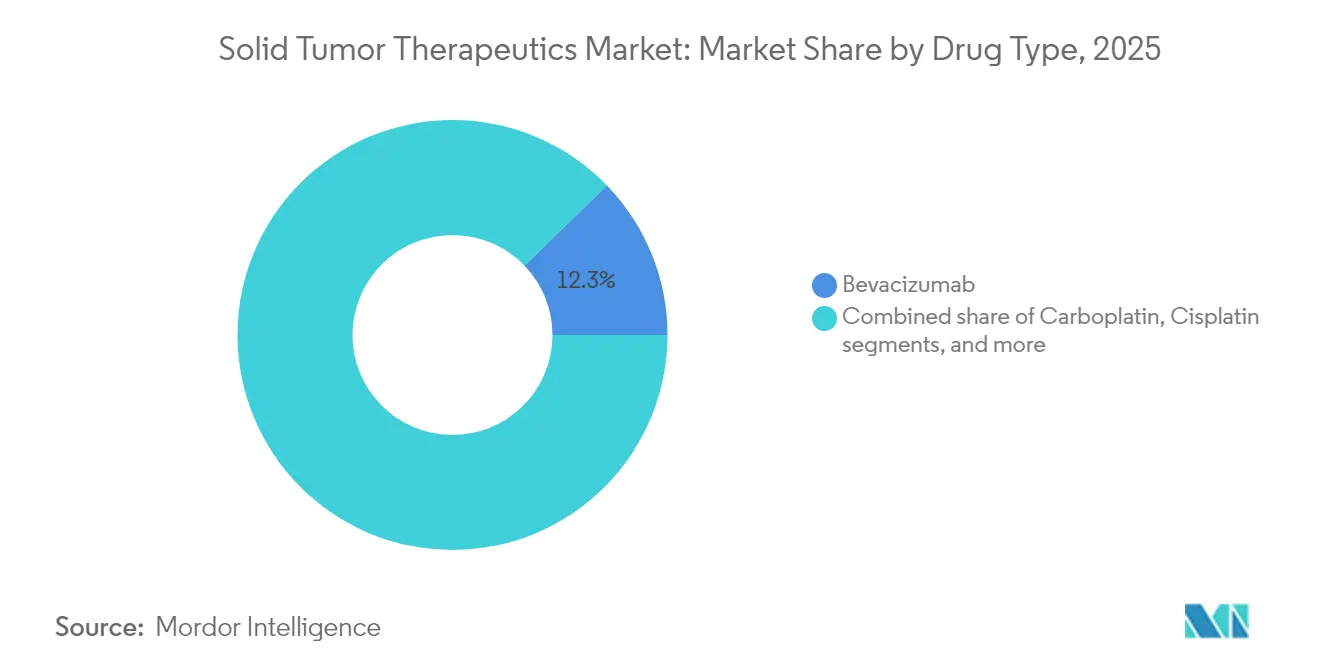
- By drug type, bevacizumab accounted for 12.25% of solid tumor therapeutics market share in 2025, while cisplatin is expected to record a 12.23% CAGR during the same period.
- By administration route, intravenous formulations captured 46.04% of the 2025 revenue pool; oral formulations are on track for a 10.49% CAGR to 2031.
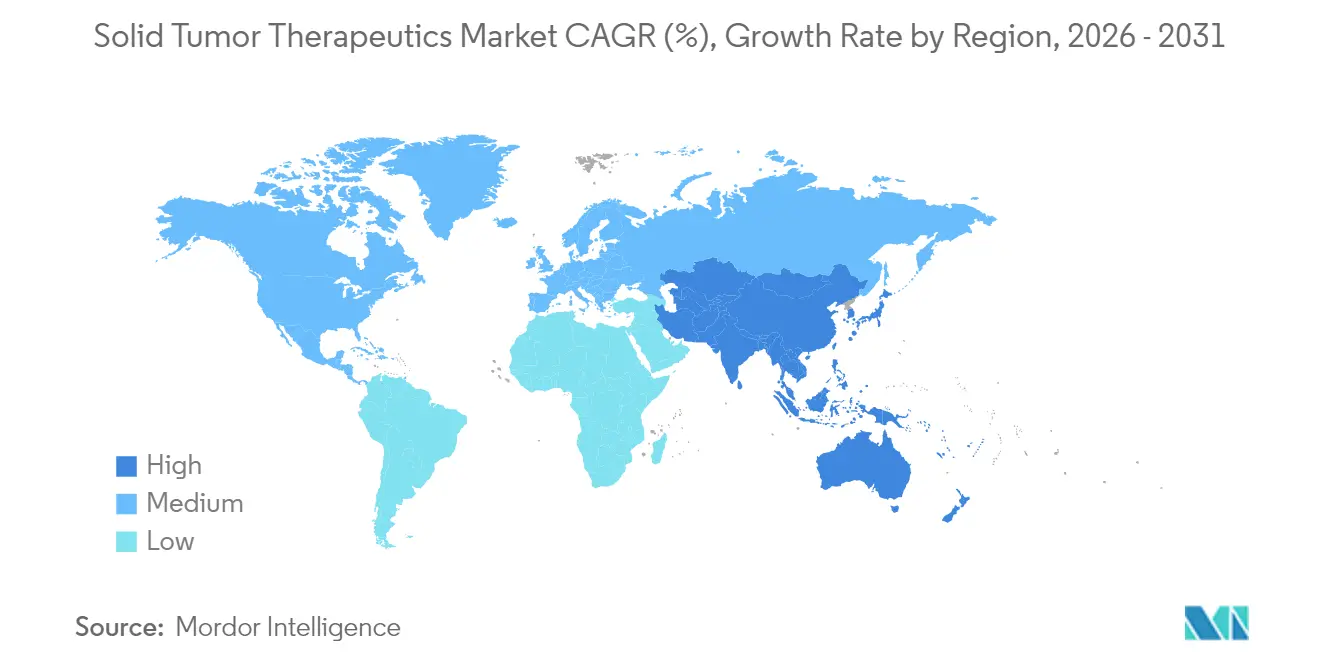
- By geography, North America maintained 42.03% share in 2025, whereas Asia-Pacific is forecast to grow at 9.38% CAGR through 2031.
Note: Market size and forecast figures in this report are generated using Mordor Intelligence’s proprietary estimation framework, updated with the latest available data and insights as of 2026.
Market Trends and Insights
Drivers Impact Analysis of Solid Tumor Therapeutics Market*
| Driver | % Impact on CAGR Forecast | Geographic Relevance | Impact Timeline |
|---|---|---|---|
| Rising global cancer incidence and prevalence | +2.1% | Highest in Asia-Pacific and emerging markets | Long term (≥ 4 years) |
| Technological advancements in targeted and immuno-oncology therapies | +2.8% | North America and EU leading; rapid uptake in Asia-Pacific | Medium term (2–4 years) |
| Growing adoption of precision medicine and companion diagnostics | +1.9% | Developed markets first; gradual expansion elsewhere | Medium term (2–4 years) |
| Increasing government and private funding in oncology research | +1.4% | United States, China and EU | Long term (≥ 4 years) |
| Breakthrough approvals of antibody-drug conjugates and radioligand therapies | +1.7% | Global, with early penetration in United States, EU and Japan | Medium term (2–4 years) |
| Integration of artificial intelligence in drug discovery and clinical decision support | +1.3% | Global, with concentrated activity in North America and China | Short term (≤ 2 years) |
| Source: Mordor Intelligence | |||
Rising Global Cancer Incidence and Prevalence
The solid tumor therapeutics market has a direct demand correlation with the escalating burden of cancer, which is projected to hit 32 million new diagnoses each year by 2050. Solid tumors represent around 85% of these cases, with Asia-Pacific registering the steepest uptick as urbanization and lifestyle shifts aggravate risk factors. China alone accounts for nearly 30% of worldwide incidence, prompting multinational companies to tailor market-entry plans toward provincial reimbursement schemes. Population aging in the United States and Western Europe is simultaneously growing the pool of patients eligible for novel therapies. Taken together, these epidemiological patterns ensure a steady inflow of candidates for next-generation treatments within the solid tumor therapeutics market.
Technological Advancements in Targeted and Immuno-Oncology Therapies
Antibody-drug conjugates (ADCs) have become the most dynamic modality, expanding from USD 10 billion sales in 2023 to an estimated USD 39 billion by 2033 as 80% of late-stage ADC assets target solid tumors . Breakthrough approvals such as trastuzumab deruxtecan for HER2-low breast cancer and datopotamab deruxtecan for lung cancer are delivering progression-free survival gains exceeding 50% versus chemotherapy[1]New England Journal of Medicine, “Trastuzumab Deruxtecan in HER2-Low Breast Cancer,” nejm.org. Combining PD-1 inhibitors with CTLA-4 agents and standard chemotherapy has yielded five-year overall-survival rates of 18% in metastatic NSCLC compared with 11% for chemotherapy alone[2]Targeted Oncology, “Five-Year Outcomes with Nivolumab plus Ipilimumab,” targetedonc.com. As algorithm-driven drug-design platforms mature, companies are allocating over USD 1 billion to AI partnerships to compress discovery timelines. These scientific strides are reinforcing confidence in the long-run expansion of the solid tumor therapeutics market.
Growing Adoption of Precision Medicine and Companion Diagnostics
Real-world evidence from the ROME trial shows that tailoring therapy to matched tissue and liquid-biopsy profiles extends median overall survival to 11.05 months, surpassing 7.7 months with conventional regimens. Tumor-agnostic approvals—exemplified by pembrolizumab in microsatellite-instability-high tumors—are rewarding biomarker screening programs. Liquid-biopsy technologies are narrowing access gaps by circumventing invasive procedures; circulating tumor DNA assays are now standard for monitoring resistance mutations. Despite these advances, reimbursement for multi-gene panels remains inconsistent, slowing uptake in lower-income markets. Nevertheless, expanded molecular testing capacity is critical for the future trajectory of the solid tumor therapeutics market.
Increasing Government and Private Funding In Oncology Research
Worldwide oncology-medicine spending is projected to reach USD 409 billion by 2028, fuelled by more than 2,000 new trials launched in 2023. China hosted 39% of those starts after streamlining its regulatory pathway, while the United States maintained leadership in first-in-human studies. Venture capital continues to back high-risk programs such as CAR-T cells for solid tumors and alpha-emitting radiopharmaceuticals, even amid volatile equity markets. Public initiatives like the U.S. Cancer Moonshot and Beijing’s Healthy China 2030 blueprint are channeling funds into translational research. These financing mechanisms underpin a vibrant pipeline that is indispensable to sustained growth in the solid tumor therapeutics market.
Restraints Impact Analysis of Solid Tumor Therapeutics Market*
| Restraints Impact Analysis | (~) % Impact on CAGR Forecast | Geographic Relevance | Impact Timeline |
|---|---|---|---|
| Stringent regulatory approval processes for oncology drugs | −1.2% | Global, variable by agency | Medium term (2–4 years) |
| High treatment costs limiting patient access | −1.8% | Emerging markets primarily; spillover in developed economies | Long term (≥ 4 years) |
| Reimbursement and pricing challenges in emerging economies | −1.5% | Asia-Pacific, Latin America, Middle East & Africa | Long term (≥ 4 years) |
| Manufacturing capacity constraints for complex biologics | −1.1% | Global, acutely felt in low- and middle-income countries | Short term (≤ 2 years) |
| Source: Mordor Intelligence | |||
Stringent Regulatory Approval Processes for Oncology Drugs
Median development timelines for an oncology asset still span 10–15 years, while failure rates exceed 90% from Phase I to approval. The FDA’s 2021 value-oriented guidance demands active-comparator data, raising trial complexity. Combination regimens require multi-arm studies across tumor types, further stretching resources. Although China’s priority-review channel has trimmed approval to 263.5 days, dossiers still need expansive efficacy evidence that can delay commercialization by up to three years. The cumulative effect tempers the near-term growth velocity of the solid tumor therapeutics market.
High Treatment Costs Limiting Patient Access
List prices for novel solid-tumor medicines often top USD 200,000 per treatment year, far above per-capita healthcare budgets of many emerging economies. Biosimilar trastuzumab has cut acquisition costs by up to 90%, yet adoption is hampered by physician caution and complex payer formularies. Medical-tourism flows from South-East Asia to North America illustrate cross-border demand for unaffordable therapies at home. Tiered-pricing and co-payment-support programs improve affordability but rarely reach scale. As a result, price sensitivity remains a structural brake on the solid tumor therapeutics market.
*Our forecasts treat driver/restraint impacts as directional, not additive. The impact forecasts reflect baseline growth, mix effects, and variable interactions.
Solid Tumor Therapeutics Market Segment Analysis
By Cancer Type:
Breast Cancer Dominance Drives Innovation PipelineBreast cancer retained 25.41% of 2025 revenue, giving it the largest slice of the solid tumor therapeutics market size. HER2-low classifications enabled by trastuzumab deruxtecan enlarged the treatable group by 60%, accelerating revenue growth. Lung cancer, the second-largest segment, benefited from osimertinib’s 39.1-month median progression-free survival in stage III EGFR-mutated disease.
Prostate cancer is projected to log the fastest 10.16% CAGR through 2031, buoyed by metastasis-directed approaches that enhance progression-free intervals in oligometastatic settings. Colorectal programs are evaluating total-ablative therapy, and cervical-cancer dynamics are shifting as HPV vaccination alters prevalence patterns. Innovation in pancreatic and neuroendocrine tumors, ranging from tumor-treating fields to novel immunomodulators, is diversifying revenue sources across the solid tumor therapeutics industry.



By Drug Type:
Bevacizumab Leadership Challenged By Emerging ADCsBevacizumab held 12.25% of 2025 revenue, the largest slice of the solid tumor therapeutics market share, yet biosimilars are exerting price pressure. Carboplatin, cisplatin and paclitaxel remain staples in low-resource settings due to affordability and clinical familiarity.
Cisplatin is poised for a 12.23% CAGR to 2031 as studies show platinum-based chemotherapy enhances immune activation when paired with checkpoint inhibitors. Small-molecule targeted agents such as erlotinib, sunitinib and everolimus are regaining momentum via combination programs; everolimus with lanreotide extended PFS to 29.7 months in gastro-enteropancreatic NETs. Rapidly emerging modalities—CAR-T cells, radiopharmaceuticals, bispecific antibodies—signal further diversification for the solid tumor therapeutics industry.
By Administration Route:
Intravenous Dominance Faces Oral ChallengeIntravenous delivery retained 46.04% revenue in 2025 and remains the backbone of combination regimens that anchor hospital infusion services. Subcutaneous variants of monoclonal antibodies are lowering chair time, and payers are encouraging outpatient shifts to cut facility costs.
Oral agents are forecast for a 10.49% CAGR, propelled by patient convenience and the success of tyrosine-kinase and CDK4/6 inhibitors. Sponsor focus on high-potency, low-molecular-weight compounds is expanding the pipeline of oral reformulations of intravenous benchmarks. Intratumoral and implant-able delivery systems are advancing for localized control, widening administration-route optionality in the solid tumor therapeutics market.
Geography Analysis
North America Solid Tumor Therapeutics Market
North America led revenue with a 42.03% slice in 2025 as premium pricing, broad insurance coverage and deep clinical-trial networks supported rapid uptake of novel agents. Continued consolidation of oncology practices is strengthening distributor bargaining clout, although payer scrutiny of high-cost drugs is intensifying.
Europe Solid Tumor Therapeutics Market
Europe remains the second-largest region, with Germany, the United Kingdom and France spearheading adoption of advanced therapies under coordinated EMA frameworks. Reference-pricing and health-technology-assessment reviews temper list-price inflation, compelling manufacturers to negotiate confidential discounts that still preserve attractive margins for the solid tumor therapeutics market.
APAC, MEA and South America Solid Tumor Therapeutics Market
Asia-Pacific is the fastest-growing region at 9.38% CAGR through 2031 as China transforms into a discovery and commercialization hub, having approved 228 new medicines in 2024, 37% of which were antineoplastics. Domestic innovators secured 71% of new reimbursement-list inclusions, while Japan and India captured trial investments due to efficient start-up timelines and treatment-naïve populations. Middle East & Africa and South America offer long-run upside, yet limited infrastructure and budget caps constrain near-term growth. Collectively, geographical diversification is vital for companies seeking balanced exposure within the solid tumor therapeutics market.

Regulatory Landscape
Global regulation of solid tumor therapeutics is being shaped by tighter evidence expectations for both accelerated and traditional approvals, with the US FDA and the European Medicines Agency (EMA) playing central roles in trial-design and endpoint standards. In November 2024, the FDA issued guidance on the use of circulating tumor DNA (ctDNA) in early-stage, curative-intent solid tumor drug development, highlighting how biomarker strategy and analytical validation can shape development plans and evidence packages.
In Europe, the EMA indicated changing clinical evaluation requirements by initiating a revision process (Revision 7 concept paper, April 2025) for its Guideline on the evaluation of anticancer medicinal products, aligning expectations for endpoints, comparators, and subgroup evidence across tumor settings. In the United States, FDA programs such as Real-Time Oncology Review (RTOR) continue to support earlier engagement for select NDAs and BLAs after pivotal database lock, and the June 2026 FDA draft guidance on master protocols further formalized regulator expectations for complex, multi-cohort oncology trials that can generate evidence across biomarkers and tumor types more efficiently.
Competitive Landscape
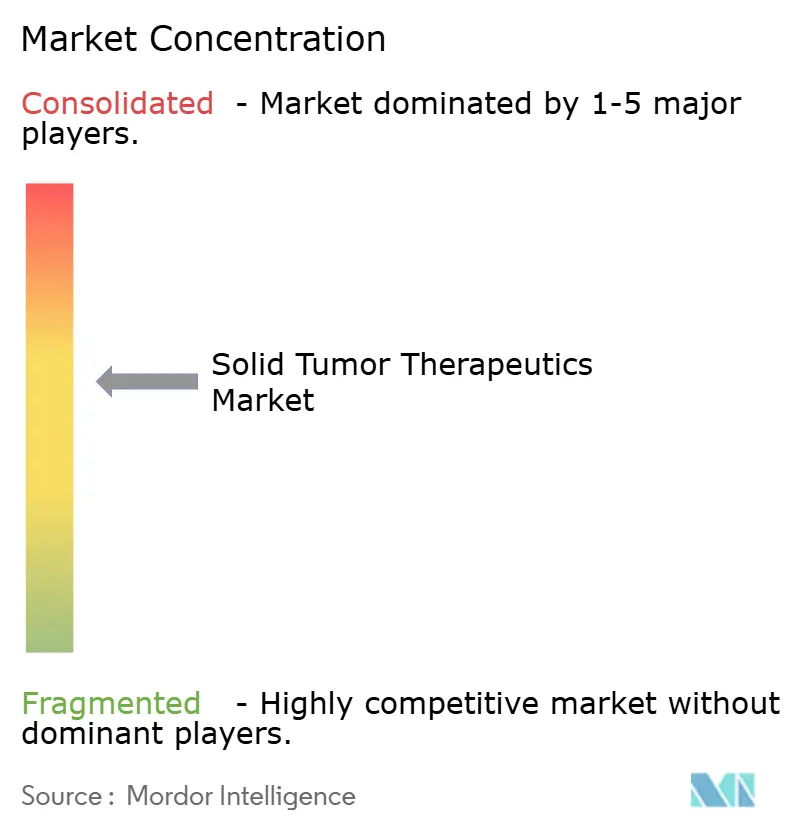
The market shows moderate concentration as top companies defend mature franchises while racing to refill pipelines ahead of patent cliffs. Pfizer’s USD 43 billion purchase of Seagen and Bristol Myers Squibb’s USD 14 billion acquisition of Karuna reflect a strategic pivot toward early-clinical assets that can offset lost blockbuster revenues. Roche is expected to retain pharmaceutical-sales leadership in 2025, leveraging Tecentriq, Avastin and Herceptin, though trastuzumab biosimilars have sliced prices by up to 90% in key markets.
Competition now centers on combination therapy design and precision-medicine platforms. AstraZeneca and Daiichi Sankyo are expanding dual-inhibition approaches with next-generation linker-payload technologies in ADCs. Smaller biotech firms are targeting difficult indications such as glioblastoma and pancreatic cancer, aiming to capture outsized value in high-unmet-need niches.
Digital capabilities are becoming differentiators: Sanofi’s partnership with Formation Bio uses machine learning to accelerate pre-clinical candidate selection, while Novartis commits over USD 1 billion to AI collaborations for compound optimization. As a result, competitive advantage increasingly depends on the speed at which companies integrate data analytics and real-world evidence into development and commercialization strategies within the solid tumor therapeutics market.
Solid Tumor Therapeutics Industry Leaders
Amgen Inc.
AstraZeneca PLC
Eli Lilly and Company
GSK plc
F. Hoffmann-La Roche AG
- *Disclaimer: Major Players sorted in no particular order
Solid Tumor Therapeutics Market Companies Covered in this Report
- Abbott Laboratories
- Amgen
- AstraZeneca
- Baxter
- Boehringer Ingelheim
- Bristol-Myers Squibb
- Eli Lilly and Company
- Roche
- GlaxoSmithKline
- Merck
- Pfizer
- Novartis
- Seagen
- Daiichi Sankyo
- Johnson & Johnson
- Sanofi
- Takeda Pharmaceuticals
- Bayer
- Eisai
- BeiGene
- Regeneron
- Exelixis
- Innovent

Market Opportunities and Future Outlook
Biomarker-led and tumor-agnostic label expansion frameworks are creating near-term commercialization whitespace across multiple solid tumors, particularly as testing infrastructure scales. In May 2026, an EMA CHMP recommendation for Enhertu (trastuzumab deruxtecan) in previously treated HER2-positive (IHC 3+) metastatic solid tumors pointed to HER2 expression beyond breast and gastric cancers, which can broaden addressable populations and affect ADC sequencing strategies. In parallel, July 2026 interim registrational data announced by GSK for dostarlimab (Jemperli) in dMMR/MSI-H locally advanced rectal cancer supports a chemo-sparing, organ-preservation treatment approach that can increase demand for companion diagnostics and structured pathways for non-operative management.
The pipeline focus on targeted combinations and bispecific immuno-oncology is also opening partnership and differentiation angles in high-volume indications such as NSCLC, where clinical programs are moving beyond single-target inhibition. Roche reported in July 2026 that divarasib demonstrated superiority versus first-generation KRAS G12C inhibitors in previously treated NSCLC (Krascendo 1), reinforcing investment toward next-generation KRAS pathways and combination strategies. Large registrational programs are providing additional commercialization runways, including Bristol Myers Squibb initiating recruiting in March 2026 for a phase 3 study of pumitamig (PD-L1 x VEGF-A) in NSCLC (ROSETTA Lung-202) and Merck initiating recruiting in June 2026 for a phase 3 trial combining calderasib (MK-1084) with durvalumab in NSCLC (KANDLELIT-015), which increases pressure on PD-(L)1 backbone adoption and raises the importance of biomarker-led patient selection.
Recent Industry Developments in Solid Tumor Therapeutics Market
- July 2026: GSK announced positive interim results from the registrational Phase II AZUR-1 trial of Jemperli (dostarlimab) in dMMR/MSI-H locally advanced rectal cancer, reporting sustained clinical complete responses at 12 months. The update strengthens a non-operative management approach that can shift treatment pathways away from surgery and chemoradiation in a biomarker-defined solid tumor subgroup.
- June 2026: The European Commission granted marketing authorization for Amgen's Imdylltra (tarlatamab-dlle) for extensive-stage small cell lung cancer. This adds another major geography for a bispecific T-cell engager platform in a high-unmet-need solid tumor, expanding competitive intensity in later-line lung cancer and influencing sequencing with chemotherapy and checkpoint inhibitors.
- November 2025: The US FDA granted full approval to Amgen's Imdelltra (tarlatamab) in extensive-stage small cell lung cancer. The conversion to full approval supports broader adoption and longer-term contracting and access planning for a BiTE therapy in solid tumor oncology.


Solid Tumor Therapeutics Market Report Scope and Research Methodology
Market Definition and Coverage
This market covers prescription medicines used to treat solid tumors, counted as therapy revenues generated across hospitals and other care settings, and tracked on a global basis across major regions.
Scope exclusions: We do not count diagnostics, screening tests, or non-therapeutic supportive care medicines that do not directly treat the tumor.
Segments Covered in This Report
- By Cancer Type
- Breast Cancer
- Lung Cancer
- Colorectal Cancer
- Prostate Cancer
- Cervical Cancer
- Other Cancer Types
- By Drug Type
- Carboplatin
- Cisplatin
- Gemcitabine
- Paclitaxel
- Doxorubicin
- Bevacizumab
- Erlotinib
- Sunitinib
- Everolimus
- Other Drug Types
- By Administration Route
- Intravenous
- Oral
- Subcutaneous
- Intratumoral
- Other Administration Routes
- Geography
- North America
- United States
- Canada
- Mexico
- Europe
- Germany
- United Kingdom
- France
- Italy
- Spain
- Rest of Europe
- Asia-Pacific
- China
- Japan
- India
- Australia
- South Korea
- Rest of Asia-Pacific
- Middle East & Africa
- GCC
- South Africa
- Rest of Middle East & Africa
- South America
- Brazil
- Argentina
- Rest of South America
- North America
Data Sources, Market Sizing, and Validation
Desk Research
Desk work starts by setting the disease and treatment backdrop, then mapping which therapy categories are actually used for solid tumors. Public sources such as the World Health Organization, the US National Cancer Institute, GLOBOCAN, and the US FDA are used to anchor incidence estimates, typical treatment standards, and approval timelines that drive demand changes.
To avoid over-counting, we also refer to sources such as OECD health statistics, national health ministry publications, and open peer reviewed oncology journals to sanity check utilization patterns and the lines of therapy that usually translate into volumes. Alongside this, company annual reports, investor presentations, and reputable press releases are used to understand therapy mix shifts and how pricing is discussed. Where needed, we also use paid subscription access for company financials and for patent intelligence to confirm revenue exposure and the pace of innovation. This list is illustrative, and additional public sources are used for collection, cross-checking, and clarification.
Primary Interviews and Surveys
Primary work focuses on validating what the desk inputs cannot fully show, especially mix shifts across modalities, how pricing is realized after discounts, and how quickly adoption changes following approvals. We spoke with stakeholders across manufacturers, distributors, providers, and payer facing roles, then tested assumptions across the Americas, EMEA, and APAC so regional care pathways and access constraints are reflected in the final inputs.
Distribution of primary research fieldwork respondents
| Company type | Respondent position | Region |
|---|---|---|
| Top tier: 33% | CXOs: 14% | APAC: 43% |
| Mid tier: 52% | Functional/Unit leaders: 26% | EMEA: 33% |
| Smaller Players: 15% | Managers: 60% | Americas: 24% |
Market-Sizing & Forecasting
Sizing is built mainly through a top-down pathway where the treated patient pool and therapy uptake are reconstructed by major tumor types and therapy approaches, and then translated into value using typical annual cost ranges. Once that structure is in place, selective bottom-up checks are run using sampled therapy revenues, channel checks on demand intensity, and ASP times volume approximations to keep totals realistic and to adjust any obvious gaps.
Key model inputs include solid tumor incidence and prevalence signals, the split of patients by stage and line of therapy, adoption rates for immuno-oncology and targeted therapies, the pace of new approvals and label expansions, and net price realization patterns after rebates and tendering. We also track typical combination therapy patterns, because counting a regimen incorrectly can inflate value. Forecasting is anchored in scenario analysis, where base case demand is tied to epidemiology and access, and then stress tested using alternative assumptions for launch timing, competitive intensity, and price erosion. When data is thin for smaller geographies, proxy uptake curves are used from comparable markets and then corrected through interview feedback.
Data Validation & Update Cycle
Validation is done in steps so single source bias does not slip into the final totals. Model outputs are compared against independent signals such as therapy mix commentary, approval timelines, and visible shifts in clinical practice, and outliers are reviewed before sign-off through an internal analyst check.
If a major variance is seen, the assumption is revisited and the relevant experts are re-contacted, especially for pricing changes, access restrictions, or a large clinical readout that shifts standards of care. Reports are refreshed annually, and interim updates are made when material events occur. Before delivery, a fresh update pass is completed so clients receive the latest consistent view.
Mordor Intelligence's Solid Tumor Therapeutics Market Size Compared With Other Published Estimates
Published market sizes for solid tumor therapeutics can look far apart because teams pick different year anchors, scope boundaries, and ways to treat pricing and patient mix. Differences also show up when one estimate leans more on list prices, while another relies more on treated population logic and real world net pricing behavior.
The biggest gap drivers in this market usually come from how combination regimens are counted, whether hospital administered and oral therapies are treated consistently, and how pricing is converted and updated across regions. A refresh-led approach matters here because approvals, label expansions, and discounting can shift within a year, and then older currency rates or stale ASP assumptions can pull totals away from what is happening in practice. For that reason, the estimate is kept current through update checks and then finalized in USD with consistent timing in Mordor Intelligence.
Benchmark comparison
| Source | Market Size | Gaps in Research Methodology |
|---|---|---|
| Mordor Intelligence | USD 223.65 B (2026) | |
| Industry Publisher A | USD 68.30 B (2024) | Uses a narrower value construct that appears to exclude several high value solid tumor therapy revenues or counts a smaller treated pool, and its base year sits earlier, which can miss newer adoption and pricing shifts. |
| Global Consultancy B | USD 146.88 B (2025) | Applies a different timing window and scope interpretation, and its pricing build can diverge if net discounts, regimen stacking, and regional currency conversions are not refreshed and normalized the same way. |
The spread across figures is mainly explained by scope boundaries, year timing, and how therapy mix and net pricing are treated, especially for combination use and post-approval uptake. By keeping the steps tied to clear demand and pricing inputs, the final number remains traceable and repeatable, even when assumptions are re-tested during updates.


Key Questions Answered in the Report
What is the current value of the solid tumor therapeutics market?
The solid tumor therapeutics market size reached USD 223.65 billion in 2026, supported by strong demand for precision and immuno-oncology therapies.
How fast is the solid tumor therapeutics market expected to grow?
Between 2026 and 2031, the market is projected to expand at an 7.88% CAGR, adding roughly USD 103 billion in new revenue.
Which cancer type contributes the most to market revenue?
Breast cancer leads with 25.41% of total revenue in 2025, reflecting its broad therapeutic arsenal and rapid uptake of antibody-drug conjugates.
Which region is growing the quickest?
Asia-Pacific exhibits the fastest growth, forecast at a 9.38% CAGR as China, Japan and India scale clinical trials and accelerate approvals.
What delivery route is gaining popularity among patients?
Oral formulations are the fastest-growing administration route, projected for a 10.49% CAGR thanks to patient convenience and expanding small-molecule pipelines.
Why are antibody-drug conjugates significant?
ADCs combine targeted delivery with high-potency payloads, driving survival benefits and capturing increasing investment, with sales expected to quadruple by 2033.
Page last updated on:


 Your data is secure and never sold or shared.


