
Market Overview
| Study Period | 2022 - 2031 |
|---|---|
| Forecast Data Period | 2026 - 2031 |
| Historical Data Period | 2022 - 2024 |
| Growth Rate | 1.07 % |
| Market Concentration | Low |
Major Players *Disclaimer: Major Players sorted in no particular order Image © Mordor Intelligence. Reuse requires attribution under CC BY 4.0. | |
Russian Federation Power Market Analysis by Mordor Intelligence
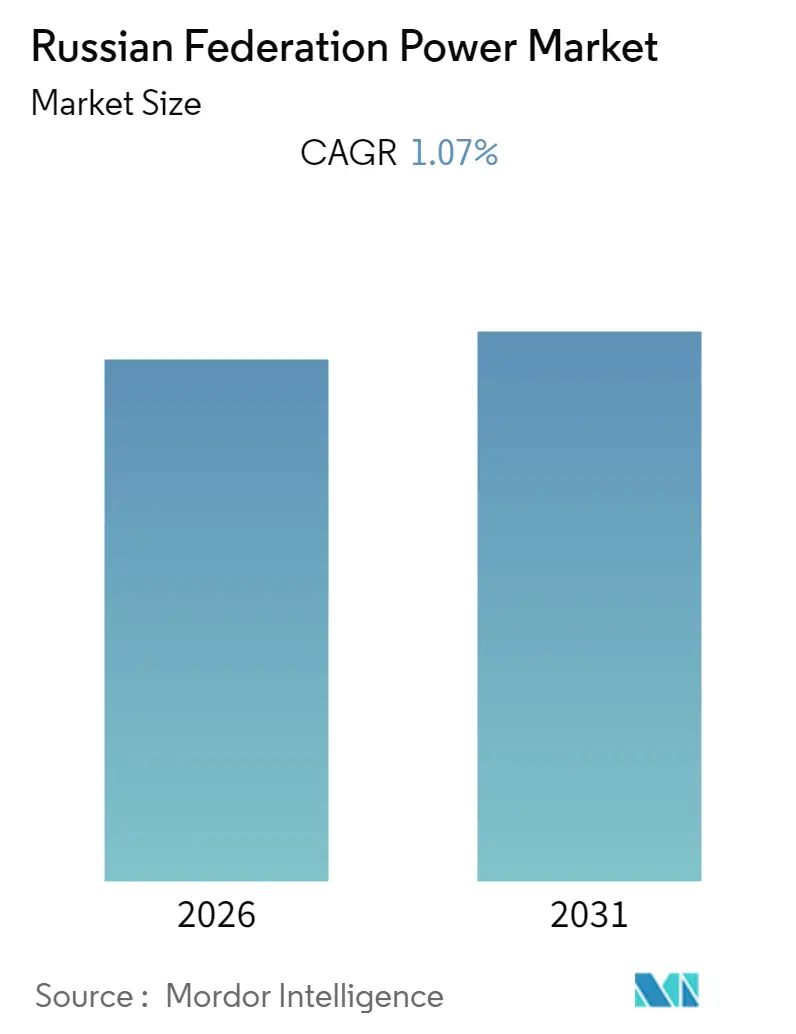
The Russian Federation Power Market size is expected to register a CAGR of 1.07% during the forecast period.
The market was negatively impacted by COVID-19 in 2020. However, it has now reached pre-pandemic levels.
- Over the medium term, factors such as rapid urbanization, technical advancement, and the increasing demand for electricity owing to industrialization are expected to drive the Russian Federation power market during the forecast period.
- On the other hand, the high initial investment required for the grid development and installation of renewable sources is very high, which can hinder the growth of the market in the forecast period.
- Nevertheless, thermal power generation is expected to dominate the power generation in the country. With vast reserves of oil and natural gas, the share of hydrocarbons, especially natural gas, is increasing in power generation of the Russian Federation. Hence, this is expected to create opportunities for companies in the country.
Note: Market size and forecast figures in this report are generated using Mordor Intelligence’s proprietary estimation framework, updated with the latest available data and insights as of 2026.
Russian Federation Power Market Trends and Insights
Thermal Power Generation a Major Source of Energy
- Thermal power generation uses a variety of sources ranging from fossil fuels like coal and oil to renewable sources like wind and solar. The energy mix for electricity generation is dominated by fossil fuels like coal, oil, and natural gas, with the three constituting over 75% of the global energy mix.
- The power generation mix is heavily skewed toward natural gas, with a significant contribution because of cheaper domestic fuel availability and the vast reserves in Russia. Its share in the mix has increased over the years due to constraints in adding other conventional generation sources - hydro, solar, and oil.
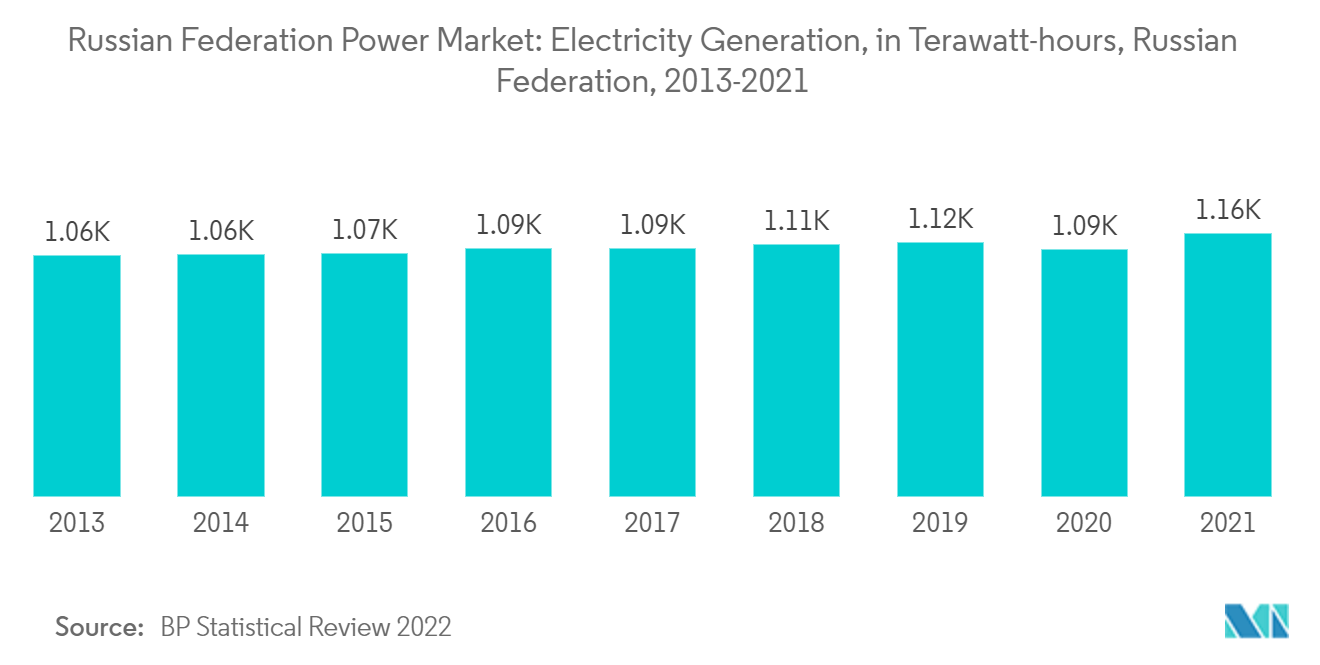
- Moreover, power generation in Russia increased by 6.9%. In 2021, the power generation was 1,157.1 terawatt-hours compared to 2020, which was 1,085.4 terawatt-hours.
- The dynamic power market of the Russian Federation is going to reduce the oil share grade. Still, with vast reserves, natural gas and oil will remain the primary energy source in the forecast period.
- In November 2022, The Taganrog Boiler-Making Works "Krasny Kotelshchik" (TKZ) announced that it was planning to supply a convection superheater at Nizhnekamsk CHPP. The long-term comprehensive program for the modernization of the plant boiler equipment is implemented by the official dealer of the Taganrog enterprise in Tatarstan - the TKZ-Service company.
- Owing to the above-mentioned factors, thermal power generation is likely to be a significant energy source.
Growing usage of renewables and nuclear power to witness significant growth
- Russia is making significant progress in using nuclear energy more extensively, including the development of new reactor technology. The country runs 38 nuclear power reactors and is rapidly advancing plans to increase the use of nuclear energy.
- With a target share of 4.5% in total electricity from renewables by 2024, Russia is planning to shift toward renewables. Under the Russian Energy Strategy, Russia had planned to install 25 GW of renewable energy by 2030. Also, in January 2022, the Russian government approved a new tender scheme for renewables for the period 2025-2034, the total budget for which is USD 1.88 billion.
- In November 2021, Russian PV manufacturer Hevel completed the construction of its 30 MW Russko-Polyanskaya solar plant in Western Siberia. The solar field is expected to generate 35.5 GWh, enough to power 3,000 rural houses, the local government estimated. The plant cost is around USD 40 million.
- Moreover, Russia is highly dependent on its hydrocarbon reserves for energy requirements, which is an additional factor apart from the massive cost involved in the development of renewable energy sources. Bold steps and policies are expected to be taken with the upcoming Energy Strategy for 2030 implementation.
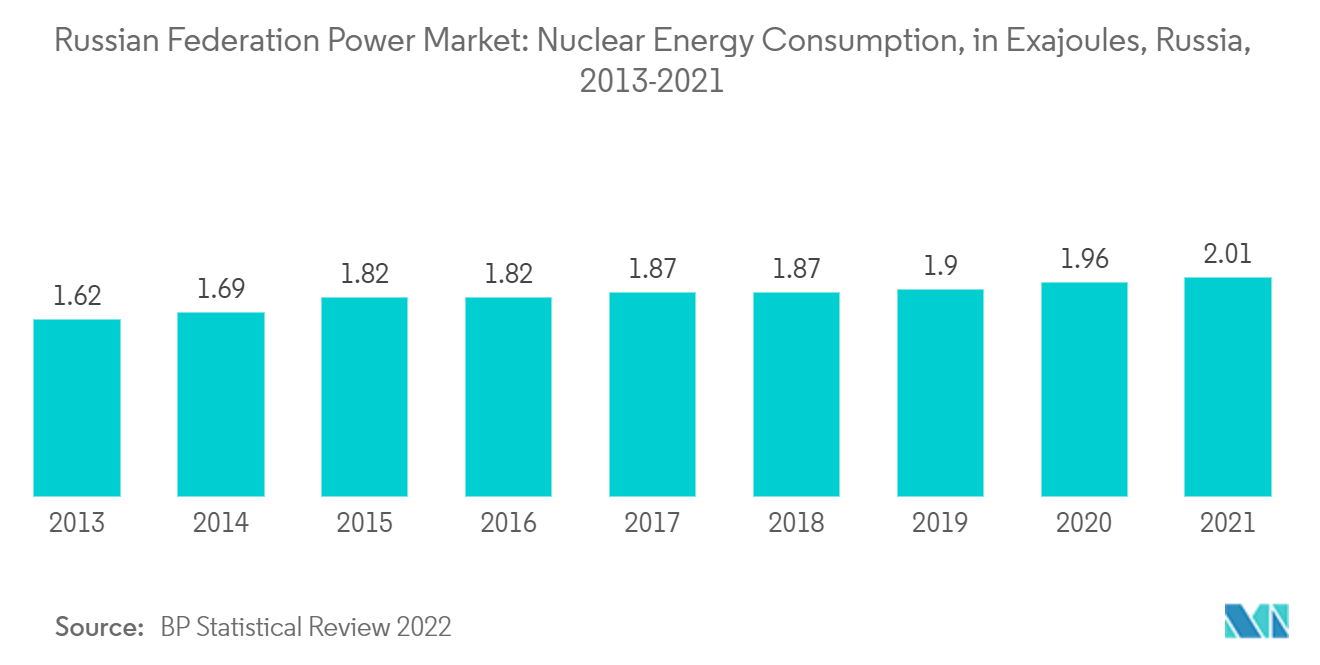
- Russia's nuclear energy consumption increased by 2.9%. In 2021, the nuclear energy consumption was 2.01 Exajoules as compared to 2020, which was 1.96 Exajoules.
- Owing to the above-mentioned points, the usage of renewable and nuclear energy is likely to increase during the forecast period.
Regulatory Landscape
Russia's power sector continues to be governed by Federal Law No. 35-FZ (On the Electric Power Industry). The Ministry of Energy sets federal policy for the fuel and energy complex, while the Federal Antimonopoly Service (FAS) oversees tariff regulation and market supervision. In October 2025, Government Resolution No. 1704 updated the rules for the wholesale market of electric energy and capacity, reinforcing the framework used by market participants for trading, dispatch, and capacity mechanisms.
Tariff setting and price parameters for 2026 remained centralized through FAS instruments. FAS Orders 1130/25 and 1127/25 set federal limits for retail electricity tariffs for the population for 2026, while also setting capacity prices for new nuclear and hydro facilities for 2026. These annual instruments underpin revenue visibility for generators and regulated network companies as additional 2026 amendments take effect.
Value Chain Analysis
The value chain in the Russian power market runs from primary energy supply (gas, coal, nuclear fuel, and hydro resources) through generation, transmission, distribution, and retail supply, with system operation and market arrangements governed by federal rules. Thermal generation remains tightly linked to domestic fuel availability, with major integrated players such as Gazprom Energoholding (including Mosenergo, TGC-1, and OGC-2) supplying electricity and heat, while nuclear generation and new-build programs are centered on Rosatom and its operating arm.
On the networks side, high-voltage transmission under the Unified National Electric Grid is operated by Rosseti FGC UES, which reports coverage across 15.1 million square kilometers and over 149,000 km of transmission lines. It connects large generation centers to industrial load and regional distribution companies. Equipment and services act as an enabling layer across the chain, with domestic manufacturers such as Power Machines JSC supplying turbines and heavy equipment for thermal, nuclear, and hydro plants; the April 2025 approval of the Energy Strategy until 2050 further reinforces localization priorities and grid development programs as levers for reliability and capacity additions.
Competitive Landscape
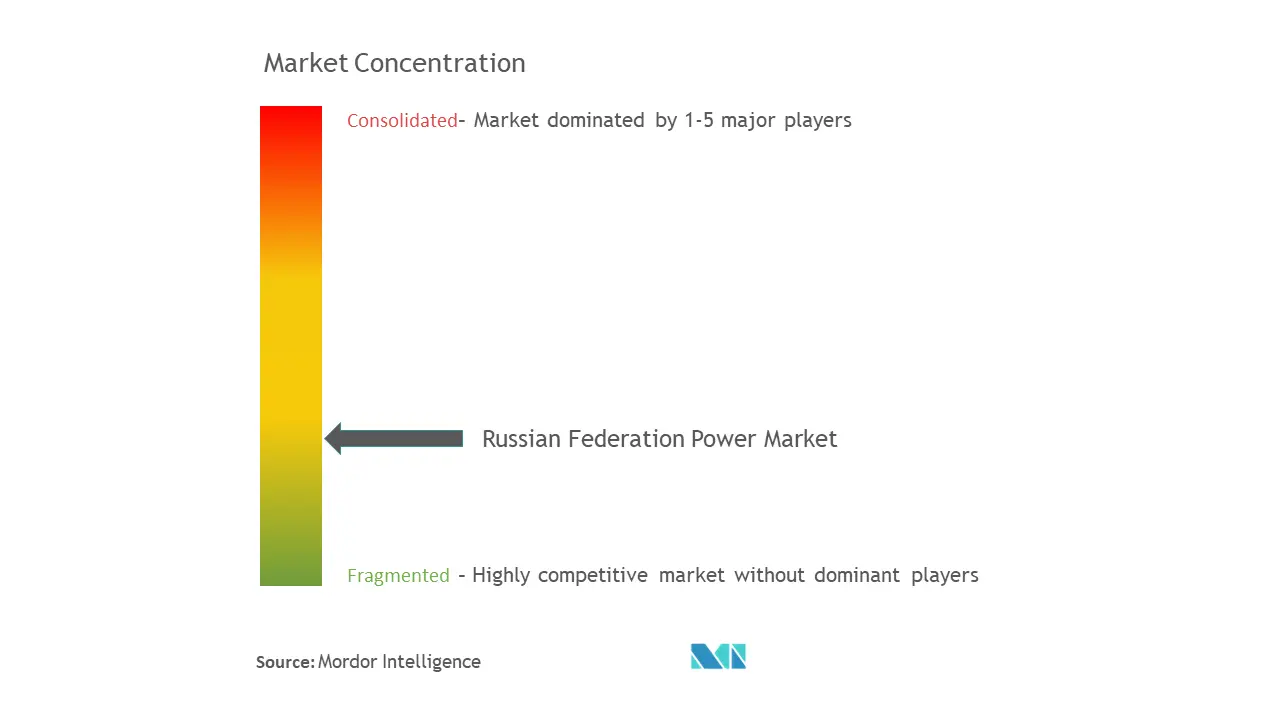
The Russian Federation Power Market is moderately fragmented. The major companies include (in no particular order) RusHydro PJSC ADR, Rosatom Corp., Gazprom PJSC, Rosseti PJSC, and Inter RAO UES PJSC.
Russian Federation Power Industry Leaders
-
RusHydro PJSC ADR
-
Rosatom Corp
-
Gazprom PJSC
-
Rosseti PJSC
-
Inter RAO UES PJSC
- *Disclaimer: Major Players sorted in no particular order
Market Opportunities and Future Outlook
Nuclear build-out and uprating activity provide an investment-led pathway for new capacity and grid-stability services. Rosenergoatom connected the first new VVER-TOI unit at Kursk II to the grid on 31 December 2025 (reported at 240 MW at the time), and in March 2026 Unit 1 at Kursk-II reached full power during pilot operation. This expanded commissioning activity creates demand across EPC, turbine-island equipment, commissioning services, and related transmission connections.
Digitalization and system-planning programs also broaden addressable demand beyond generation toward grid analytics, automation, and operational efficiency tools. The Government of Russia approved a Strategic Direction for digital transformation of the fuel and energy complex until 2036 (Order No. 373-r dated 26 February 2026). Planning documents such as the Scheme and Program for the Development of Electric Power Systems of Russia for 2026-2031 and the general plan for electric power facilities up to 2042 (including 88.477 GW of new generation in the plan) expand procurement scope for dispatch software, digital twins, cybersecurity, substation automation, and network modernization services aligned with federal priorities.
Recent Industry Developments
- June 2026: Inter RAO increased its stake in PJSC Saratovenergo to 84.2634% through its structure Active Energy LLC. The transaction deepens Inter RAO's influence over a regional retail and distribution-linked asset base and supports tighter coordination between generation, supply, and customer-side operations. This expansion strengthens the group's regional coverage and enables it to optimize cross-asset dispatch and service delivery.
- May 2026: RusHydro disclosed planned capital expenditure financing for 2026-2030 totals RUB 960.59 billion, with RUB 329.45 billion allocated for 2026. The scale of the program indicates continued procurement for hydro asset modernization, grid connections, and supporting infrastructure, shaping demand for domestic equipment and contractors. It also reflects ongoing supplier localization and capability upgrades across hydro projects.
- April 2026: Inter RAO completed consolidation of its engineering assets under Inter RAO Engineering Company and set a 2026-2030 investment program of RUB 30 billion. This consolidation strengthens in-house EPC and service capabilities, which helps the company execute retrofit and modernization work and address equipment localization needs across the power fleet. The move increases project execution scalability and aligns with domestic supply chain localization priorities.
Research Methodology Framework and Report Scope
Market Definition and Coverage
For this report, the market covers the Russian Federation power system as a whole, focusing on electricity supply and grid availability as reflected through installed capacity and network build out.
Scope exclusions: retail electricity tariffs, customer billing revenues, and fuel price pass through effects are not counted unless they directly change installed capacity totals.
Segmentation Overview
- Generation
- Thermal
- Hydroelectric
- Renewable
- Other Generations
- Transmission and Distribution
Data Sources, Market Sizing, and Validation
Desk Research
Desk research was used to build the starting dataset on Russia's generation fleet and grid, and to align definitions before any modeling assumptions were applied. We relied on public energy statistics and system planning materials that disclose capacity additions, retirements, and technology mix over time.
Typical sources included official releases and datasets such as the IEA and IRENA statistics portals, World Bank energy indicators, UN Comtrade for equipment trade signals, and policy and technical publications from federal energy authorities and system operator-level documents where available. These were complemented with company annual reports, investor decks, and reputable press coverage, and then cross checked against a paid subscription used for company financials, patent lookups, and selected import export shipment validation. The sources listed here are illustrative only and not exhaustive, and many other public documents were also reviewed for data collection, cross checks, and clarification.
Primary Interviews and Surveys
We conduct expert interviews and surveys with Russian generation, grid, utility, engineering, and large-consumer participants. Their input is used to test secondary data, clarify capacity additions and retirements, check tariff and utilization assumptions, and resolve gaps in the Russia market model before final approval.
Distribution of primary research fieldwork respondents
| Company type | Respondent position |
|---|---|
| Top tier: 28% | CXOs: 15% |
| Mid tier: 47% | Functional/Unit leaders: 32% |
| Smaller Players: 25% | Managers: 53% |
Market-Sizing & Forecasting
Sizing is anchored on a market specific top-down build where generation and grid capacity series are reconstructed from plant additions, retirements, life extension events, and transmission and distribution expansion programs. Once those totals are formed, they are corroborated with selective bottom-up checks such as sampled project pipelines by region, supplier shipment patterns for major equipment, and reality checks using average unit sizes by technology.
Key inputs used in the model include installed capacity by technology, commissioning lead times, retirement and refurbishment cycles, grid connection and curtailment risk flags, and policy-driven capacity procurement schedules. Since some projects are announced long before they are grid ready, gaps were handled by applying probability weights and timing shifts that were validated through interviews. Forecasting was done using scenario analysis supported by simple time series smoothing on the historical capacity trend, and then adjusted where primary inputs suggested a different commissioning pace in the next few years.
Data Validation & Update Cycle
Results are checked in several steps so that large jumps in capacity or unusual slowdowns are explained before sign off. We compare the model outputs against independent signals such as annual generation levels, technology mix changes, and publicly stated network upgrade milestones, then investigate variances that fall outside expected ranges.
An analyst review is performed at each stage, and re-contact is triggered when a key assumption changes or when new system plans materially shift commissioning timing. Reports are refreshed annually, with interim updates for material events, and a final pre delivery pass is completed so the latest public data is reflected in the published view.
Mordor Intelligence's Russian Federation Power Market Size Versus Other Published Estimates
Published market sizes for Russia's power sector can look far apart because some sources value the sector as revenue, while others size it as physical capacity or network build out. Differences also show up when the base year is not aligned, or when currency conversion and inflation timing are handled inconsistently.
In a refresh-led read, the spread usually comes from when assumptions are updated, what exchange rate window is used, and whether pricing is tied to regulated tariffs or to capex proxies. By rechecking commissioning status close to release and keeping currency timing consistent for the comparison year, the capacity-anchored view stays more stable across updates, which is a concrete modeling control applied by Mordor Intelligence.
Benchmark comparison
| Source | Market Size | Gaps in Research Methodology |
|---|---|---|
| Mordor Intelligence | USD 0.00 B (2024) | |
| Industry Publisher A | USD 45.01 B (2024) | This figure is presented as a value market and reads closer to an electricity sector revenue view, which can include tariff effects and utility turnover that do not translate into capacity additions. |
| Industry Publisher B | USD 87.40 B (2026) | The estimate is for a later year and likely blends broader grid scope and a faster value build, so timing effects and price uplift can push the number higher than a capacity anchored view. |
The table shows that year choice and what is being monetized are the two biggest drivers behind the gap. When the sizing is kept traceable to capacity change, project timing, and a clearly stated conversion window, the final number becomes easier to reproduce and to stress test for planning decisions.
Key Questions Answered in the Report
What is the current Russian Federation Power Market size?
The Russian Federation Power Market is projected to register a CAGR of 1.07% during the forecast period (2026-2031)
Who are the key players in Russian Federation Power Market?
RusHydro PJSC ADR, Rosatom Corp, Gazprom PJSC, Rosseti PJSC and Inter RAO UES PJSC are the major companies operating in the Russian Federation Power Market.
What years does this Russian Federation Power Market cover?
The report covers the Russian Federation Power Market historical market size for years: 2021, 2022, 2023 and 2024. The report also forecasts the Russian Federation Power Market size for years: 2026, 2027, 2028, 2029, 2030 and 2031.