Market Overview
| Study Period | 2018 - 2031 |
|---|---|
| Forecast Data Period | 2026 - 2031 |
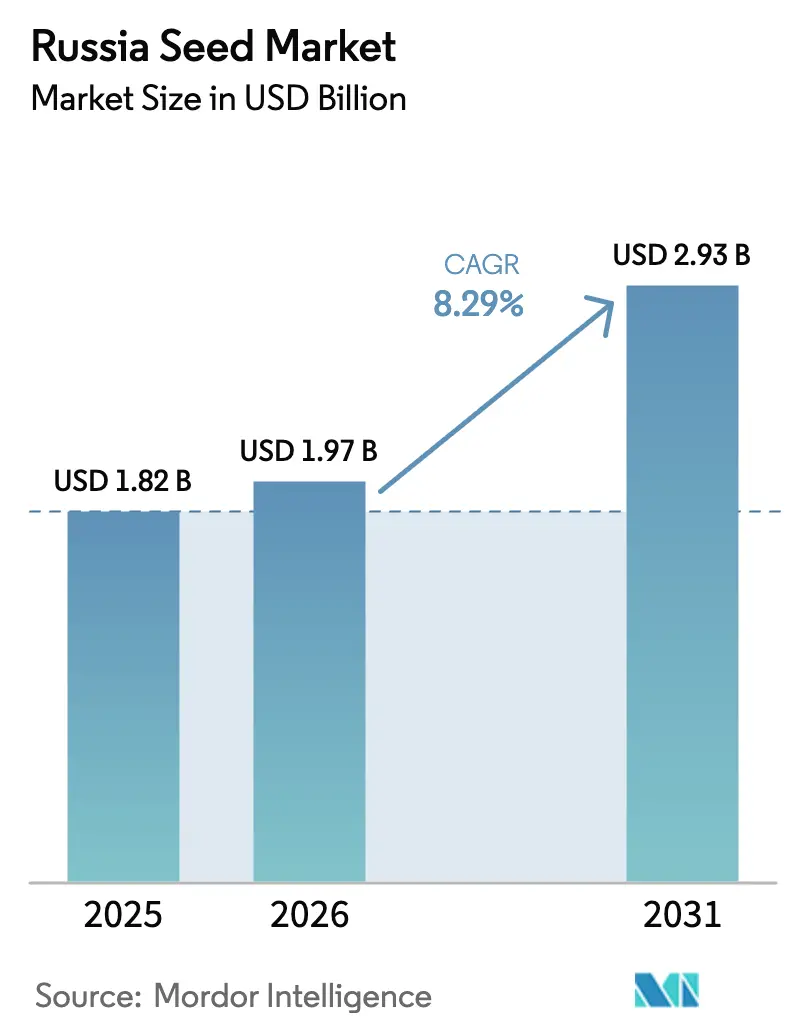
| Base Year Market Size (2025) | USD 1.82 Billion |
| Market Size (2026) | USD 1.97 Billion |
| Market Size (2031) | USD 2.93 Billion |
| Growth Rate (2026 - 2031) | 8.29% CAGR |
| Market Concentration | Low |
Major Players *Disclaimer: Major Players sorted in no particular order Image © Mordor Intelligence. Reuse requires attribution under CC BY 4.0. | |
Russia Seed Market Analysis by Mordor Intelligence
Russia seed market size in 2026 is estimated at USD 1.97 billion, growing from 2025 value of USD 1.82 billion with 2031 projections showing USD 2.93 billion, growing at 8.29% CAGR over 2026-2031. Momentum comes from a record USD 6.2 billion support package that channels subsidies toward domestic breeding, a sharp fall in foreign seed imports after Order No. 72, and rapid greenhouse expansion around Moscow and St. Petersburg. Domestic producers are capturing share as multinational firms localize production to comply with majority-Russian ownership rules. Uptake of drought-tolerant wheat hybrids in the Volga and Southern regions, coupled with digital traceability mandates, accelerates certified seed adoption. Currency volatility and tight farm credit temper gains, but are outweighed by contract-farming programs that guarantee seed demand for grain, oilseed, and vegetable supply chains.
Key Report Takeaways
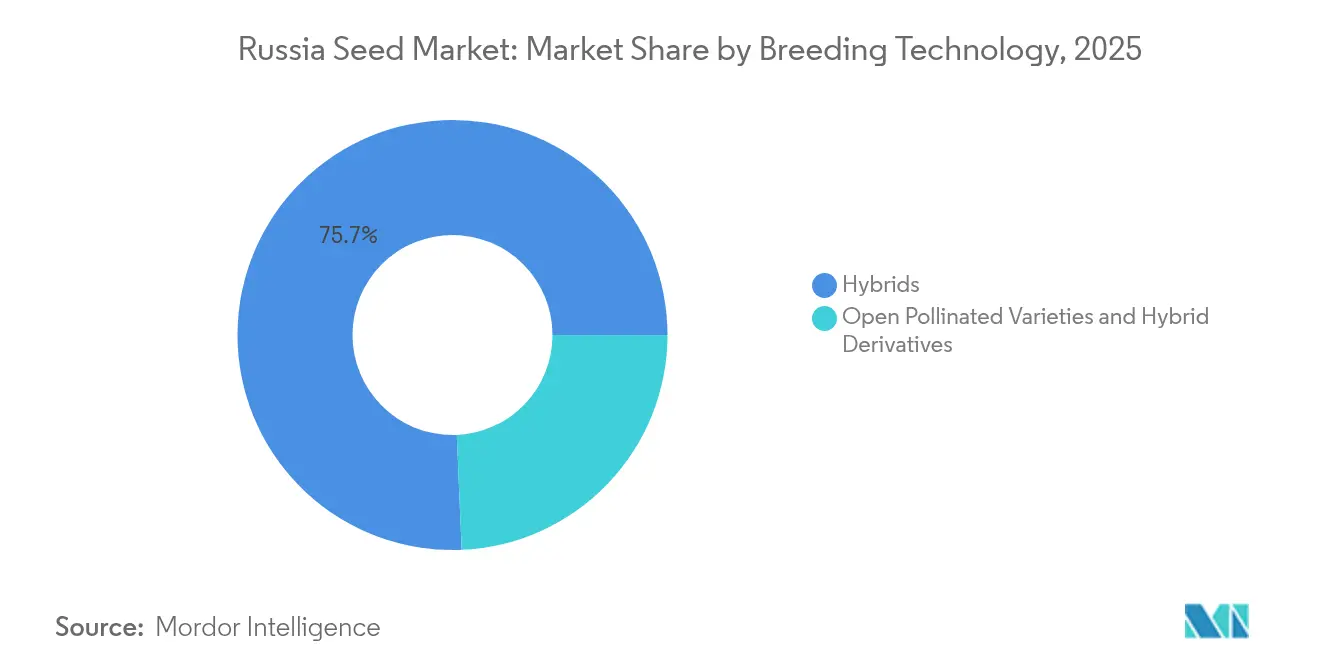
- By breeding technology, hybrids held 75.68% of the Russia seed market share in 2025, and are forecast to expand at an 8.72% CAGR through 2031.
- By cultivation mechanism, open field systems commanded a 99.82% share of the Russia seed market size in 2025, while protected cultivation is advancing at an 11.45% CAGR to 2031.
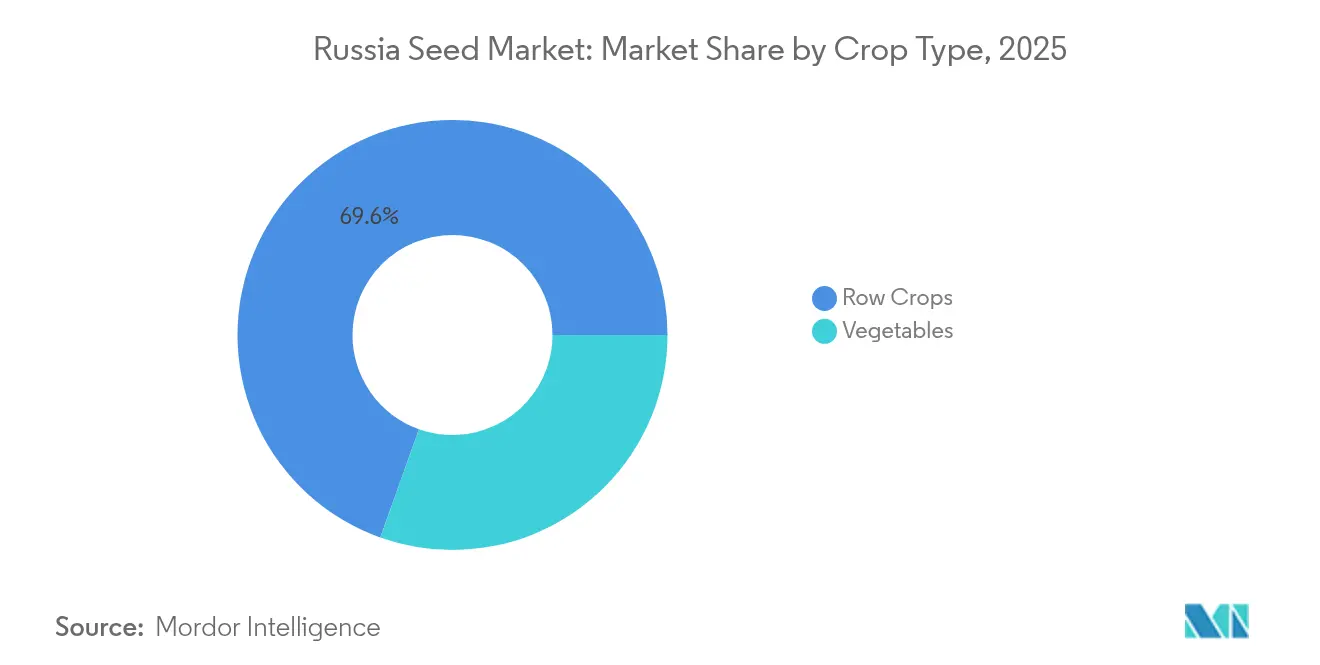
- By crop type, row crops accounted for a 69.55% share of the Russia seed market size in 2025, and vegetables are growing at an 10.98% CAGR through 2031.
- The market structure is fragmented, with Bayer AG, Syngenta Group, EkoNiva Group, BASF SE, and Groupe Limagrain collectively holding approximately 19% of the Russia seed market share in 2024.
Note: Market size and forecast figures in this report are generated using Mordor Intelligence’s proprietary estimation framework, updated with the latest available data and insights as of 2026.
Russia Seed Market Trends and Insights
Drivers Impact Analysis*
| Driver | (~) % Impact on CAGR Forecast | Geographic Relevance | Impact Timeline |
|---|---|---|---|
| State subsidy escalation for domestic seed breeding | +2.1% | National, concentrated in the Central Federal District and Volga regions | Medium term (2-4 years) |
| Rapid uptake of drought-tolerant wheat hybrids | +1.8% | Volga Federal District, Southern Federal District, North Caucasus | Short term (≤ 2 years) |
| Sanctions-driven import substitution of vegetable seeds | +1.5% | National, with early gains in Moscow, St. Petersburg, Krasnodar regions | Medium term (2-4 years) |
| Growth of contract farming by meat/dairy integrators | +1.2% | Central Federal District, Volga regions, with spillover to Siberia | Long term (≥ 4 years) |
| Digital agronomy platforms boosting certified seed demand | +0.9% | National, prioritizing large agricultural enterprises | Medium term (2-4 years) |
| Expansion of protected cultivation acreage | +0.6% | Moscow Oblast, Leningrad Oblast, adjacent regions | Long term (≥ 4 years) |
| Source: Mordor Intelligence | |||
State subsidy escalation for domestic seed breeding
A RUB 559 billion (USD 6.2 billion) 2025 support plan shifts public funding from yield-based incentives toward breeding infrastructure, obliging foreign companies to localize 51% ownership and full production cycles[1]Source: Ministry of Agriculture of the Russian Federation, “Agricultural Support and Development Programs 2025,” mcx.gov.ru. Prioritized crops include wheat, corn, sunflower, and soybean, with targets for national seed self-sufficiency by 2028. Dedicated centers receive preferential credit and tax relief, narrowing the technology gap between Russian and imported genetics. The policy lowers entry barriers for regional institutes and triggers private R&D, stimulating the Russia seed market despite near-term margin pressure on multinationals. Enhanced public-private collaboration accelerates variety registration and shortens commercialization timelines.
Rapid uptake of drought-tolerant wheat hybrids
Climate adaptation pressures accelerated the adoption of drought-tolerant wheat varieties across Russia's primary grain-producing regions, with the Volga Federal District and Southern regions leading hybrid deployment. The 2024 growing season demonstrated the commercial viability of these varieties, as farmers in drought-prone areas achieved yield stability despite irregular precipitation patterns[2]Source: USDA Foreign Agricultural Service, “Russia Agricultural Situation Report 2024,” fas.usda.gov. Large farms in Stavropol and Krasnodar adopted hybrids first, showcasing resilience in stress years and setting a template for neighboring districts. Demonstration plots funded by regional ministries underscore risk-mitigation benefits, encouraging banks to extend input credit against hybrid-backed yield forecasts. Breeding institutes capitalize on cross-licensing germplasm with South American winter nurseries, achieving two cycles per year and compressing release schedules. The early success builds momentum for certified seed purchases and raises the long-run ceiling for cereal yields, fortifying the Russia seed market.
Sanctions-driven import substitution of vegetable seeds
Import restrictions implemented through Government Order No. 72 in January 2024 created immediate supply constraints for vegetable seeds from countries, catalyzing domestic production expansion. Russian vegetable seed imports declined dramatically, with corn seed imports falling 6-fold, sunflower seeds dropping 2.3-fold, and potato seed imports decreasing compared to pre-sanctions levels[3]Source: Government of the Russian Federation, “Order No. 72 on Temporary Quantitative Restrictions,” cis-legislation.com. Compliance paperwork and origin checks raise transaction costs for foreign suppliers, steering greenhouse operators toward domestic hybrids. Russian companies respond by scaling tomato, cucumber, and pepper breeding programs, leveraging state grants for greenhouse-specific disease screening. The supply shock also reshapes retail assortments as domestic brands replace Western varieties in supermarket contracts, lifting average selling prices per seed unit and boosting margins across the Russia seed market.
Growth of contract farming by meat and dairy integrators
Processors such as Cherkizovo embed seed procurement into long-term supply agreements that guarantee farmers input financing, technical support, and off-take prices. Integrators gain traceable raw material quality while growers secure working capital at below-market rates. The bundled model enlarges certified seed volumes for corn silage, soybean, and forage crops used in feed rations. Over time, the closed-loop approach raises the baseline for input quality, fostering demand certainty that underpins breeder investment and strengthens the Russia seed market.
Restraints Impact Analysis*
| Restraint | (~) % Impact on CAGR Forecast | Geographic Relevance | Impact Timeline |
|---|---|---|---|
| Currency volatility raising breeding input costs | -1.4% | National, particularly affecting import-dependent regions | Short term (≤ 2 years) |
| Farmers' limited access to long-term credit | -1.1% | National, concentrated in smaller agricultural regions | Medium term (2-4 years) |
| Regulatory uncertainty on gene-editing approvals | -0.8% | National, affecting biotechnology development centers | Long term (≥ 4 years) |
| Fragmented on-farm seed saving culture among smallholders | -0.7% | Rural regions, particularly in Siberia and Far East | Long term (≥ 4 years) |
| Source: Mordor Intelligence | |||
Currency volatility raising breeding input costs
A weaker ruble inflated imported lab reagents, molecular markers, and greenhouse materials, lifting industrial crop seed prices and feed-forage seed in 2024. While large firms hedge using forward contracts, small breeders lack sophistication and cut R&D outlays. Exchange-rate swings also complicate multiyear budget planning, delaying equipment upgrades and slowing new variety releases. Unless macro stability improves, breeders will redirect resources to lower-cost phenotypic selection, constraining genetic gain cycles across the Russia seed market.
Farmers’ limited access to long-term credit
Credit market constraints significantly limit farmers' ability to invest in premium seed varieties and adopt advanced agricultural technologies, particularly affecting smaller and medium-sized operations. This credit squeeze forces farmers to prioritize short-term cash flow over long-term productivity investments, leading many to continue using lower-cost, saved seed rather than purchasing certified varieties. The constraint particularly affects the adoption of hybrid varieties that cannot be replanted, limiting market penetration for the highest-value seed segments and constraining overall market growth potential.
*Our forecasts treat driver/restraint impacts as directional, not additive. The impact forecasts reflect baseline growth, mix effects, and variable interactions.
Segment Analysis
By Breeding Technology: hybrids consolidate leadership
Hybrid seeds retained 75.68% Russia seed market share in 2025, and the segment is projected to expand at an 8.72% CAGR to 2031. Hybrid vigor offers reliable yield gains, particularly in corn, sunflower, and vegetables, where heterosis produces noticeable return on input spend. Domestic breeders accelerate release cycles by operating winter nurseries in Argentina and Chile, effectively doubling annual generation advancement. The Federal blockchain registry requires hybrid lots to carry unique digital IDs, deterring counterfeit activity and enhancing farmer confidence. As localization rules push multinationals to co-invest in local plants, technology transfer accelerates and broadens hybrid availability, underpinning the Russia seed market.
Non-transgenic hybrids dominate because GMO cultivation is banned, yet marker-assisted selection boosts precision without breaching regulations. Open-pollinated and derivative varieties remain relevant for cost-sensitive crops like barley and some forage species. Declining price gaps and escalating climate variability shift value toward hybrids. As protected cultivation rises, specialty greenhouse hybrids command price premiums that outweigh their minimal land share, lifting hybrid revenue contribution above acreage statistics.


By Cultivation Mechanism: protected systems gain revenue heft
Open field farming represented 99.82% of the planted area and therefore the bulk of the Russia seed market size in 2025. Yet protected cultivation posted 11.45% CAGR and is forecast to widen its value slice by 2031. Capital flows into high-tech glasshouses near Moscow and Leningrad reflect consumer demand for year-round fresh produce and retailers’ preference for traceable domestic supply. These facilities use disease-resistant, fast-cycling hybrids, driving seed value per hectare far above open-field norms. Seed companies respond with varieties tuned to hydroponics, low-light conditions, and compact plant architecture.
The greenhouse boom also stimulates ancillary innovations such as grafted seedlings and coated pelleted seed that ensure uniform emergence in climate-controlled systems. Subsidized energy tariffs and improved logistics further support profitability, encouraging regional authorities to replicate the model in Kazan and Novosibirsk. Despite their small footprint, protected systems’ higher unit seed prices allow them to punch above their acreage in shaping revenue flows within the Russia seed market.
By Crop Type: vegetables accelerate on import substitution
Row crops contributed 69.55% of revenue in 2025 due to vast wheat and oilseed acreages and are expected to maintain a steady share as export programs continue. Wheat, corn, sunflower, and soybean dominate volumes, while forage crops underpin livestock integration. Fiber crops such as cotton represent niche opportunities concentrated in the South. Yield-enhancing hybrids and improved agronomy keep row-crop seed demand resilient, but growth is moderate compared with specialty segments.
Vegetables registered the fastest 10.98% CAGR on the back of sanctions-driven supply gaps and protected cultivation scale-up. Tomato, cucumber, and pepper hybrids lead greenhouse orders, while open-field brassicas and root crops gain from regional self-sufficiency programs. Sugar beet seed import quotas incentivize Russian breeders to accelerate hybridization, adding another vector for vegetable segment expansion. As disposable incomes rise, supermarkets broaden fresh produce assortments, reinforcing premium seed turnover across the Russia seed market.
Geography Analysis
The Central and Volga federal districts jointly accounted for roughly 44.62% of the Russia seed market in 2025, reflecting dense grain and oilseed cultivation, proximity to crushing capacity, and streamlined logistics. Robust extension networks and higher credit penetration foster aggressive hybrid uptake, particularly in corn and sunflower. These districts also host leading breeding institutes that benefit from cluster effects and direct subsidy channels.
Southern territories, notably Krasnodar and Stavropol, posted the strongest double-digit growth thanks to favorable agro-climatic conditions and early adoption of drought-tolerant wheat lines. Export-oriented farms in the region reinvest profits into certified seed and precision agriculture, setting benchmarks for national productivity. Protected cultivation hubs near Moscow and St. Petersburg supply metropolitan retailers, commanding premium margins despite limited acreage.
Siberia and the Far East lag in certified-seed penetration due to infrastructure constraints, fragmented farm structure, and lower farmgate prices. Nevertheless, state investment in rail corridors and port terminals is expected to unlock grain export capacity, bringing larger farms and agro-holdings that favor hybrids. The blockchain traceability mandate will gradually integrate remote regions, shrinking gray-market channels and expanding the addressable base within the Russia seed market.
Competitive Landscape
The market structure is fragmented, with Bayer AG, Syngenta Group, EkoNiva Group, BASF SE, and Groupe Limagrain collectively holding approximately 19% of the Russia seed market share in 2024. Russia’s seed sector moved from importer-dominated to balanced domestic-foreign competition after import quotas and ownership rules cut foreign players’ share in 2024. Domestic firms held the highest share. EkoNiva vertically integrates breeding, multiplication, and distribution over 274,000 hectares and reported RUB 91.1 billion (USD 1.01 billion) revenue in 2024, up year on year.
Multinationals such as Syngenta and Bayer localize processing plants and co-license lines to satisfy local-ownership clauses, preserving access to premium vegetable and corn segments. Technology competition centers on conventional molecular breeding and speed-breeding platforms because GMO routes remain off limits. Digital traceability gives first movers an edge as early compliance builds trust with retailers and lenders. Firms that invest in blockchain integration and real-time quality analytics differentiate in a market still plagued by counterfeit seed.
Segment white-space exists in greenhouse-specific hybrids, herbal and spice crops, and gene-edited materials regulations should clarify. Ongoing currency volatility favors companies with localized input bases and strong balance sheets that can hedge import exposure. Overall, the Russia seed market exhibits moderate concentration with ample room for niche specialists focusing on unmet climatic or protected-cultivation needs.
Russia Seed Industry Leaders
BASF SE
Bayer AG
Groupe Limagrain
Syngenta Group
EkoNiva Group
- *Disclaimer: Major Players sorted in no particular order

Recent Industry Developments
- January 2025: The EN Beluga lentil variety, developed by the Group’s Plant Breeding and Variety Maintenance Center, will be entered into the State Register of Plant Breeding Achievements in 2025. This is EkoNiva’s first lentil variety approved for use in Russia.
- September 2024: EkoNiva has reported its harvest campaign for cash crops spanned 274,000 hectares of the Group's farmland. This area, spanning 13 regions where the Group operates, was used for cash crops, including grasses for seed production.
- July 2023: Enza Zaden announced that its lettuce varieties have high resistance to three Bermian races: Bl: 38EU, Bl: 39EU, and Bl: 40EU. These varieties are designed to thrive in diverse soil types while maintaining high yield potential.


Russia Seed Market Report Scope
Hybrids, Open Pollinated Varieties & Hybrid Derivatives are covered as segments by Breeding Technology. Open Field, Protected Cultivation are covered as segments by Cultivation Mechanism. Row Crops, Vegetables are covered as segments by Crop Type.Breeding Technology
| Hybrids | Non-Transgenic Hybrids |
| Open Pollinated Varieties & Hybrid Derivatives |
Cultivation Mechanism
| Open Field |
| Protected Cultivation |
Crop Type
| Row Crops | Fiber Crops | Cotton |
| Other Fiber Crops | ||
| Forage Crops | Alfalfa | |
| Forage Corn | ||
| Forage Sorghum | ||
| Other Forage Crops | ||
| Grains & Cereals | Corn | |
| Rice | ||
| Sorghum | ||
| Wheat | ||
| Other Grains & Cereals | ||
| Oilseeds | Canola, Rapeseed & Mustard | |
| Soybean | ||
| Sunflower | ||
| Other Oilseeds | ||
| Pulses | ||
| Vegetables | Brassicas | Cabbage |
| Carrot | ||
| Cauliflower & Broccoli | ||
| Other Brassicas | ||
| Cucurbits | Cucumber & Gherkin | |
| Pumpkin & Squash | ||
| Other Cucurbits | ||
| Roots & Bulbs | Garlic | |
| Onion | ||
| Potato | ||
| Other Roots & Bulbs | ||
| Solanaceae | Chilli | |
| Eggplant | ||
| Tomato | ||
| Other Solanaceae | ||
| Unclassified Vegetables | Peas | |
| Spinach | ||
| Other Unclassified Vegetables | ||
| Breeding Technology | Hybrids | Non-Transgenic Hybrids | |
| Open Pollinated Varieties & Hybrid Derivatives | |||
| Cultivation Mechanism | Open Field | ||
| Protected Cultivation | |||
| Crop Type | Row Crops | Fiber Crops | Cotton |
| Other Fiber Crops | |||
| Forage Crops | Alfalfa | ||
| Forage Corn | |||
| Forage Sorghum | |||
| Other Forage Crops | |||
| Grains & Cereals | Corn | ||
| Rice | |||
| Sorghum | |||
| Wheat | |||
| Other Grains & Cereals | |||
| Oilseeds | Canola, Rapeseed & Mustard | ||
| Soybean | |||
| Sunflower | |||
| Other Oilseeds | |||
| Pulses | |||
| Vegetables | Brassicas | Cabbage | |
| Carrot | |||
| Cauliflower & Broccoli | |||
| Other Brassicas | |||
| Cucurbits | Cucumber & Gherkin | ||
| Pumpkin & Squash | |||
| Other Cucurbits | |||
| Roots & Bulbs | Garlic | ||
| Onion | |||
| Potato | |||
| Other Roots & Bulbs | |||
| Solanaceae | Chilli | ||
| Eggplant | |||
| Tomato | |||
| Other Solanaceae | |||
| Unclassified Vegetables | Peas | ||
| Spinach | |||
| Other Unclassified Vegetables | |||


Market Definition
- Commercial Seed - For the purpose of this study, only commercial seeds have been included as part of the scope. Farm-saved Seeds, which are not commercially labeled are excluded from scope, even though a minor percentage of farm-saved seeds are exchanged commercially among farmers. The scope also excludes vegetatively reproduced crops and plant parts, which may be commercially sold in the market.
- Crop Acreage - While calculating the acreage under different crops, the Gross Cropped Area has been considered. Also known as Area Harvested, according to the Food & Agricultural Organization (FAO), this includes the total area cultivated under a particular crop across seasons.
- Seed Replacement Rate - Seed Replacement Rate is the percentage of area sown out of the total area of crop planted in the season by using certified/quality seeds other than the farm-saved seed.
- Protected Cultivation - The report defines protected cultivation as the process of growing crops in a controlled environment. This includes greenhouses, glasshouses, hydroponics, aeroponics, or any other cultivation system that protects the crop against any abiotic stress. However, cultivation in an open field using plastic mulch is excluded from this definition and is included under open field.
| Keyword | Definition |
|---|---|
| Row Crops | These are usually the field crops which include the different crop categories like grains & cereals, oilseeds, fiber crops like cotton, pulses, and forage crops. |
| Solanaceae | These are the family of flowering plants which includes tomato, chili, eggplants, and other crops. |
| Cucurbits | It represents a gourd family consisting of about 965 species in around 95 genera. The major crops considered for this study include Cucumber & Gherkin, Pumpkin and squash, and other crops. |
| Brassicas | It is a genus of plants in the cabbage and mustard family. It includes crops such as carrots, cabbage, cauliflower & broccoli. |
| Roots & Bulbs | The roots and bulbs segment includes onion, garlic, potato, and other crops. |
| Unclassified Vegetables | This segment in the report includes the crops which don’t belong to any of the above-mentioned categories. These include crops such as okra, asparagus, lettuce, peas, spinach, and others. |
| Hybrid Seed | It is the first generation of the seed produced by controlling cross-pollination and by combining two or more varieties, or species. |
| Transgenic Seed | It is a seed that is genetically modified to contain certain desirable input and/or output traits. |
| Non-Transgenic Seed | The seed produced through cross-pollination without any genetic modification. |
| Open-Pollinated Varieties & Hybrid Derivatives | Open-pollinated varieties produce seeds true to type as they cross-pollinate only with other plants of the same variety. |
| Other Solanaceae | The crops considered under other Solanaceae include bell peppers and other different peppers based on the locality of the respective countries. |
| Other Brassicaceae | The crops considered under other brassicas include radishes, turnips, Brussels sprouts, and kale. |
| Other Roots & Bulbs | The crops considered under other roots & bulbs include Sweet Potatoes and cassava. |
| Other Cucurbits | The crops considered under other cucurbits include gourds (bottle gourd, bitter gourd, ridge gourd, Snake gourd, and others). |
| Other Grains & Cereals | The crops considered under other grains & cereals include Barley, Buck Wheat, Canary Seed, Triticale, Oats, Millets, and Rye. |
| Other Fibre Crops | The crops considered under other fibers include Hemp, Jute, Agave fibers, Flax, Kenaf, Ramie, Abaca, Sisal, and Kapok. |
| Other Oilseeds | The crops considered under other oilseeds include Ground nut, Hempseed, Mustard seed, Castor seeds, safflower seeds, Sesame seeds, and Linseeds. |
| Other Forage Crops | The crops considered under other forages include Napier grass, Oat grass, White clover, Ryegrass, and Timothy. Other forage crops were considered based on the locality of the respective countries. |
| Pulses | Pigeon peas, Lentils, Broad and horse beans, Vetches, Chickpeas, Cowpeas, Lupins, and Bambara beans are the crops considered under pulses. |
| Other Unclassified Vegetables | The crops considered under other unclassified vegetables include Artichokes, Cassava Leaves, Leeks, Chicory, and String beans. |


Research Methodology
Mordor Intelligence follows a four-step methodology in all our reports.
- Step-1: IDENTIFY KEY VARIABLES: In order to build a robust forecasting methodology, the variables and factors identified in Step-1 are tested against available historical market numbers. Through an iterative process, the variables required for market forecast are set and the model is built on the basis of these variables.
- Step-2: Build a Market Model: Market-size estimations for the forecast years are in nominal terms. Inflation is not a part of the pricing, and the average selling price (ASP) is kept constant throughout the forecast period.
- Step-3: Validate and Finalize: In this important step, all market numbers, variables and analyst calls are validated through an extensive network of primary research experts from the market studied. The respondents are selected across levels and functions to generate a holistic picture of the market studied.
- Step-4: Research Outputs: Syndicated Reports, Custom Consulting Assignments, Databases, and Subscription Platforms


