Rice Market Analysis by Mordor Intelligence
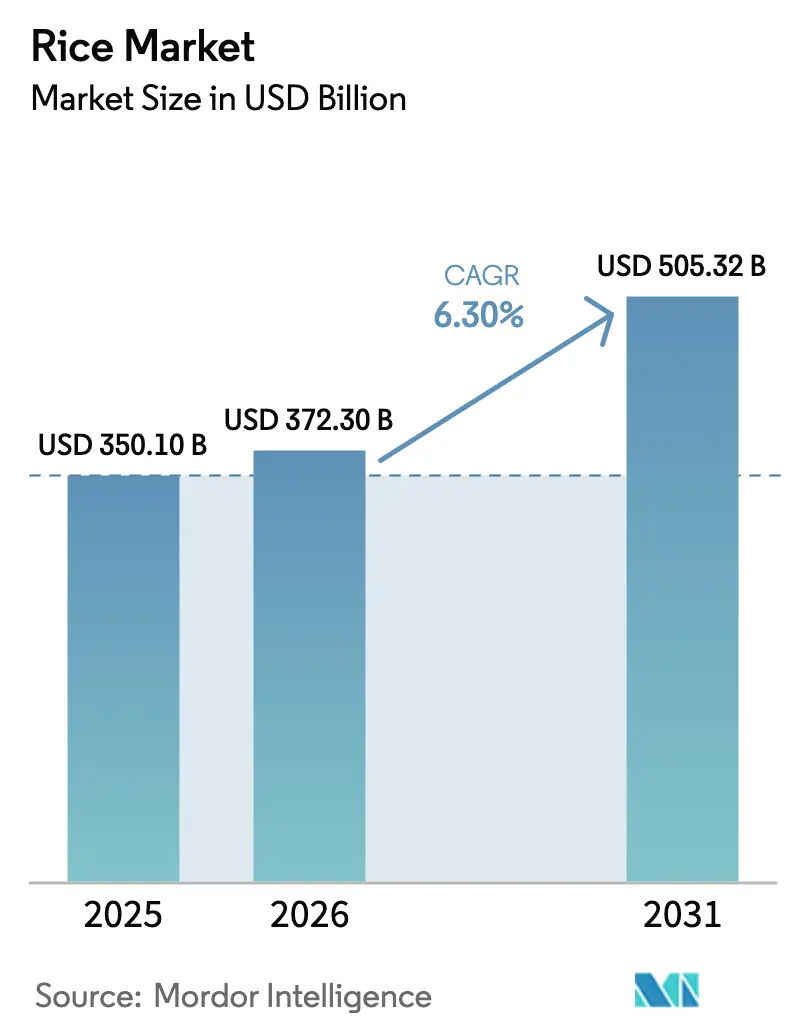
The rice market size was valued at USD 350.10 billion in 2025 and is estimated to grow from USD 372.30 billion in 2026 to USD 505.32 billion by 2031, registering a CAGR of 6.30% during the forecast period (2026–2031). The Asia–Pacific region maintains its leadership position through price-support policies, widespread adoption of hybrid seeds, and premiumization in urban centers. Africa is emerging as the fastest-growing demand hub as governments pursue import substitution while per-capita consumption rises. Carbon-credit monetization, blockchain-based traceability, and expanding industrial uses for broken rice collectively enhance revenue potential, even as water scarcity, labor shortages, and residue-limit compliance increase operating costs. Supply security remains fragile because export bans and climate shocks move prices sharply, motivating buyers to diversify sourcing and reward suppliers with resilient logistics and sustainability credentials.
Key Report Takeaways
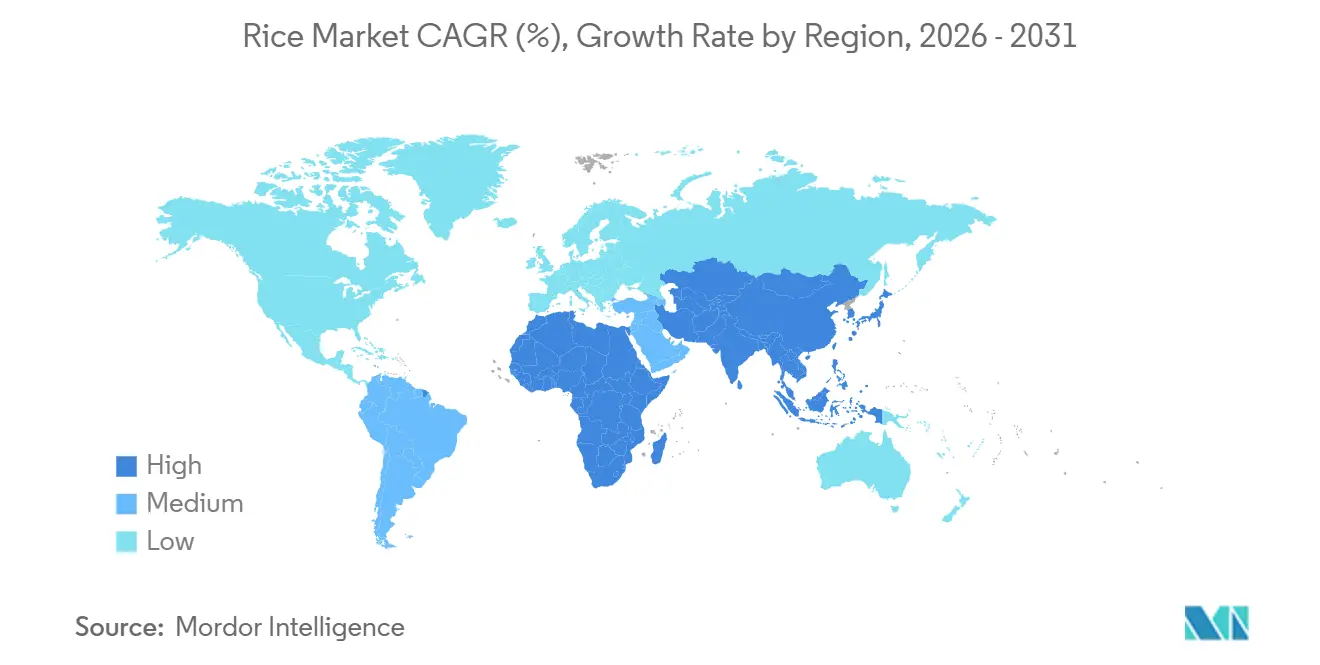
- By geography, the Asia–Pacific region led with 56.8% of the rice market share in 2025, while Africa is projected to grow at a 6.8% CAGR through 2031.
Note: Market size and forecast figures in this report are generated using Mordor Intelligence’s proprietary estimation framework, updated with the latest available data and insights as of January 2026.
Global Rice Market Trends and Insights
Drivers Impact Analysis*
| Driver | (~) % Impact on CAGR Forecast | Geographic Relevance | Impact Timeline |
|---|---|---|---|
| Rising demand among urban middle-income consumers | +0.9% | Asia–Pacific core, spillover to Middle East and Africa | Medium term (2–4 years) |
| Government price-support and input subsidy programs | +1.2% | India, Thailand, Vietnam, and Philippines | Long term (≥ 4 years) |
| Adoption of hybrid and high-yield varieties | +1.1% | Asia–Pacific, South America, emerging in Sub-Saharan Africa | Long term (≥ 4 years) |
| Expanding broken-rice use in animal feed and brewing | +0.6% | Asia–Pacific and North America | Medium term (2–4 years) |
| Monetization of paddy-field methane credits | +0.5% | Vietnam, Thailand, and Philippines | Long term (≥ 4 years) |
| Blockchain-based rice traceability boosting export premiums | +0.4% | Vietnam and Thailand export corridors | Medium term (2–4 years) |
| Source: Mordor Intelligence | |||
Rising Demand among Urban Middle-Income Consumers
Premium long-grain, basmati, and jasmine command 20%–40% margins over standard milled rice as rising urban incomes shift preferences toward perceived quality and aroma. Basmati sales in India’s metropolitan supermarkets climbed year-on-year in 2024, while Thailand’s jasmine shipments to North America and Europe expanded in 2025[1]Source: Rice Market Information, " USDA Foreign Agricultural Service," fas.usda.gov. E-commerce accelerates this trend by easing home delivery and subscription models that build brand loyalty. Gulf states add incremental volume by catering to large expatriate populations that favor aromatic varieties. Because income elasticity remains high, volume growth is projected to persist even as mature economies flatten per-capita consumption.
Government Price-Support and Input Subsidy Programs
Minimum Support Price (MSP) frameworks, pledging schemes, and irrigation subsidies collectively stabilize farmer cash flows and encourage continued acreage despite volatile open-market rates. India lifted the MSP for common-grade paddy to INR 2,300 per quintal (USD 27.60 per quintal) for the 2024–2025 season and procured 52 million metric tons for the public distribution system[2]Source: Food Grain Bulletin, "Ministry of Consumer Affairs, Food and Public Distribution, India," dfpd.gov.in. Thailand’s modified pledging scheme ensures THB 15,000 per metric ton (USD 430 per metric ton) for white rice. Vietnam earmarked VND 12 trillion (USD 490 million) for irrigation upgrades. Although these outlays strain public budgets, they reduce the likelihood of abrupt supply contractions, underpinning steady 6.30% CAGR growth.
Adoption of Hybrid and High-Yield Varieties
Hybrid rice delivers 15%–25% yield gains over inbred cultivars, allowing producers to offset land and water constraints. China planted 16.5 million hectares of hybrid rice in 2024, equal to 47% of its total rice acreage. India’s National Food Security Mission distributed 1.2 million metric tons of certified hybrid seed in 2024, and the Philippines approved 12 drought-tolerant hybrids in 2025. Seed royalty revenues are rising for multinational input suppliers, yet adoption is tempered where farmers traditionally replant saved seed.
Expanding Broken-Rice Use in Animal Feed and Brewing
Feed formulators substitute broken rice to curb feed costs without sacrificing metabolizable energy, raising demand from integrators in Thailand and Vietnam. Charoen Pokphand Foods grew broken-rice purchases 22% in 2025 to displace 8% of corn in its poultry rations and achieved a 4% feed-cost saving[3]Source: CP Group, "Charoen Pokphand Foods Annual Report 2025," cpgroupglobal.com. Craft brewers in North America and Europe experiment with broken rice to produce lighter-bodied lagers, while Brazilian ethanol plants incorporate it during the sugarcane off-season. In Asia and South America, bioethanol facilities utilize broken rice as a primary source of carbohydrates to meet renewable fuel requirements, thereby expanding industrial demand in the rice market.
Restraints Impact Analysis*
| Restraint | (~) % Impact on CAGR Forecast | Geographic Relevance | Impact Timeline |
|---|---|---|---|
| Chronic water scarcity in major producing basins | -0.8% | Mekong Delta, Indo-Gangetic Plain, and emerging in Middle East | Long term (≥ 4 years) |
| Rising agriculture labor costs and rural out-migration | -0.6% | Asia–Pacific and South America | Medium term (2–4 years) |
| Tightening pesticide-residue limits | -0.4% | European Union and Japan enforcement corridors | Medium term (2–4 years) |
| Export bans by key suppliers | -0.5% | Originating in India, Vietnam, and Myanmar | Short term (≤ 2 years) |
| Source: Mordor Intelligence | |||
Chronic Water Scarcity in Major Producing Basins
Groundwater depletion and saltwater intrusion directly threaten the stability of yields. Vietnam’s Mekong Delta lost 120,000 hectares during the 2024 dry season, trimming winter-spring yields by 0.4 metric ton per hectare. India’s Punjab and Haryana record groundwater tables falling by 0.5 meters annually, prompting restrictions on planting. Reservoir levels in Thailand’s Chao Phraya basin hit 35% capacity in March 2025. Alternate Wetting and Drying (AWD) saves 25%–30% irrigation water, yet adoption remains below one-fifth of planted area because farmers fear yield penalties and lack extension support.
Rising Agriculture Labor Costs and Rural Out-Migration
Wage inflation raises the cost base and accelerates mechanization. The daily transplanting wage in Indian rice states reached INR 400 (USD 4.80) in 2025, 8% higher than in 2024. Thailand experienced a 6% wage increase as the construction and manufacturing sectors compete for labor. Vietnam’s Mekong Delta encountered a 12% harvest-time labor shortfall in 2025. Custom-hiring centers for transplanters and combine harvesters reduce per-hectare costs, but up-front machinery investments of USD 50,000–USD 100,000 limit access to larger farms and cooperatives.
*Our forecasts treat driver/restraint impacts as directional, not additive. The impact forecasts reflect baseline growth, mix effects, and variable interactions.
Geography Analysis
The Asia–Pacific region captured 56.8% of the rice market share in 2025, with production volumes exceeding demand and strong domestic consumption. Rising yields from the adoption of hybrid seeds and state procurement frameworks anchor the region’s output stability. China’s hybrid penetration reached 47% of the planted area, while India’s Minimum Support Price sustained acreage. Southeast Asia remains the key export theater, with Vietnam and Thailand shipping more than 15 million metric tons combined. Climate stress, particularly drought and salinity in the Mekong Delta, places a ceiling on future acreage expansion. The adoption of alternate wetting and drying, as well as blockchain traceability, continues to attract premium buyers in Europe and North America.
Africa, projected to grow at a CAGR of 6.8% during 2026–2031, represents the fastest-growing region, driven by increased government investment in irrigation infrastructure and hybrid seeds to reduce import dependence. Nigeria and Ghana remain significant importers, but anchor-borrower programs and continental free-trade integration aim to boost local milling capacity. North America, Europe, South America, and the Middle East together account for the residual share, each region characterized by either limited local production or differentiated demand for basmati, jasmine, and fortified products. The rice market size for Asia–Pacific is projected to expand through 2031, underlining the region’s continued dominance, while Africa’s rice market size is on track for double-digit growth in absolute value by the end of the decade.
Demand clusters vary across regions. Per-capita consumption exceeds 100 kilograms in Bangladesh, Vietnam, and Myanmar. It hovers near 70 kilograms in Sub-Saharan Africa, and averages below 15 kilograms in Europe. Premium segments such as basmati and jasmine find traction in urban Asian and Middle Eastern cities where aromatic preference drives repeat purchase. Broken rice, traditionally a byproduct, gains new value in North America where craft brewers seek cost-efficient adjuncts. Europe’s stringent residue limits filter supply toward exporters with robust laboratory infrastructure, while Africa’s import growth invites investment in port capacity and regional value chains.


Competitive Landscape
The rice market is fragmented, with agribusinesses such as Olam Agri and Wilmar International overseeing end-to-end chains that span farm procurement, milling, ocean freight, and destination marketing. This integration allows them to spread fixed costs and meet the stringent traceability rules demanded by European and North American buyers. Olam’s 2024 merger with Louis Dreyfus Company created a USD 40 billion revenue platform that pools origination hubs across Nigeria, Vietnam, and Thailand, and is projected to yield USD 200 million in annual logistics and procurement savings.
Regional specialists dominate premium basmati and jasmine segments. LT Foods and KRBL together capture approximately 40% of global basmati exports by leveraging their strong retail brands, India Gate and Daawat, and investing in blockchain systems that certify age, aroma, and pesticide compliance, enabling price premiums of 20%–30% in the Middle East and Europe. Thai millers focus on jasmine varieties, and their exporters now bundle Sustainable Rice Platform certificates with blockchain data to maintain market access under the European Union Deforestation Regulation. Competitive intensity is rising as new entrants adopt precision farming and direct-seeding technologies that trim input costs while meeting residue limits.
White-space opportunities revolve around fortified kernels for public food programs, low-glycemic offerings for health-conscious shoppers, and by-product valorization in rice bran oil and protein concentrates. India’s nationwide fortification mandate lifted demand for 15 million metric tons of premix in 2025, opening a USD 300 million ingredient market. SunRice capitalized on the wellness trend with its low-glycemic line that commands a 5% retail premium in Australia and export destinations. Patent filings on drought-tolerant and saline-resistant germplasm climbed in 2024, led by the International Rice Research Institute and national research partners, while e-commerce platforms such as BigBasket in India and Lazada in Thailand reported 25% year-on-year rice sales growth by bypassing wholesale channels and capturing retail margins.
Recent Industry Developments
- September 2025: LT Foods Limited has completed the acquisition of Dainty Foods, a Canadian rice brand, for CAD 80 million (USD 59 million). The company plans to build a 250,000-square-foot facility in the United States. The Windsor operation will continue to serve the Canadian market, while the new facility in the United States will cater to the American market.
- June 2025: The International Rice Research Institute (IRRI) launched its 2025-2030 Strategy, which aims to transform global rice-based food systems through scientific research, partnerships, and coordinated actions between the public and private sectors.
- April 2025: The Kenya Agricultural and Livestock Research Organization (KALRO) collaborated with the Korea Program on International Agriculture (KOPIA) to develop the Africa Rice Cultivation Complex in Mwea, Kirinyaga County.


Research Methodology Framework and Report Scope
Market Definitions and Key Coverage
Our study defines the global rice market as the total annual value of paddy that is hulled, milled, and channeled into edible white, brown, or par-boiled rice for direct human consumption, captured from farm-gate through wholesale transactions and expressed in constant 2024 U.S. dollars. According to Mordor Intelligence, this universe was worth around USD 455.2 billion in 2025.
Scope exclusions, including rice-derived ingredients (protein, syrup), snack products, seed sales, and broken grain meant strictly for feed or industrial starch, sit outside the baseline.
Segmentation Overview
-
By Geography
-
North America
-
United States
- Production Analysis (Area Harvested, Yield, and Production Volume)
- Consumption Analysis (Consumption Value and Volume)
- Import Market Analysis (Import Value, Volume, and Key Supplying Markets)
- Export Market Analysis (Export Value, Volume, and Key Destination Markets)
- Wholesale Price Trend Analysis and Forecast
- Regulatory Framework
- List of Key Players
- Logistics and Infrastructure
- Seasonality Analysis
-
Canada
- Production Analysis (Area Harvested, Yield, and Production Volume)
- Consumption Analysis (Consumption Value and Volume)
- Import Market Analysis (Import Value, Volume, and Key Supplying Markets)
- Export Market Analysis (Export Value, Volume, and Key Destination Markets)
- Wholesale Price Trend Analysis and Forecast
- Regulatory Framework
- List of Key Players
- Logistics and Infrastructure
- Seasonality Analysis
-
Mexico
- Production Analysis (Area Harvested, Yield, and Production Volume)
- Consumption Analysis (Consumption Value and Volume)
- Import Market Analysis (Import Value, Volume, and Key Supplying Markets)
- Export Market Analysis (Export Value, Volume, and Key Destination Markets)
- Wholesale Price Trend Analysis and Forecast
- Regulatory Framework
- List of Key Players
- Logistics and Infrastructure
- Seasonality Analysis
-
United States
-
Europe
-
Russia
- Production Analysis (Area Harvested, Yield, and Production Volume)
- Consumption Analysis (Consumption Value and Volume)
- Import Market Analysis (Import Value, Volume, and Key Supplying Markets)
- Export Market Analysis (Export Value, Volume, and Key Destination Markets)
- Wholesale Price Trend Analysis and Forecast
- Regulatory Framework
- List of Key Players
- Logistics and Infrastructure
- Seasonality Analysis
-
Germany
- Production Analysis (Area Harvested, Yield, and Production Volume)
- Consumption Analysis (Consumption Value and Volume)
- Import Market Analysis (Import Value, Volume, and Key Supplying Markets)
- Export Market Analysis (Export Value, Volume, and Key Destination Markets)
- Wholesale Price Trend Analysis and Forecast
- Regulatory Framework
- List of Key Players
- Logistics and Infrastructure
- Seasonality Analysis
-
Italy
- Production Analysis (Area Harvested, Yield, and Production Volume)
- Consumption Analysis (Consumption Value and Volume)
- Import Market Analysis (Import Value, Volume, and Key Supplying Markets)
- Export Market Analysis (Export Value, Volume, and Key Destination Markets)
- Wholesale Price Trend Analysis and Forecast
- Regulatory Framework
- List of Key Players
- Logistics and Infrastructure
- Seasonality Analysis
-
Spain
- Production Analysis (Area Harvested, Yield, and Production Volume)
- Consumption Analysis (Consumption Value and Volume)
- Import Market Analysis (Import Value, Volume, and Key Supplying Markets)
- Export Market Analysis (Export Value, Volume, and Key Destination Markets)
- Wholesale Price Trend Analysis and Forecast
- Regulatory Framework
- List of Key Players
- Logistics and Infrastructure
- Seasonality Analysis
-
France
- Production Analysis (Area Harvested, Yield, and Production Volume)
- Consumption Analysis (Consumption Value and Volume)
- Import Market Analysis (Import Value, Volume, and Key Supplying Markets)
- Export Market Analysis (Export Value, Volume, and Key Destination Markets)
- Wholesale Price Trend Analysis and Forecast
- Regulatory Framework
- List of Key Players
- Logistics and Infrastructure
- Seasonality Analysis
-
Russia
-
Asia-Pacific
-
China
- Production Analysis (Area Harvested, Yield, and Production Volume)
- Consumption Analysis (Consumption Value and Volume)
- Import Market Analysis (Import Value, Volume, and Key Supplying Markets)
- Export Market Analysis (Export Value, Volume, and Key Destination Markets)
- Wholesale Price Trend Analysis and Forecast
- Regulatory Framework
- List of Key Players
- Logistics and Infrastructure
- Seasonality Analysis
-
India
- Production Analysis (Area Harvested, Yield, and Production Volume)
- Consumption Analysis (Consumption Value and Volume)
- Import Market Analysis (Import Value, Volume, and Key Supplying Markets)
- Export Market Analysis (Export Value, Volume, and Key Destination Markets)
- Wholesale Price Trend Analysis and Forecast
- Regulatory Framework
- List of Key Players
- Logistics and Infrastructure
- Seasonality Analysis
-
Bangladesh
- Production Analysis (Area Harvested, Yield, and Production Volume)
- Consumption Analysis (Consumption Value and Volume)
- Import Market Analysis (Import Value, Volume, and Key Supplying Markets)
- Export Market Analysis (Export Value, Volume, and Key Destination Markets)
- Wholesale Price Trend Analysis and Forecast
- Regulatory Framework
- List of Key Players
- Logistics and Infrastructure
- Seasonality Analysis
-
Indonesia
- Production Analysis (Area Harvested, Yield, and Production Volume)
- Consumption Analysis (Consumption Value and Volume)
- Import Market Analysis (Import Value, Volume, and Key Supplying Markets)
- Export Market Analysis (Export Value, Volume, and Key Destination Markets)
- Wholesale Price Trend Analysis and Forecast
- Regulatory Framework
- List of Key Players
- Logistics and Infrastructure
- Seasonality Analysis
-
Vietnam
- Production Analysis (Area Harvested, Yield, and Production Volume)
- Consumption Analysis (Consumption Value and Volume)
- Import Market Analysis (Import Value, Volume, and Key Supplying Markets)
- Export Market Analysis (Export Value, Volume, and Key Destination Markets)
- Wholesale Price Trend Analysis and Forecast
- Regulatory Framework
- List of Key Players
- Logistics and Infrastructure
- Seasonality Analysis
-
Philippines
- Production Analysis (Area Harvested, Yield, and Production Volume)
- Consumption Analysis (Consumption Value and Volume)
- Import Market Analysis (Import Value, Volume, and Key Supplying Markets)
- Export Market Analysis (Export Value, Volume, and Key Destination Markets)
- Wholesale Price Trend Analysis and Forecast
- Regulatory Framework
- List of Key Players
- Logistics and Infrastructure
- Seasonality Analysis
-
Cambodia
- Production Analysis (Area Harvested, Yield, and Production Volume)
- Consumption Analysis (Consumption Value and Volume)
- Import Market Analysis (Import Value, Volume, and Key Supplying Markets)
- Export Market Analysis (Export Value, Volume, and Key Destination Markets)
- Wholesale Price Trend Analysis and Forecast
- Regulatory Framework
- List of Key Players
- Logistics and Infrastructure
- Seasonality Analysis
-
Myanmar
- Production Analysis (Area Harvested, Yield, and Production Volume)
- Consumption Analysis (Consumption Value and Volume)
- Import Market Analysis (Import Value, Volume, and Key Supplying Markets)
- Export Market Analysis (Export Value, Volume, and Key Destination Markets)
- Wholesale Price Trend Analysis and Forecast
- Regulatory Framework
- List of Key Players
- Logistics and Infrastructure
- Seasonality Analysis
-
China
-
South America
-
Brazil
- Production Analysis (Area Harvested, Yield, and Production Volume)
- Consumption Analysis (Consumption Value and Volume)
- Import Market Analysis (Import Value, Volume, and Key Supplying Markets)
- Export Market Analysis (Export Value, Volume, and Key Destination Markets)
- Wholesale Price Trend Analysis and Forecast
- Regulatory Framework
- List of Key Players
- Logistics and Infrastructure
- Seasonality Analysis
-
Argentina
- Production Analysis (Area Harvested, Yield, and Production Volume)
- Consumption Analysis (Consumption Value and Volume)
- Import Market Analysis (Import Value, Volume, and Key Supplying Markets)
- Export Market Analysis (Export Value, Volume, and Key Destination Markets)
- Wholesale Price Trend Analysis and Forecast
- Regulatory Framework
- List of Key Players
- Logistics and Infrastructure
- Seasonality Analysis
-
Peru
- Production Analysis (Area Harvested, Yield, and Production Volume)
- Consumption Analysis (Consumption Value and Volume)
- Import Market Analysis (Import Value, Volume, and Key Supplying Markets)
- Export Market Analysis (Export Value, Volume, and Key Destination Markets)
- Wholesale Price Trend Analysis and Forecast
- Regulatory Framework
- List of Key Players
- Logistics and Infrastructure
- Seasonality Analysis
-
Colombia
- Production Analysis (Area Harvested, Yield, and Production Volume)
- Consumption Analysis (Consumption Value and Volume)
- Import Market Analysis (Import Value, Volume, and Key Supplying Markets)
- Export Market Analysis (Export Value, Volume, and Key Destination Markets)
- Wholesale Price Trend Analysis and Forecast
- Regulatory Framework
- List of Key Players
- Logistics and Infrastructure
- Seasonality Analysis
-
Brazil
-
Middle East
-
Iran
- Production Analysis (Area Harvested, Yield, and Production Volume)
- Consumption Analysis (Consumption Value and Volume)
- Import Market Analysis (Import Value, Volume, and Key Supplying Markets)
- Export Market Analysis (Export Value, Volume, and Key Destination Markets)
- Wholesale Price Trend Analysis and Forecast
- Regulatory Framework
- List of Key Players
- Logistics and Infrastructure
- Seasonality Analysis
-
United Arab Emirates
- Production Analysis (Area Harvested, Yield, and Production Volume)
- Consumption Analysis (Consumption Value and Volume)
- Import Market Analysis (Import Value, Volume, and Key Supplying Markets)
- Export Market Analysis (Export Value, Volume, and Key Destination Markets)
- Wholesale Price Trend Analysis and Forecast
- Regulatory Framework
- List of Key Players
- Logistics and Infrastructure
- Seasonality Analysis
-
Iran
-
Africa
-
Nigeria
- Production Analysis (Area Harvested, Yield, and Production Volume)
- Consumption Analysis (Consumption Value and Volume)
- Import Market Analysis (Import Value, Volume, and Key Supplying Markets)
- Export Market Analysis (Export Value, Volume, and Key Destination Markets)
- Wholesale Price Trend Analysis and Forecast
- Regulatory Framework
- List of Key Players
- Logistics and Infrastructure
- Seasonality Analysis
-
Kenya
- Production Analysis (Area Harvested, Yield, and Production Volume)
- Consumption Analysis (Consumption Value and Volume)
- Import Market Analysis (Import Value, Volume, and Key Supplying Markets)
- Export Market Analysis (Export Value, Volume, and Key Destination Markets)
- Wholesale Price Trend Analysis and Forecast
- Regulatory Framework
- List of Key Players
- Logistics and Infrastructure
- Seasonality Analysis
-
South Africa
- Production Analysis (Area Harvested, Yield, and Production Volume)
- Consumption Analysis (Consumption Value and Volume)
- Import Market Analysis (Import Value, Volume, and Key Supplying Markets)
- Export Market Analysis (Export Value, Volume, and Key Destination Markets)
- Wholesale Price Trend Analysis and Forecast
- Regulatory Framework
- List of Key Players
- Logistics and Infrastructure
- Seasonality Analysis
-
Nigeria
-
North America
Detailed Research Methodology and Data Validation
Primary Research
We conduct structured calls with millers, exporters, extension agents, and wholesale importers across Asia, Africa, the Americas, and Europe. Their feedback validates milling recovery ratios, landed cost mark-ups, and retail penetration of premium grains, closing data gaps before the model locks.
Desk Research
We begin with tier-1 public datasets from FAO FAOSTAT, USDA-ERS, the International Grains Council, UN-Comtrade, and national statistics portals in China, India, Thailand, and Brazil, which map production, trade, and stock flows. Policy notes from the International Rice Research Institute, World Bank commodity price series, and government procurement tenders clarify subsidy effects and price corridors. Company 10-Ks, listed millers' presentations, and Dow Jones Factiva news scans enrich margin insights, while paid assets such as D&B Hoovers (miller revenues) and Volza (shipment micro-data) tight-check volumes. This list is illustrative; numerous additional sources supported data gathering and validation.
Market-Sizing & Forecasting
A top-down reconstruction converts harvested paddy, net of field and milling losses, into an edible rice pool; region-specific average realization prices translate tonnage into value. Supplier roll-ups and sampled ex-mill ASP × volume checks give a bottom-up counter-view that we iterate until both paths converge. Key drivers, such as irrigated acreage, yield progression, minimum-support prices, per-capita caloric shifts, and export-ban frequency, feed a multivariate regression that projects demand through 2030. Where official figures are missing, midpoint estimates from contiguous series are tempered with expert opinion.
Data Validation & Update Cycle
Outputs undergo price-volume sanity checks, variance flags, and two-stage analyst reviews. Reports refresh annually, with mid-cycle updates if policy or climate shocks move supply or demand by more than five percent, ensuring clients always receive the latest vetted view.
Why Our Global Rice Baseline Commands Reliability
Published estimates often differ because firms choose distinct product mixes, pricing ladders, and refresh cadences.
Key gap drivers include whether informal cross-border flows are counted, the point at which prices are captured (farm-gate vs. retail), and the timing of currency conversion.
Benchmark comparison
| Market Size | Anonymized source | Primary gap driver |
|---|---|---|
| USD 455.2 B (2025) | Mordor Intelligence | |
| USD 339.8 B (2025) | Global Consultancy A | Excludes informal trade and values only packaged retail rice |
| USD 315.6 B (2025) | Trade Journal B | Uses average 2023 FX rates and omits par-boiled segment |
The comparison shows that Mordor's disciplined scope selection, dual-path modelling, and annual refresh cadence deliver a balanced, transparent baseline that decision-makers can replicate and trust.


Key Questions Answered in the Report
What is the projected size of the rice market by 2031?
The rice market is estimated at USD 372.30 billion in 2026 and is forecast to reach USD 505.32 billion by 2031, growing at a CAGR of 6.3% during the forecast period 2026–2031.
Which region dominates global demand?
Asia-Pacific commanded 56.8% of 2025 demand due to large production bases in China, India, and Southeast Asia.
Why is Africa considered a high-growth region?
Rising per-capita consumption and government-backed import-substitution programs are pushing Africa toward a 6.8% CAGR through 2031.
What role do sustainability initiatives play?
Alternate wetting and drying irrigation allows farmers to earn methane-reduction credits that add new revenue while satisfying corporate emission goals.
Page last updated on:


