
Rice Bran Oil Market Size and Share
Market Overview
| Study Period | 2021 - 2031 |
|---|---|
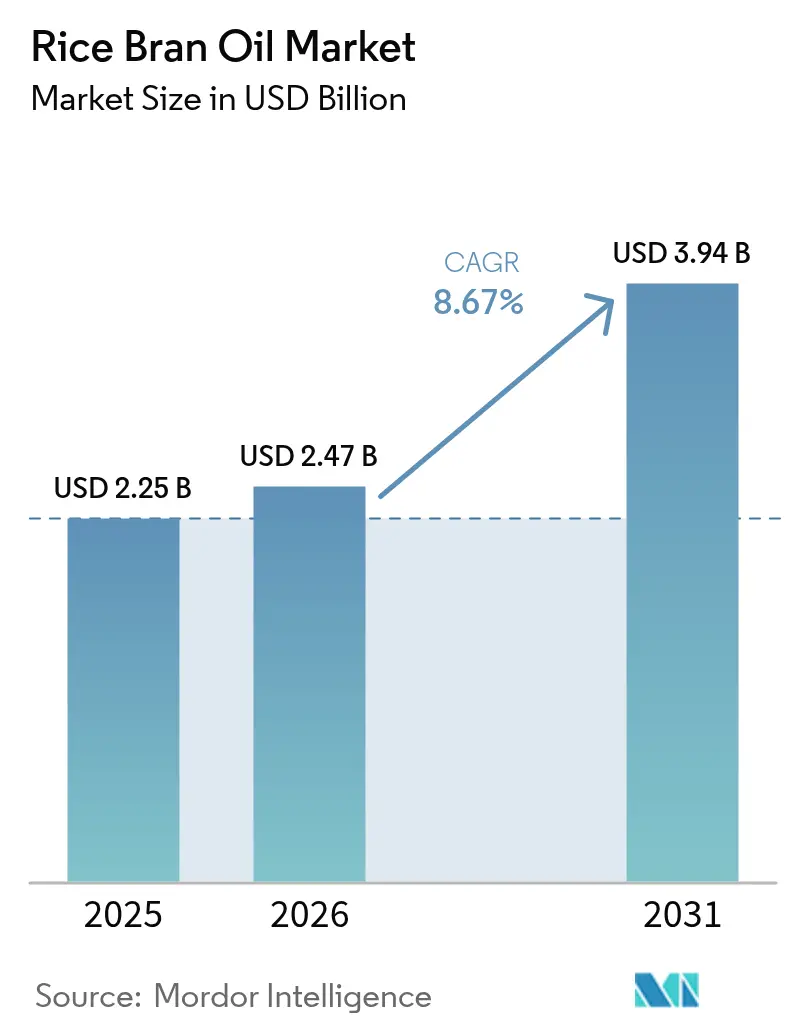
| Market Size (2026) | USD 2.47 Billion |
| Market Size (2031) | USD 3.94 Billion |
| Growth Rate (2026 - 2031) | 8.67 % |
| Fastest Growing Market | Asia Pacific |
| Largest Market | Asia Pacific |
| Market Concentration | High |
Major Players *Disclaimer: Major Players sorted in no particular order Image © Mordor Intelligence. Reuse requires attribution under CC BY 4.0. | |
Rice Bran Oil Market Analysis by Mordor Intelligence
The rice bran oil market size is projected to expand from USD 2.25 billion in 2025 and USD 2.47 billion in 2026 to USD 3.94 billion by 2031, registering a 8.67% CAGR between 2026 and 2031. Structural changes in edible-oil consumption continue to intensify as regulators tighten limits on trans fats and saturated fats, while consumers search for oils that deliver functional health benefits beyond basic nutrition. The World Health Organization’s 2024 reaffirmation that saturated fat intake remains below 10% of total energy and trans fats below 1% has pushed food manufacturers toward reformulation strategies that favor oils with balanced fatty-acid profiles and bioactive compounds such as γ-oryzanol, tocotrienols, and phytosterols. In parallel, retail promotion of “better-for-you” oils is broadening global household awareness, aided by the U.S. Food and Drug Administration’s new “healthy” nutrient-content claim that explicitly recognizes oils with favorable unsaturated-to-saturated ratios. Policy efforts in India via the National Mission on Edible Oils-Oil Seeds (NMEO-OS) and in Japan through the Green Food System Strategy have strengthened domestic supply ecosystems by incentivizing rice-bran extraction capacity and organic-rice acreage. Meanwhile, supercritical CO₂ and membrane-filtration technologies promise to raise bioactive retention and lower refining losses, reinforcing premium positioning across the rice bran oil market.
Key Report Takeaways
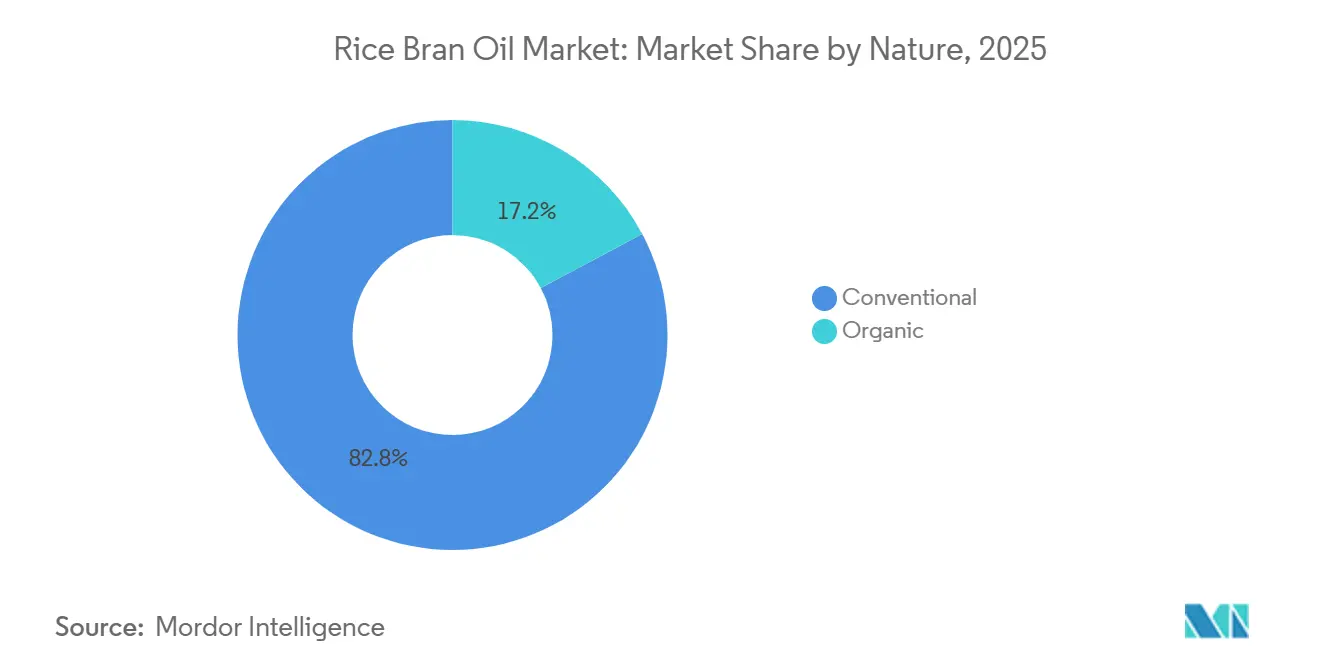
- By nature, conventional rice bran oil led with 82.78% of rice bran oil market share in 2025, whereas the organic segment is advancing at a 10.75% CAGR through 2031.
- By type, refined products commanded 85.37% of the rice bran oil market in 2025; non-refined variants are projected to accelerate at a 10.41% CAGR during 2026-2031.
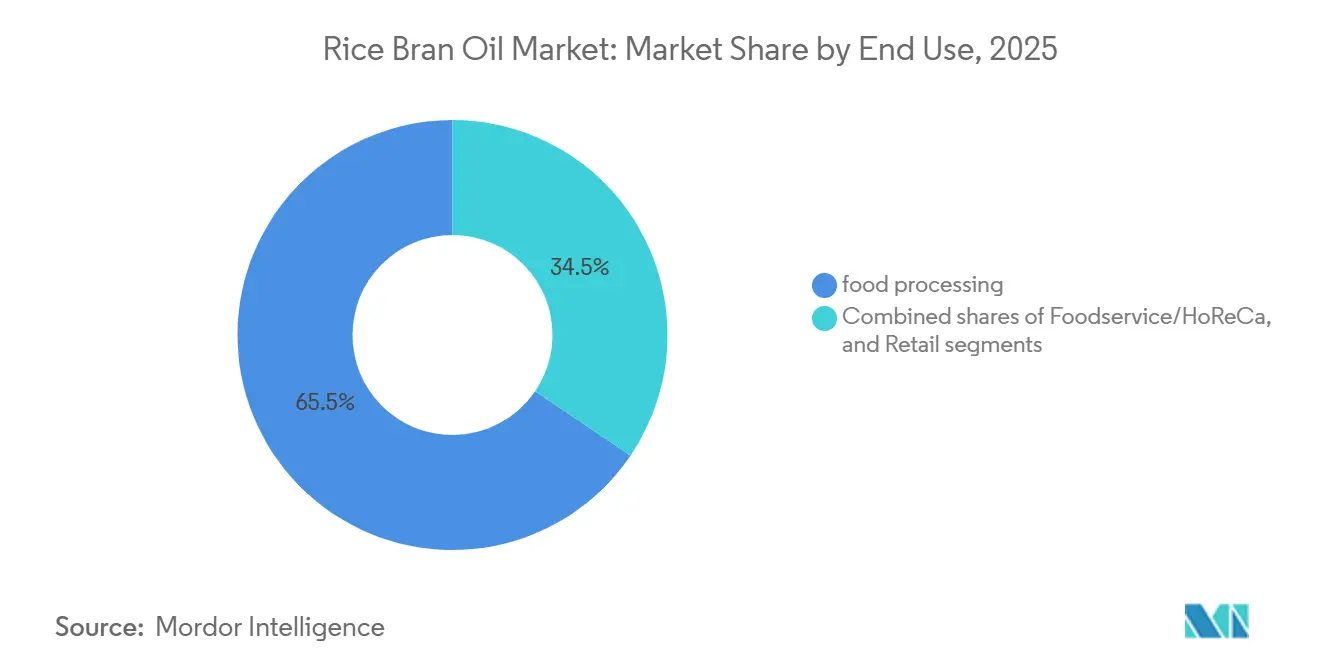
- By end use, food processing accounted for 65.45% of the rice bran oil market size in 2025, while retail sales are forecast to grow at a 10.58% CAGR to 2031.
- By geography, Asia-Pacific secured 36.72% of the rice bran oil market revenue in 2025, and the region is expected to expand at a 10.68% CAGR over 2026-2031
Note: Market size and forecast figures in this report are generated using Mordor Intelligence’s proprietary estimation framework, updated with the latest available data and insights as of 2026.
Global Rice Bran Oil Market Trends and Insights
Drivers Impact Analysis*
| Driver | (~) % Impact on CAGR Forecast | Geographic Relevance | Impact Timeline |
|---|---|---|---|
| Increasing Preference for Low Trans-Fat and Cholesterol Oils in Diets | +1.8% | Global, with strongest adoption in North America and Europe | Medium term (2-4 years) |
| Rising Demand for Natural, Clean-Label, and Organic Products | +1.5% | Asia-Pacific core, spill-over to North America and Europe | Long term (≥ 4 years) |
| Growing Use of Rice Bran Oil for High-Temperature Cooking Applications | +1.2% | Global, particularly Asia-Pacific and North America | Short term (≤ 2 years) |
| Shift Toward Plant-Based and Vegan Diets Boosting Edible Oil Demand | +1.0% | North America and Europe, expanding to Asia-Pacific urban centers | Medium term (2-4 years) |
| Expanding Presence in Global Retail Stores and Supermarkets Enhancing Market Penetration | +0.9% | Global | Short term (≤ 2 years) |
| Application in Processed Foods Promoting Healthier Oil Inclusion | +0.8% | Global, led by North America and Europe | Medium term (2-4 years) |
| Source: Mordor Intelligence | |||
Increasing Preference for Low Trans-Fat and Cholesterol Oils in Diets
Regulatory mandates targeting the elimination of industrially produced trans fats are reshaping ingredient procurement in the packaged food sector. The WHO's 2024 progress report on the REPLACE action framework highlighted that 58 countries, home to 3.7 billion people, have adopted best practice policies for trans fat elimination[1]. This shift is pushing manufacturers to replace partially hydrogenated oils with alternatives that ensure frying stability and an extended shelf life. Rice bran oil, with its unique composition of approximately 47% oleic acid, 33% linoleic acid, and 20% saturated fats, boasts a favorable unsaturated to saturated ratio. This characteristic allows it to sidestep hydrogenation, thus preventing trans fat formation during processing. Clinical trials from 2024 revealed that switching from conventional cooking oils to rice bran oil led to a 7.2% average reduction in LDL cholesterol over 12 weeks for participants with mild hyperlipidemia. This reduction is credited to the combined effects of gamma oryzanol and plant sterols. Such findings hold significant weight in the Asia Pacific region, where cardiovascular diseases are responsible for 35% of total mortalities. In response, governments are promoting healthier oil choices through public awareness initiatives and offering subsidies to boost domestic rice bran oil production.
Rising Demand for Natural, Clean-Label, and Organic Products
As concerns about pesticide residues and chemical refining agents grow, consumers are increasingly willing to pay a premium for certified organic edible oils. In 2024, the U.S. Department of Agriculture reported organic food sales hitting USD 67.6 billion, with oils and fats emerging as one of the fastest-growing subcategories, boasting a 14.3% year over year growth[2]. Achieving certification under the USDA National Organic Program or EU Regulation 2018/848 mandates traceability from paddy cultivation to solvent extraction. This compliance burden tends to favor vertically integrated producers with direct contracts with farmers, as noted by the USDA National Organic Program. In 2025, Japan's Ministry of Agriculture, Forestry and Fisheries (MAFF) highlighted an 18% year over year expansion in domestic organic rice acreage. This growth, fueled by subsidies from the Green Food System Strategy, aligns with the strategy's ambitious goal of reaching 25% organic farmland by 2050. Such an upstream expansion is poised to boost the availability of organic rice bran feedstock. This, in turn, could reduce input costs for oil processors and pave the way for wider retail distribution, extending beyond just specialty health stores.
Growing Use of Rice Bran Oil as a Cooking Oil in High-Temperature Applications
With a smoke point of around 232°C, rice bran oil stands out as a superior choice over canola and sunflower oils for deep frying and stir frying. These cooking methods prioritize thermal stability, which directly influences flavor quality and the formation of acrylamide. A 2024 study by the Institute of Food Technologists revealed that after 8 hours of frying at 180°C, rice bran oil produced 42% fewer polar compounds than soybean oil. This translates to a longer fry life and less frequent oil replacements, a significant advantage for commercial kitchens. Such benefits are especially prized in the Asia Pacific foodservice sector, where techniques like wok cooking and tempura demand oils that retain viscosity and resist polymerization through repeated heating. In 2025, India's Hotel and Restaurant Association noted that 34% of surveyed establishments transitioned to rice bran oil or blends with a minimum of 50% rice bran content. They cited cost savings from reduced oil turnover and a nod to consumer health preferences. Additionally, rice bran oil's neutral flavor makes it ideal for baked goods and confectionery, avoiding the grassy notes of extra virgin olive oil and the potential fishy undertones of high PUFA oils during storage.
Shift Toward Plant-Based and Vegan Diets Boosting Edible Oil Demand
As plant-based meat and dairy alternatives gain traction, the demand for oils that replicate mouthfeel and emulsification without animal derivatives has surged. Rice bran oil, with its phospholipid rich emulsifying properties, enables formulators to craft stable oil in water emulsions. This innovation sidesteps the need for egg lecithin or dairy proteins, catering to both vegan certifications and allergen free labels, as noted in Food Hydrocolloids. Cargill's 2024 investor presentation underscored the trend: its plant based solutions division ramped up rice bran oil procurement by 23% year over year. This move bolstered reformulation projects for clients in North America and Europe, who are pivoting from palm oil due to deforestation concerns. Furthermore, rice bran oil's lower saturated fat content aids plant based brands in achieving nutrient thresholds for front of pack labels. Systems like France's Nutri-Score and Australia's Health Star Rating penalize high saturated fat content, making this attribute particularly valuable.
Restraints Impact Analysis*
| Restraints | (~) % Impact on CAGR Forecasts | Geographic Relevance | Impact Timeline |
|---|---|---|---|
| Distribution and storage challenges impacting product quality | -0.8% | Global, acute in tropical and subtropical zones | Short term (≤ 2 years) |
| Complex compliance requirements hindering trade | -0.6% | Global, particularly cross-border shipments | Long term (≥ 4 years) |
| Need for specialized packaging to maintain quality | -0.5% | Global | Medium term (2-4 years) |
| Environmental concerns affecting rice cultivation | -0.7% | APAC core, spill-over to export markets | Long term (≥ 4 years) |
| Source: Mordor Intelligence | |||
Distribution and Storage Challenges Impacting Product Quality
Rice bran oil faces oxidative degradation during storage and transport, leading to inflated delivery costs and restricted market access, especially in regions lacking a robust cold chain infrastructure. A 2024 study in Food Chemistry highlighted that γ-oryzanol content in rice bran oil dropped by 28 to 34% after six months at ambient temperatures (25 to 30°C) in standard PET bottles. In contrast, only an 8 to 12% decline was observed when stored at 4°C in nitrogen flushed containers. This heightened sensitivity is attributed to the oil's unsaponifiable components, like tocotrienols and phytosterols, which readily auto oxidize when exposed to light and oxygen. Distributors in sub-Saharan Africa, Southeast Asia, and Latin America grapple with increased spoilage rates due to extended transit times and a lack of refrigerated storage. Industry estimates indicate that 5 to 8% of shipments arrive below quality standards. Such discrepancies lead to product recalls and customer grievances, diminishing brand value and deterring repeat purchases. This is especially pronounced in premium segments, where consumers demand consistent quality. While Codex Alimentarius Standard 210 1999 sets a maximum peroxide value of 10 milliequivalents per kilogram for vegetable oils, enforcement is inconsistent across regions, complicating cross border trade.
Complex Compliance Requirements Hindering Trade
International trade in edible oils faces a maze of phytosanitary regulations, labeling requirements, and tariff classifications. These complexities often weigh heavily on smaller exporters. For instance, the European Union mandates, under Regulation (EU) 2018/848, that third country operators in organic production secure equivalency recognition or certification from EU-approved entities. This process can stretch from 12 to 18 months and set operators back by USD 15,000 to 30,000 per facility. Meanwhile, in 2024, India's Food Safety and Standards Authority (FSSAI) tightened its edible oil standards[3]. They imposed stricter limits on erucic acid, aflatoxins, and heavy metals. These changes mean additional testing protocols, extending lead times by 7 to 10 days. Tariff structures add another layer of complexity. In 2024, India hiked import duties: crude edible oils jumped from 5.5% to 16.5%, and refined oils surged from 13.75% to 35.75%. This move aimed to shield domestic oilseed processors but effectively sidelined foreign rice bran oil suppliers from India's vast market. Such regulatory challenges tend to favor large, vertically integrated multinationals. With their in-house compliance teams and established customs relationships, they deepen market concentration, making it tougher for regional producers to expand their export footprint.
*Our forecasts treat driver/restraint impacts as directional, not additive. The impact forecasts reflect baseline growth, mix effects, and variable interactions.
Segment Analysis
By Nature: Organic Variants Gain Traction Despite Premiums
Conventional rice bran oil captured 82.78% of market revenue in 2025, reflecting its cost competitiveness in price-sensitive emerging markets where per-capita edible oil consumption remains below global averages. However, organic rice bran oil is expanding at 10.75% annually through 2031. Rising U.S. organic oilseed acreage alongside Japan’s subsidy-driven organic-rice expansion should temper raw-material premiums, widening consumer reach for certified SKUs. Conventional oils dominate industrial snack and HORECA channels, where price per liter governs procurement decisions. However, natural-food retailers and direct-to-consumer platforms foreground provenance and traceability, sustaining double-digit organic momentum in North America and Western Europe.
Conventional products remain indispensable in emerging-market foodservice because of their competitive price structure and extended fry life. Large processors blend refinery efficiencies with localized sourcing, enabling a stable supply at scale. Yet clean-label shoppers in urban India, Germany, Japan, and the United States reward organic producers with higher shelf turns and repeat-purchase rates. Sustained retail education and downstream certification audits will help the organic tier capture incremental rice bran oil market share through 2031.
By Type: Refined Oils Dominate, Yet Non-Refined Gains Among Wellness Consumers
In 2025, refined rice bran oil dominated the market, securing an 85.37% share, thanks to its adaptability in high-temperature cooking, food processing, and cosmetic uses. The refining stages, including degumming, neutralization, bleaching, and deodorization, strip away free fatty acids, phospholipids, and pigments. The result is a pale yellow oil with a neutral taste and a longer shelf life, aligning with industrial buyer specifications. Yet, this refining process cuts down the γ-oryzanol content by 15 to 25 percent, which not only lessens the oil's bioactive benefits but also curtails its allure for health-focused consumers in search of functional ingredients. On the other hand, non-refined rice bran oil, which is merely filtered and lightly processed, boasts elevated levels of oryzanol, tocotrienols, and phytosterols. This advantage positions it as a sought-after premium choice in the wellness market. With a robust annual growth rate of 10.41% projected through 2031, this variant's rise is fueled by specialty retailers and direct-to-consumer brands championing minimal processing and nutrient richness.
Despite its advantages, non-refined rice bran oil grapples with distribution hurdles. Its shelf life, spanning just 6 to 9 months, pales in comparison to the 12 to 18 months of its refined counterpart. Additionally, its darker hue can lend a subtly nutty flavor, which some consumers might find unsuitable for baking. Such sensory characteristics restrict its application in food processing, where a neutral flavor is paramount for batch consistency. In contrast, refined rice bran oil melds effortlessly into products like crackers, granola bars, and salad dressings, serving as a direct substitute for partially hydrogenated soybean oil without any taste or texture alterations. A 2024 FDA revision allows both refined and non-refined rice bran oils to be labeled as "healthy," contingent on meeting specific unsaturated fat content thresholds, thus equalizing the regulatory landscape. In response, processors are debuting "cold pressed" and "expeller pressed" variants, striking a balance between fully refined and non-refined oils. These new offerings promise better bioactive retention while ensuring sensory qualities appeal to the broader consumer base.
By End Use: Food Processing Leads, Retail Channels Accelerate
In 2025, food processing accounted for 65.45% of end-use demand, underscoring the oil's advantages in producing snacks, baked goods, and ready-to-eat meals. With a high smoke point of 232°C, the oil maintains stability in deep frying and spray coating, preventing thermal degradation that can affect product quality and flavor. Thanks to its phospholipid content, the oil acts as a natural emulsifier, enabling stable oil-in-water emulsions in salad dressings and sauces, thus eliminating the need for synthetic stabilizers and bolstering a clean label image. PepsiCo's 2024 sustainability report highlighted the company's move to reformulate 127 SKUs in its Frito-Lay and Quaker lines, integrating rice bran oil or its blends. This shift led to an average 18% reduction in saturated fat per serving. As manufacturers increasingly align with evolving nutritional guidelines and consumer demands for familiar ingredients, such reformulation efforts are set to escalate.
Retail channels, including supermarkets, hypermarkets, convenience stores, and online platforms, are witnessing an annual growth of 10.58%, projected to continue through 2031. This surge is a testament to changing consumer habits, with households leaning towards home cooking and opting for premium oils that promise both functionality and health benefits. Online retail is outpacing traditional channels, as highlighted by Amazon's 2025 report, which placed edible oils among the top 10 fastest-growing grocery subcategories. This growth is largely fueled by subscription models, offering enticing 15 to 20% discounts for regular deliveries. Meanwhile, foodservice and HORECA (hotels, restaurants, and catering) channels round out the demand landscape. In Asia Pacific, establishments are particularly drawn to the oil, valuing its frying stability and cost effectiveness compared to pricier imported olive or avocado oils.

Geography Analysis
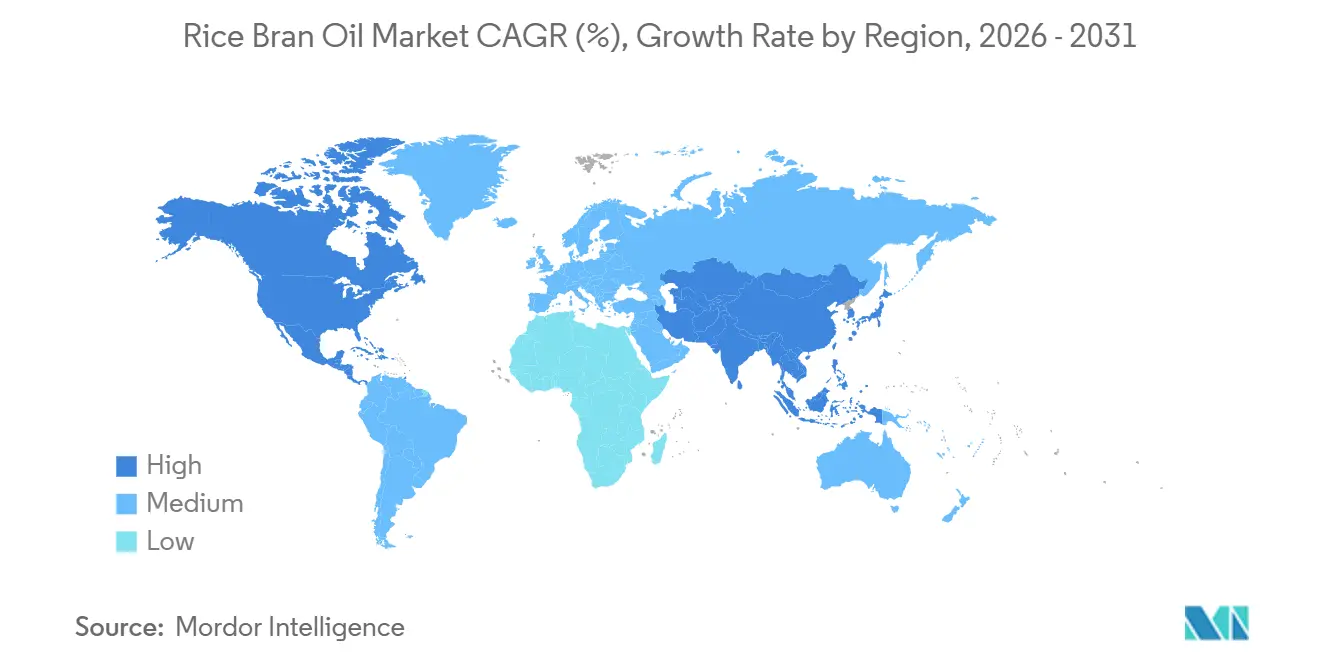
Asia-Pacific controlled 36.72% of the rice bran oil market in 2025 and is projected to compound at a 10.68% CAGR. India supplies nearly half of global output; policy support under NMEO-OS, coupled with elevated import duties on competing oils, is spurring refiners to add capacity across Uttar Pradesh, West Bengal, and Punjab. Japan contributes roughly 68,000 tonnes annually and continues to expand organic-rice acreage under its Green Food System Strategy. China’s fragmented market is estimated above 200,000 tonnes in consumption, driven by industrial frying and foodservice demand amid limited official data transparency.
North America and Europe together represented about 28% of 2025 demand and are distinguished by premiumization and stringent labeling. The new FDA “healthy” standard lowers barriers for rice bran oil to challenge olive and avocado oils on retail shelves in the United States, while EU organic-equivalency rules raise administrative thresholds that favor established suppliers. Programs such as the EU Carbon Border Adjustment Mechanism are sharpening corporate focus on embedded emissions, encouraging processors to adopt methane-mitigation practices in rice cultivation.
South America, the Middle East, and Africa hold the balance of global demand. Brazil’s urban consumers are gradually diversifying away from soybean dominance toward oils perceived as healthier. In the Gulf states, government wellness programs have catalyzed foodservice conversions. However, limited refrigerated-logistics capacity and higher import tariffs in regions such as South Africa temper volume growth, reinforcing the importance of nitrogen-flushed packaging and shelf-life management for exporters targeting these markets.
Regulatory Landscape
Regulation for rice bran oil focuses on edible-oil quality specifications, food safety limits, labeling and claims, and trade measures. At the international level, CODEX STAN 210-1999 (Codex Alimentarius Standard for Named Vegetable Oils) provides a common reference for quality parameters used in cross-border trade and buyer specifications. In India, the Food Safety and Standards Authority of India (FSSAI) sets separate requirements for refined rice bran oil and solvent-extracted crude rice bran oil, with crude solvent-extracted oil not permitted for direct human consumption and required to be refined before sale.
In the United States, rice bran oil appears in the FDA inventory of indirect food substances for food contact applications (21 CFR Parts 176.210, 177.2260, 177.2800), which supports packaging and processing uses across the edible-oils supply chain. Trade policy has also become a more active lever: Bangladesh moved from a December 2024 Bangladesh Trade and Tariff Commission recommendation to implementation by the National Board of Revenue of a 25% export duty on crude and refined rice bran oil, aimed at prioritizing domestic availability for edible-oil needs and affecting regional export flows.
Value Chain Analysis
The value chain begins with paddy procurement and rice milling, where bran is generated during polishing and then needs rapid stabilization to limit free fatty acid escalation and quality loss. Stabilization (heat, extrusion, steam, or microwave) is followed by collection and short-haul transport from dispersed mills, then solvent extraction to produce crude rice bran oil and de-oiled bran/cake. Crude oil then moves through refining (degumming, neutralization/deacidification, bleaching, deodorization) and dewaxing or winterization to meet clarity and sensory requirements for retail and food processing, while refining also creates co-products such as fatty acid distillates and wax fractions for downstream applications.
Midstream economics depend on how closely extraction and refining assets are integrated with local rice-milling throughput, since feedstock dispersion favors limited transport radii and coordinated aggregation. Downstream channels include bulk sales to food processors and foodservice, as well as branded retail packs and private label via supermarkets and online platforms. In these routes, packaging choices (light or oxygen barriers, nitrogen flushing) and bulk handling practices affect oxidation control and bioactive retention. Key bottlenecks include uneven access to stabilization capacity near mills and quality losses during ambient storage and long-distance distribution, which drives the need for improved bulk logistics, packaging upgrades, and standardized testing aligned with Codex and national edible-oil norms.
Competitive Landscape
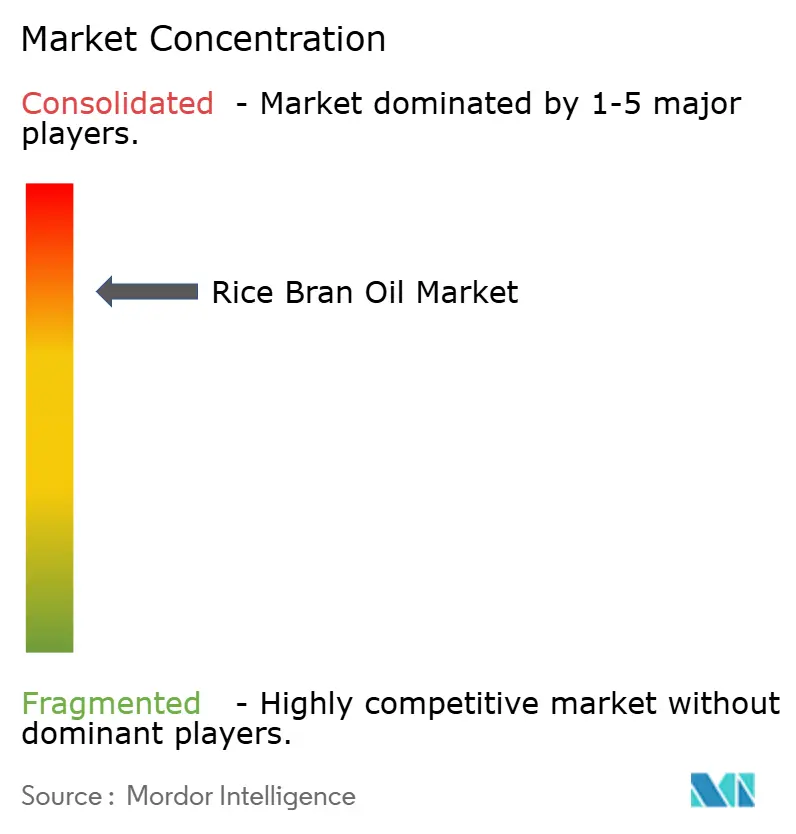
The rice bran oil market is highly consolidated, with multinationals like Adani Wilmar, Wilmar International, and Cargill rapidly scaling rice-bran operations by leveraging existing seed-crushing and distribution infrastructures. Adani Wilmar’s 150,000-tonne refinery in Uttar Pradesh, operational since January 2025, has doubled extraction capacity and employs nitrogen-flushed lines to extend shelf life by six months. Cargill’s expansion in Thailand incorporates supercritical CO₂ extraction to target high-bioactive segments and premium buyers in Japan and Australia, while Wilmar's joint venture in Heilongjiang strengthens China's domestic supply resilience. Disruptors like Thrive Market and Vitacost are bypassing retail bottlenecks through direct-to-consumer storefronts, offering private-label organic rice bran oil at 10-15% discounts compared to national brands, supported by subscription incentives.
Technological advancements, such as US Patent Application 20240123456 on membrane-filtration refining, promise 12-15% reductions in refining losses and improved γ-oryzanol retention, providing IP-holders with a competitive advantage. Larger players maintain an edge in cross-border trade by adhering to quality certifications like ISO 22000 and Codex STAN 210-1999, supported by dedicated compliance teams. Meanwhile, the industry is evolving through significant investments in modern processing methods and preservation techniques. Collaborative efforts between rice processors and technology providers have introduced non-thermal stabilization methods that preserve the oil's beneficial compounds while extending its usability. Additionally, research breakthroughs have revealed that rice bran-derived nanoparticles possess anti-cancer properties, opening new opportunities in pharmaceutical applications that could reshape the market's future trajectory.
The market offers substantial opportunities in high-value segments such as organic products and specialized applications in cosmetics and nutraceuticals, which command premium prices due to rice bran oil's natural antioxidant properties. While newer companies focus on environmental sustainability and direct consumer relationships, established players are responding by acquiring promising businesses and expanding their product portfolios. Regulatory frameworks, including FDA requirements for rice bran wax applications and international quality standards, create natural barriers that favor larger, established companies with robust quality control systems. These dynamics, coupled with ongoing technological advancements and evolving consumer preferences, are shaping the competitive landscape of the rice bran oil market.
Rice Bran Oil Industry Leaders
-
Adani Wilmar Ltd.
-
Ricela Group
-
Cargill Incorporated
-
King Rice Oil Group
-
Marico Ltd.
- *Disclaimer: Major Players sorted in no particular order
Market Opportunities and Future Outlook
Premium positioning and active industrial reformulation are creating room for higher-bioactive and cleaner-label rice bran oil offerings, supported by investments in processing technology and portfolio expansion. In March 2026, Cargill announced an expansion at Port Klang, Malaysia, adding a specialty fats production line and a Lipid R&D center, which points to a stronger focus on differentiated lipid solutions that can pull through demand for rice bran oil fractions and related blends across food processing and other value-added applications.
Government procurement and standards harmonization also add more concrete demand anchors for scaling in select markets. In March 2026, Bangladesh approved procurement of 1.80 crore liters of refined rice bran oil for the Trading Corporation of Bangladesh family card program, creating a structured offtake path for local mills and reinforcing the role of institutional buying in volume absorption. Separately, in March 2026, the Tanzania Bureau of Standards published a new standard for edible rice bran oil, supporting formal specifications, testing, and compliance pathways for branded and bulk suppliers entering or expanding in the East African market.
Recent Industry Developments
- March 2026: Cargill announced an expansion of its Port Klang, Malaysia edible oils facility, adding a specialty fats production line and a Lipid R&D center. The move strengthens Cargill's higher-value lipid processing footprint in Asia and supports development of differentiated edible-oil solutions that can incorporate rice bran oil fractions. It also indicates continued investment in advanced processing capabilities that shape product specifications demanded by global food manufacturers.
- September 2025: CRISIL Ratings published a rationale update for Ricela Health Foods Limited, highlighting its scale as a dedicated rice bran oil and derivatives player. The note emphasized how capacity utilization, procurement discipline, and working-capital management affect profitability in a feedstock-dispersed category. Such third-party assessments can influence access to bank funding for inventory build and plant upgrades among Indian rice bran oil processors.
- October 2024: BCL Bio Energy Private commenced production of crude edible oils, including crude rice bran oil, at its solvent extraction plant with 300 tonnes per day capacity. The start-up expands upstream extraction output and increases availability of crude feedstock that must be refined for edible use, supporting domestic value addition in India. It also increases supplies of de-oiled cake co-products, tightening linkages between the edible oil and animal feed value chains.
Research Methodology Framework and Report Scope
Market Definition and Coverage
For this study, the rice bran oil market is defined as the commercial sale of edible oil extracted from rice bran, tracked in value terms across packaged retail and bulk channels, and counted at the point where it is sold into food use and related consumer applications.
Scope exclusions: Excludes non-oil rice bran derivatives (such as wax, meal, and extracts) and broader edible oils not produced from rice bran.
Segmentation Overview
- Nature
- Organic
- Conventional
- Type
- Refined
- Non-Refined
- End Use
- Food Processing
- Foodservice/HORECA
- Retail
- Supermarkets/Hypermarkets
- Convenience Stores
- Online Retail
- Others
- By Geography
- North America
- United States
- Canada
- Mexico
- Rest of North America
- Europe
- Germany
- United Kingdom
- France
- Spain
- Netherlands
- Italy
- Sweden
- Poland
- Belgium
- Rest of Europe
- Asia-Pacific
- China
- India
- Japan
- Australia
- Rest of Asia-Pacific
- South America
- Brazil
- Argentina
- Rest of South America
- Middle East and Africa
- United Arab Emirates
- South Africa
- Saudi Arabia
- Rest of Middle East and Africa
- North America
Data Sources, Market Sizing, and Validation
Desk Research
Desk research was used to set the factual base of the model and to avoid using assumptions that cannot be cross-checked. We relied on public sources such as FAOSTAT for rice production context, UN Comtrade for trade flows of edible oils where applicable, and national agriculture and food statistics portals in large rice economies.
Alongside this, we reviewed USDA oilseeds and edible-oils publications, Codex references and food safety regulator guidance on edible oils, and peer-reviewed food science journals for yield and processing references. Company annual reports, investor presentations, and reputed press were used to track capacity additions, brand activity, and channel shifts. We also used paid subscriptions for company financials and intelligence, and for shipment-level import and export checks when public trade series lacked detail. These examples are not exhaustive, and other public documents were referred to for data collection, validation, and clarification.
Primary Interviews and Surveys
Primary work focused on validating how much rice bran oil is placed into the edible oil pool, and what price and channel mix is realistic by region. We spoke with a mix of refiners, distributors, retail-channel participants, and industry experts across Asia-Pacific, EMEA, and the Americas to pressure-test secondary inputs, fill gaps on conversion assumptions, and align the final view with buying behavior observed in channel discussions.
Distribution of primary research fieldwork respondents
| Company type | Respondent position | Region |
|---|---|---|
| Top tier: 38% | CXOs: 18% | APAC: 40% |
| Mid tier: 44% | Functional/Unit leaders: 38% | EMEA: 37% |
| Smaller Players: 18% | Managers: 44% | Americas: 23% |
Market-Sizing & Forecasting
Sizing started with a top-down build where rice output signals, rice bran availability, and typical oil recovery rates were used to reconstruct the potential supply base, which was then filtered by food-grade processing and the share sold as rice bran oil. After that, value was formed using regional price benchmarks and a channel-weighted mix, since bulk and retail packs can behave differently.
To keep totals realistic, selective bottom-up checks were run using capacity and utilization cues, sampled price-per-liter ranges from major retail markets, and distributor feedback on volume movement by channel. In markets where direct data was thin, gaps were handled through proxy indicators such as edible oil consumption trends, import dependence, and labeled premium pricing versus common seed oils, and then re-tested through follow-up expert validation.
Forecasts were built using scenario analysis supported by short-series trend smoothing. The main drivers were rice milling throughput, health-led cooking oil adoption, modern retail and online penetration, and expected pricing movement linked to feedstock and refining costs. Assumptions were adjusted when primary inputs indicated a break from past patterns, for example when supply constraints or regulation-driven labeling changes were expected to shift demand.
Data Validation & Update Cycle
Validation was done through multiple checks so the model stayed consistent with independent market signals. The team compared implied consumption with edible oil demand indicators, reviewed trade and production alignment, and checked for outliers in price and growth rates before sign-off.
When large variances showed up, inputs were revisited and respondents re-contacted to confirm whether the change was structural or temporary. Reports are refreshed annually, and interim updates are made when major events materially change supply, pricing, or trade. Before delivery, an analyst completes a fresh review pass so the final dataset reflects the latest available public releases and confirmed field inputs.
Mordor Intelligence's Rice Bran Oil Market Size Versus Other Published Estimates
Published market sizes for rice bran oil often do not match because the counting rules vary, especially around what gets included as the product and where value is captured in the chain. Differences also come from the base year, whether figures are reported in nominal or constant dollars, and how quickly price changes are reflected.
A common gap driver is scope creep, where some sources fold in broader edible oils or include non-edible industrial uses, inflating totals. Another driver is the pricing method, since using a single global average price can distort regions where bulk sales dominate. The spread also widens when assumptions are not re-tested after crop swings and refining cost changes. For this reason, the model treats only food-grade sales of rice bran oil and refreshes key conversion and pricing inputs, which is the approach applied by Mordor Intelligence.
Benchmark comparison
| Source | Market Size | Gaps in Research Methodology |
|---|---|---|
| Mordor Intelligence | USD 2.25 B (2025) | |
| Global Consultancy A | USD 10.81 B (2025) | This figure appears to be based on a broader included-value approach, where adjacent edible-oil categories or downstream packaged-value layers can be counted with rice bran oil, and where higher average pricing assumptions raise the total versus a channel-weighted edible-oil price mix. |
| Industry Publisher B | USD 5.14 B (2025) | The estimate is closer but still likely reflects different inclusion rules by application and channel, and it may rely on less frequent price refresh and regional mix checks, which can overstate value in markets where bulk trade and lower ASPs dominate. |
Across the three figures, the spread is mainly explained by what is counted as rice bran oil versus adjacent oils, and how prices are built across bulk and retail channels. Using explicit conversion, trade, and channel-mix checks makes the final number easier to trace back to real supply and consumption signals, and it also makes year-to-year updates more repeatable.
Key Questions Answered in the Report
What is the projected value of the rice bran oil market by 2031?
It is forecast to reach USD 3.94 billion by 2031.
Which region leads global demand for rice bran oil?
Asia-Pacific held 36.72% of revenue in 2025 and is growing the fastest through 2031.
Why is rice bran oil preferred for deep-frying?
Its high smoke point of about 232 °C limits polar-compound formation, extending fry life and preserving flavor.
How fast is the organic segment expanding?
Organic rice bran oil is advancing at a 10.75% CAGR, outpacing the overall market.