Market Overview
| Study Period | 2020 - 2031 |
|---|---|
| Forecast Data Period | 2026 - 2031 |
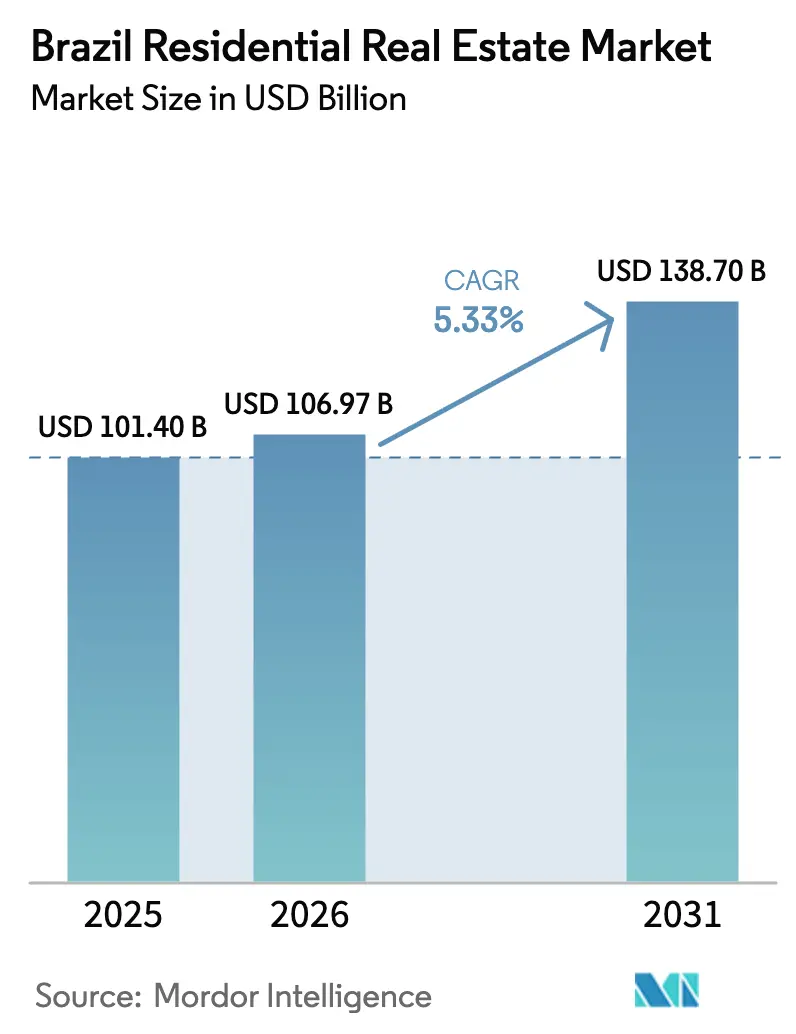
| Base Year Market Size (2025) | USD 101.40 Billion |
| Market Size (2026) | USD 106.97 Billion |
| Market Size (2031) | USD 138.70 Billion |
| Growth Rate (2026 - 2031) | 5.33% CAGR |
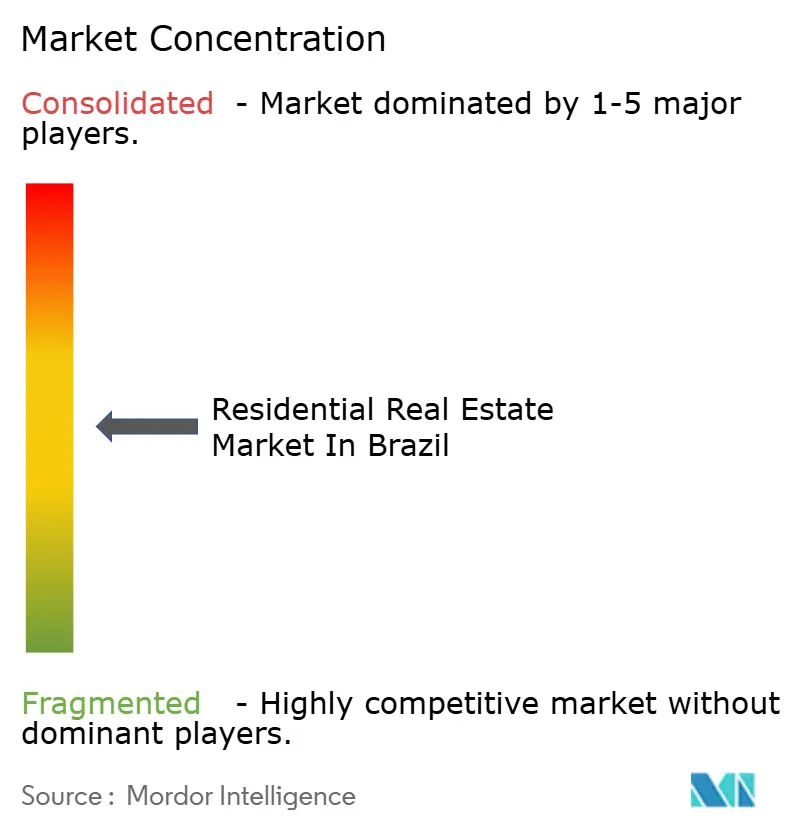
| Market Concentration | Medium |
Major Players *Disclaimer: Major Players sorted in no particular order Image © Mordor Intelligence. Reuse requires attribution under CC BY 4.0. | |
Brazil Residential Real Estate Market Analysis by Mordor Intelligence
The Brazil residential real estate market size reached USD 106.97 billion in 2026 and is projected to reach USD 138.7 billion by 2031 at a 5.33% CAGR. Stable policy support and targeted subsidies are holding up demand despite the preceding period of restrictive interest rates, with owner-occupier purchases absorbing part of the shock that curbed speculative activity in 2025. Affordable-housing contracts under Minha Casa, Minha Vida have scaled rapidly since the 2023 relaunch, which is reinforcing primary-market velocity and reducing reliance on higher-cost consumer credit channels. Developers are also adjusting financing strategies and product mixes to defend margins and pace launches, while competitive dynamics are moving toward balance-sheet strength and construction industrialization. Infrastructure capacity is a rising field-level constraint in select fast-verticalizing metros where services have not caught up with approvals, a risk that operators and insurers are incorporating into underwriting and project planning.[1]https://www.gov.br/pt-br
Key Report Takeaways
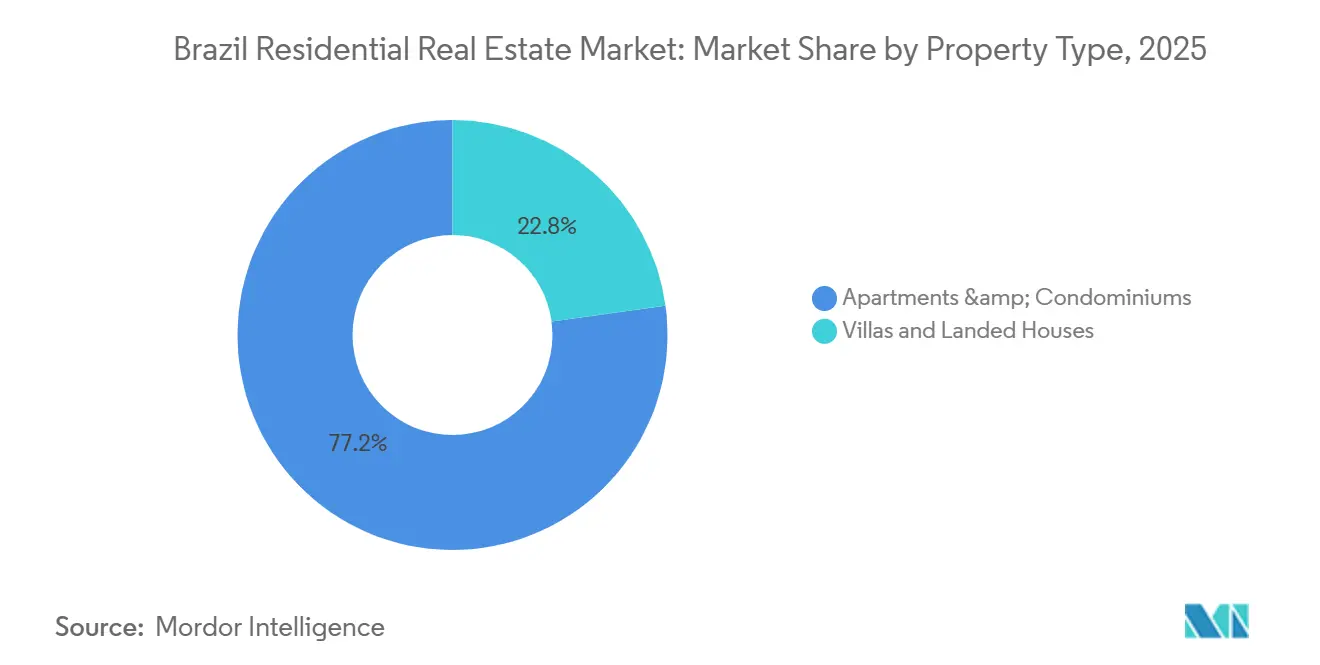
- By property type, apartments and condominiums led with 77.17% revenue share in 2025; villas and landed houses are projected to expand at a 6.31% CAGR to 2031.
- By price band, the mid-market segment held 49.13% share in 2025; the luxury segment is projected to record the fastest CAGR through 2031 at 7.38%.
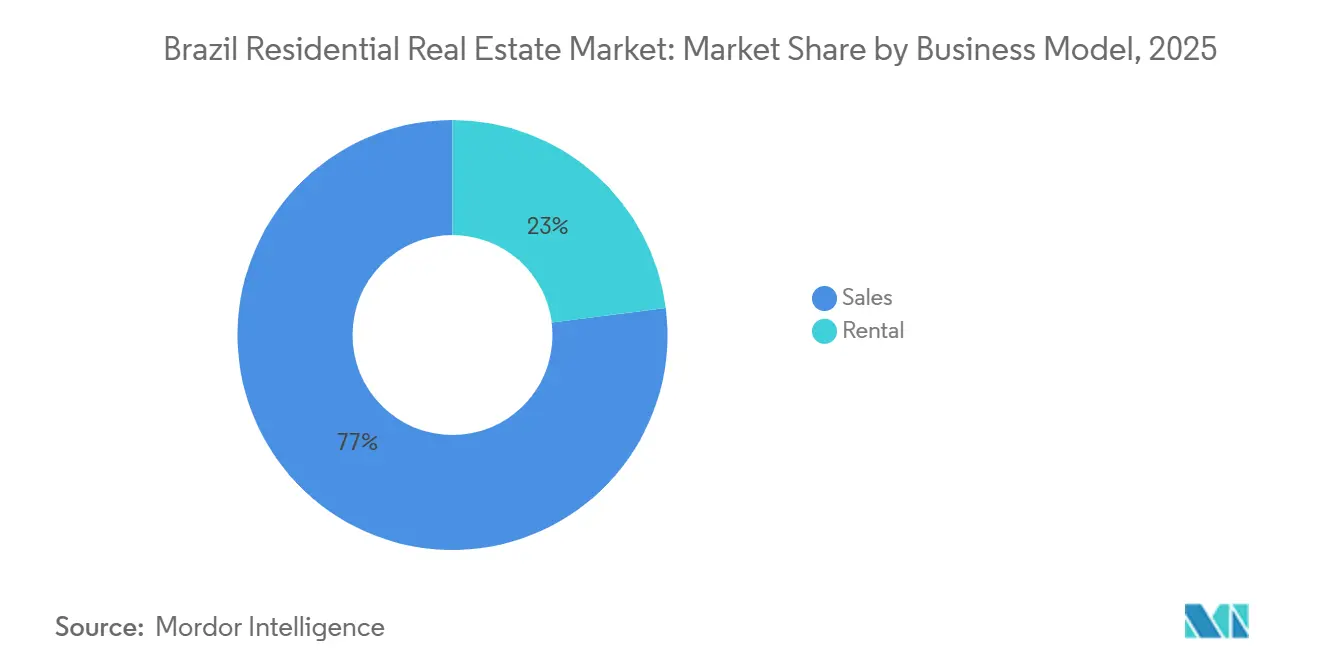
- By business model, the sales segment accounted for 77.00% of the Brazil residential real estate market share in 2025, while the rental segment recorded a 5.81% projected CAGR through 2031.
- By mode of sale, secondary transactions held a 68.90% share in 2025; the secondary channel is forecast to expand at a 7.10% CAGR to 2031.
- By geography, São Paulo held a 24.16% regional share in 2025, while Rio de Janeiro is projected to grow at a 6.88% CAGR through 2031.
Note: Market size and forecast figures in this report are generated using Mordor Intelligence’s proprietary estimation framework, updated with the latest available data and insights as of January 2026.
Brazil Residential Real Estate Market Trends and Insights
Drivers Impact Analysis*
| Drivers | (~) % Impact on CAGR Forecast | Geographic Relevance | Impact Timeline |
|---|---|---|---|
| Accelerated Mortgage Subsidies Under Minha Casa Minha Vida | +2.1% | National, strong in São Paulo and the Northeast | Medium term (2-4 years) |
| Declining Selic Rate Enhancing Mortgage Affordability | +1.4% | Strongest in São Paulo, Rio de Janeiro, Brasília | Medium term (2-4 years) |
| Urban Zoning Reform Enabling Vertical Residential Densification | +0.9% | São Paulo transit corridors, João Pessoa | Long term (≥ 4 years) |
| Digital Brokerage & iBuyer Platforms Reducing Transaction Friction | +0.6% | Major urban centers and select secondary cities | Short term (≤ 2 years) |
| ESG-Linked Green-Finance Incentives for Sustainable Construction | +0.5% | National framework, early gains in major capitals | Long term (≥ 4 years) |
| Foreign Capital Seeking Inflation-Hedged Rental Yields | +0.4% | São Paulo and Rio de Janeiro | Medium term (2-4 years) |
| Source: Mordor Intelligence | |||
Accelerated Mortgage Subsidies Under Minha Casa Minha Vida Program Propelling Affordable-Bracket Velocity
The 2023 relaunch and expansion of Minha Casa, Minha Vida accelerated contracting momentum, with program volume signaling sustained support into 2026. Updated eligibility with the April 2025 Faixa 4 addition opened financing to a higher-income cohort at longer tenors, which pulled forward demand in segments that were constrained by bank credit. The subsidy architecture and construction-credit disbursement model reduce working-capital pressure for qualifying projects, which has supported launch cadence even during tighter monetary conditions. São Paulo has hosted a large share of launches due to mature land titling and integrated supply chains, while targeted concessions in the Northeast widen inclusion where baseline affordability is tighter. Developers with industrialized building systems have leaned into the program’s liquidity and demand visibility, which helped defend margins despite input-cost pressures in 2025.[2]https://www.abecip.org.br/
Declining Selic Rate Enhancing Mortgage Affordability From a 2026 Pivot
Monetary policy remained restrictive through late 2025, but forward guidance shifted toward a cutting cycle as inflation expectations stabilized, setting up an affordability tailwind into 2026. Incremental policy adjustments by Caixa and the SBPE framework eased access conditions by increasing property-value ceilings and loan-to-value limits for eligible products, which released liquidity back into purchase financing. As mortgage rates compress, installment-to-income ratios improve most for middle-income buyers who were temporarily priced out, allowing developers to broaden offerings beyond subsidy thresholds. Pre-positioned landbanks and off-plan sales funnels are likely to monetize this demand release faster than secondary resales, given build schedules and unit reservations already in place. The Brazil residential real estate market is therefore poised for a clearer handoff from policy support to credit-led affordability as 2026 progresses.[3]https://www.bcb.gov.br/
Urban Zoning Reform Enabling Vertical Residential Densification in Transit Corridors
Zoning revisions in São Paulo expanded transit-oriented densification zones around metro and high-capacity bus corridors, while preserving strict rules in exclusively residential areas, creating targeted density premiums rather than citywide overbuild. This framework has encouraged launches of compact units sized for affordability and proximity, which translated into stronger sales velocity in 2025, where supply aligns with commuting patterns. In João Pessoa, the share of vertical dwellings reached a high level by 2024, showing how coastal planning is channeling demand into inland corridors to protect sensitive areas. The policy mix creates a bifurcated land market, with parcels in expanded corridors capturing value and legacy low-density plots relying on differentiated propositions. For the Brazil residential real estate market, these zoning changes shape product design, project viability, and neighborhood evolution over a multi-year horizon.
ESG-Linked Green-Finance Incentives for Sustainable Construction
Brazil approved a national sustainable taxonomy in 2025 that establishes guidelines for classifying eligible activities, improving transparency for lenders and investors. This classification is beginning to influence capital allocation toward projects that meet environmental and social criteria, which can translate into funding advantages for compliant developers. The central bank’s sustainable finance agenda and climate-scenario analysis have raised awareness of transition and physical risks, which lenders are incorporating into underwriting. Builders moving toward lower embodied emissions, higher efficiency, and credible disclosure are better positioned to access and price credit in their favor. Over the medium to long term, the Brazil residential real estate market stands to benefit from an expanding pool of green finance that rewards resilient and lower-risk assets.
Restraints Impact Analysis*
| Restraints | (~) % Impact on CAGR Forecast | Geographic Relevance | Impact Timeline |
|---|---|---|---|
| Construction Input-Cost Inflation Pressuring Developer Margins | -1.3% | National, with acute pressure on the Mid-Market and Economy segments in São Paulo, Rio de Janeiro, and Belo Horizonte | Short term (≤ 2 years) |
| Municipal Licensing Delays Extending Project Lead Times | -0.9% | Metropolitan São Paulo, Rio de Janeiro, Brasília; spillover to Curitiba and Porto Alegre | Medium term (2-4 years) |
| Tightened Bank Credit Standards Post-2022 Delinquencies | -1.5% | National, with disproportionate impact on first-time buyers and mid-market purchasers across all major metropolitan regions | Medium term (2-4 years) |
| High Disaster-Risk Exposure Elevating Compliance Costs | -0.6% | Coastal zones (Rio de Janeiro, Santos, Salvador), hillside developments, and flood-prone areas in Amazon basin states | Long term (≥ 4 years) |
| Source: Mordor Intelligence | |||
Construction Input-Cost Inflation Pressuring Developer Margins Below Viability Thresholds
Rising materials and labor costs outpaced consumer inflation in 2024 and 2025, which compressed gross margins for price-capped affordable projects. This squeeze was most challenging for builders serving Minha Casa, Minha Vida brackets, where ticket sizes limit pricing flexibility while timelines and compliance obligations add fixed costs. Larger operators mitigated pressure by adopting industrialized construction and tighter project controls, but smaller firms had less capacity to invest in productivity tools. The cost backdrop also encouraged a shift in launch geography toward areas with more favorable land economics. In the Brazil residential real estate market, this restraint required developers to rebalance portfolios and adjust specifications to preserve unit economics.
Municipal Licensing Delays Extending Project Lead Times and Elevating Carrying Costs
Updated rules in São Paulo increased technical scrutiny of underground works in geotechnically sensitive zones, which lengthened approval cycles and raised carrying costs on land and preconstruction. Capacity constraints at municipal review bodies in fast-growing vertical markets compounded delays, extending the time between site control and launch. Developers adapted by front-loading studies and engaging specialized consultants to reduce iteration during reviews, an approach that favors well-capitalized players. Community pushback in certain neighborhoods where infrastructure stress is visible has also led to more conservative approvals. This friction increases time-to-cash and can deter new entrants, shaping supply dynamics in the Brazil residential real estate market.
*Our forecasts treat driver/restraint impacts as directional, not additive. The impact forecasts reflect baseline growth, mix effects, and variable interactions.
Segment Analysis
By Property Type: Compact Apartments Anchor Supply, Landed Houses Capture Lifestyle Migration
Apartments and condominiums held 77.17% of 2025 activity, consolidating their role as the standard format in dense corridors of São Paulo, Rio de Janeiro, and Brasília. In São Paulo, compact studios and two-bedroom units sized for transit access and budget fit saw healthy absorption in mid-2025, signaling a sustained preference for location and price alignment. The Brazil residential real estate market continues to favor vertical formats where land scarcity and planning incentives meet commuter demand. Villas and landed houses remain a smaller slice but are projected to grow at a faster 6.31% pace through 2031, supported by lifestyle migration to suburban and secondary-city districts with more space. Developers using off-site methods and phased master plans are better placed to serve this interest, where serviced plots and approvals are available.
The expected moderation in apartment growth from the 2024 surge reflects the need to absorb inventory while credit conditions normalize. The Brazil residential real estate market is calibrating unit mix and price points within apartment launches to broaden eligible buyer pools as mortgage policy loosens through 2026. For landed formats, consumer segments seeking yards and flexible layouts have a clearer runway in municipalities balancing growth with infrastructure provision. The Brazil residential real estate industry is therefore segmenting product strategies around corridor densification for apartments and planned-community depth for houses, each with distinct capital and permitting profiles.


By Price Band: Mid-Market Breadth Offset by Upper-Tier Momentum
The mid-market segment accounted for 49.13% of transactions in 2025, underpinned by subsidized financing and product standardization aligned to Minha Casa, Minha Vida thresholds. Program design reduces monthly payments and improves eligibility for first-time buyers, stabilizing sales even when benchmark rates are high. The Brazil residential real estate market is now addressing the newly eligible Faixa 4 cohort, which opened longer-tenor financing at regulated rates for middle-income households. Developers who prepared land and permit pipelines for this tier moved early to capture demand, signaling a near-term mix shift toward upper-mid product. Luxury remains a smaller share but carries the fastest projected growth rate at 7.38% through 2031, reflecting wealth-protection motives and the supply profile of prime districts.
As bank and SBPE rules raised eligible property ceilings and loan-to-value limits, upper-middle transactions above subsidy brackets gained financing pathways, which broadened the mid to upper-mid funnel. The Brazil residential real estate market is therefore balancing volume at the subsidized core with margin opportunities at higher ticket sizes as financing catches up with demand. Early-mover brands have already launched projects tailored to the Faixa 4 band, embedding design and amenity profiles that fit the cohort’s purchasing power. Over the forecast, affordability improvements and policy stability are likely to sustain mid-market breadth while allowing the faster-growing luxury tail to contribute more meaningfully to total value. The Brazil residential real estate industry will keep flexing pricing strategies by submarket as rate cuts filter through and household incomes reset.
By Business Model: Sales Segment Shields Volatility Through Developer-Direct Financing
The sales model accounted for 77.00% of 2025 activity and is projected to grow at 6.54% annually through 2031, reinforcing homeownership’s prominence in household balance sheets. Developers bridged bank-credit constraints by offering direct financing and leveraging receivables structures where appropriate to maintain reservation and conversion flows. As the Caixa and SBPE reforms freed additional compulsory deposits for housing credit, access conditions improved for eligible borrowers and projects. The Brazil residential real estate market, therefore, benefited from a two-channel financing support system that included both program-driven origination and developer-enabled payment plans. Rental remains a meaningful but smaller share, with institutional models emerging where policy and underwriting frameworks allow long-duration capital.
As interest rates trend lower in 2026, purchase affordability gains are expected to lift sales further, while rental demand continues to respond to demographic and mobility trends. The Brazil residential real estate market is also seeing more structured partnerships for off-plan velocity, including receivables-backed funding that helps align construction timelines with sales schedules. Over the forecast, policy-driven origination and improved mortgage terms should align with developer working-capital practices to support steady absorption. The sales-to-rental balance will continue to reflect local labor-market patterns and legal frameworks in each metro. The Brazil residential real estate industry will likely sustain a sales-led composition while deepening professionally managed rental stock in select corridors.
By Mode of Sale: Primary Channel Dominates Through Off-Plan Velocity and Margin Preservation
In 2025, secondary transactions commanded 68.9% of total sales, and they are expected to advance at a 7.1% compound annual rate through 2031, reflecting buyers' appetite for move-in-ready homes and the absence of construction risk. A significant portion of these resales occurs in São Paulo, where mature districts offer immediate access to infrastructure, schools, and transit that appeal to families and working professionals. Purchasers in the secondary segment value assured delivery dates and familiar neighborhoods more than customization, enabling faster deal cycles and smoother financing approvals.
The Brazil residential real estate market, therefore, preserves a clear channel advantage for resales, as robust inventory levels and standardized property inspections enhance transparency. By contrast, primary sales attract buyers prepared to accept construction lead times in exchange for lower prices and unit personalization, yet their expansion remains subdued because credit-sensitive consumers prefer completed assets during periods of economic uncertainty.
Geography Analysis
São Paulo captured 24.16% of 2025 activity, reflecting a diversified economy, mature mortgage origination, and a long pipeline of transit-corridor projects. Launch volumes in 2025 remained high for Minha Casa, Minha Vida-aligned formats, and mid to upper-mid projects, which buffer cyclical effects and spread risk. Rio de Janeiro is projected to grow at 6.88% through 2031, supported by retrofit opportunities and policy initiatives to reactivate underutilized buildings in central areas. The Brazil residential real estate market is also seeing a steady contribution from Brasília and interior cities linked by improved infrastructure to primary job centers.
Northeastern capitals and coastal cities are attracting second-home and retirement demand as planning frameworks channel growth and preserve sensitive corridors. In João Pessoa, the share of households in vertical dwellings reached a high level in 2024, underscoring the pace of densification and the concomitant need for infrastructure matched to demand. For São Paulo, planning revisions expanded the radius and parameters of transit-oriented corridors while protecting low-density zones, which sharpened the land-value gradient and product strategies by neighborhood. The Brazil residential real estate market size in São Paulo will remain large due to the depth of demand, while growth rates in Rio de Janeiro are expected to be faster because of product repositioning and retrofit economics.
Across the Rest of Brazil, developers align launches with municipal capacity and demand migration toward affordable submarkets that retain access to major job corridors. Financing and subsidy frameworks apply nationwide, but execution advantages concentrate where land titling, permitting, and service capacity are strongest. The Brazil residential real estate market continues to diversify geographically along variables of affordability, infrastructure, and permitting speed, which underpins resilience at the national level. As rate cuts feed through in 2026, metros with ready pipelines and clear policy alignment should lead the acceleration in both primary and secondary channels.
Competitive Landscape
Competition in the Brazil residential real estate market is moderate, but rising tech adoption reshapes hierarchies. MRV leverages scale to negotiate bulk cement discounts, though it trims inventory to release cash. Cyrela eyes larger ticket sizes in São Paulo’s core, pushing gross margins above 34%. Direcional focuses on North and Northeast cities, matching subsidy brackets with local wage levels.
PropTechs inject digital speed. Loft achieved breakeven and now acquires regional brokers to fold in title-insurance sales. COFECI regulation of tokenized deeds allows startups to fractionalize assets; the first exchange goes live in 2025 with 76 properties, 70% residential. Legacy brokers react by offering hybrid online-offline services.
Capital-market vehicles expand. The REIT universe tops 500 funds; mortgage REITs account for 40% of USD 32.31 billion net assets. Pátria’s acquisition spree lifts assets under management to USD 4.4 billion, meeting the asset-size threshold to win pension-fund mandates. ESG bond buyers favor developers with verified carbon-tracking dashboards, giving early adopters cheaper debt.
Brazil Residential Real Estate Industry Leaders
MRV Engenharia e Participações S.A.
Cyrela Brazil Realty S.A.
Direcional Engenharia S.A.
Construtora Tenda S.A.
Even Construtora e Incorporação S.A.
- *Disclaimer: Major Players sorted in no particular order

Recent Industry Developments
- October 2025: The Federal Court of the Federal District suspended all effects of Conselho Federal de Corretores de Imóveis Resolution 1.551/2025, ruling that the council exceeded its authority by legislating on securities and central bank matters.
- October 2025: The Brazilian federal government announced a new real estate credit model modernizing the Sistema Brasileiro de Poupança e Empréstimo rules, raising the Sistema Financeiro da Habitação property-value ceiling from R$ 1.5 million to R$ 2.25 million and increasing the maximum loan-to-value ratio to 80 percent under the Sistema de Amortização Constante, aiming to inject R$ 40 billion into housing credit over two years by freeing compulsory savings deposits for real estate lending, with projections to finance an incremental 80,000 units through 2026.
- August 2025: The Brazilian Sustainable Taxonomy was approved to categorize sustainable economic activities, with phased implementation for listed companies and financial institutions.
- June 2025: Moura Dubeux launched its new mid-income brand Mood with over R$ 1 billion in projected sales value, targeting Minha Casa Minha Vida Faixa 4 buyers, and created Única focused on Tier 3, supporting a raised launch forecast to 16 percent CAGR for 2024 to 2027.


Research Methodology Framework and Report Scope
Market Definitions and Key Coverage
Our study defines Brazil's residential real estate market as the aggregate transaction value of newly built and existing dwellings, houses, villas, apartments, and condominiums purchased or rented by households across all states and federal districts in a given year.
Scope Exclusion: Land-only trades, timeshare units, and short-term vacation rentals listed on peer-to-peer platforms are outside this scope.
Segmentation Overview
- Sales
- Rental
Detailed Research Methodology and Data Validation
Primary Research
Mordor analysts interview developers, brokerage heads, mortgage officers, and housing program officials across São Paulo, Rio de Janeiro, Brasília, and fast-growing Northeast capitals. These conversations validate launch pipelines, typical selling prices, buyer mix, and expected subsidy disbursements, filling gaps unseen in pure desk work.
Desk Research
To quantify and qualify the market, we sift through open data sets from Brazil's CBIC housing dashboard, FIPEZAP price index panels, ABECIP mortgage lending statistics, and IBGE demographic releases, which together capture supply, price, and demand pulses. We add insights from Secovi-SP city-level launch reports, World Bank macro indicators, and central bank Selic rate archives that signal affordability shifts.
Complementary depth comes from company SEC and CVM filings, investor decks, widely circulated media coverage collected via Dow Jones Factiva, and patent trends monitored through Questel when construction technology has a bearing on unit costs. The sources cited illustrate, not exhaust, the spectrum reviewed.
Market-Sizing & Forecasting
A top-down construct begins with CBIC national sales and launch volumes, FIPEZAP median price series, and ABECIP financing flows; these totals are then reconciled with bottom-up checks on sampled city ASP times unit data and developer revenue disclosures. Key drivers, Selic trajectory, household formation, housing deficit backlogs, and MCMV subsidy envelopes enter a multivariate regression that extends the baseline to 2030. Where project-level data are thin, we bridge gaps with stable regional price per square meter medians and historical absorption rates.
Data Validation & Update Cycle
Outputs run through anomaly screens, cross-tab variance reviews, and a senior analyst sign-off. Models refresh each year, with interim adjustments when policy or credit shocks materially shift volumes. Before release, an analyst re-checks last quarter indicators so subscribers receive an up-to-date view.
Why Mordor's Brazil Residential Real Estate Baseline Is Dependable
Published estimates often diverge because firms slice geography, dwelling type, and transaction pathway differently, or lock forecasts to static currency views.
Key gap drivers include narrower regional focus, omission of resale flows, use of older exchange rates, and slower refresh cadences, which together compress or overstate totals relative to our blended approach.
Benchmark comparison
| Market Size | Anonymized source | Primary gap driver |
|---|---|---|
| USD 95.59 B (2024) | Mordor Intelligence | - |
| USD 60.00 B (2024) | Global Consultancy A | Excludes secondary market resales and adjusts prices only to 2019 BRL base. |
| USD 65.00 B (2023) | Regional Consultancy B | Covers five metro areas, uses unit count times uniform ASP without mortgage value reconciliation. |
The comparison shows how our wider scope, current year currency conversion, and dual validation of volume and price deliver a balanced, transparent baseline that decision makers can trace back to clear variables and repeatable steps.


Key Questions Answered in the Report
What is the current size and growth outlook for the Brazil residential real estate market?
The Brazil residential real estate market size is USD 106.97 billion in 2026 and is projected to reach USD 138.70 billion by 2031 at a 5.33% CAGR.
Which segments lead and which are growing fastest within the Brazil residential real estate market?
Apartments and condominiums led with 77.17% share in 2025, while villas and landed houses are projected to be the fastest growing at 6.31% through 2031.
How are subsidies and mortgage policy affecting demand in the Brazil residential real estate market?
Minha Casa, Minha Vida, and recent SBPE and SFH updates are expanding eligibility, improving loan-to-value limits, and stabilizing first-time buyer demand ahead of a 2026 affordability tailwind.
What is the competitive focus among leading developers in the Brazil residential real estate market?
Scale builders are emphasizing industrialized construction, receivables-backed funding, and ESG-readiness, while forming strategic partnerships like the CPP Investments and Cyrela venture in São Paulo.
Which regions are most important in the Brazil residential real estate market?
São Paulo holds the largest share at 24.16% while Rio de Janeiro shows the fastest projected growth at 6.88% through 2031, with João Pessoa and other Northeastern markets adding depth.
How will ESG and sustainable finance influence the Brazil residential real estate market?
The 2025 sustainable taxonomy and central bank guidance are directing capital toward compliant projects, which can reduce funding costs and improve credit access for qualifying developments.
Page last updated on:


