Market Overview
| Study Period | 2020 - 2031 |
|---|---|
| Forecast Data Period | 2026 - 2031 |
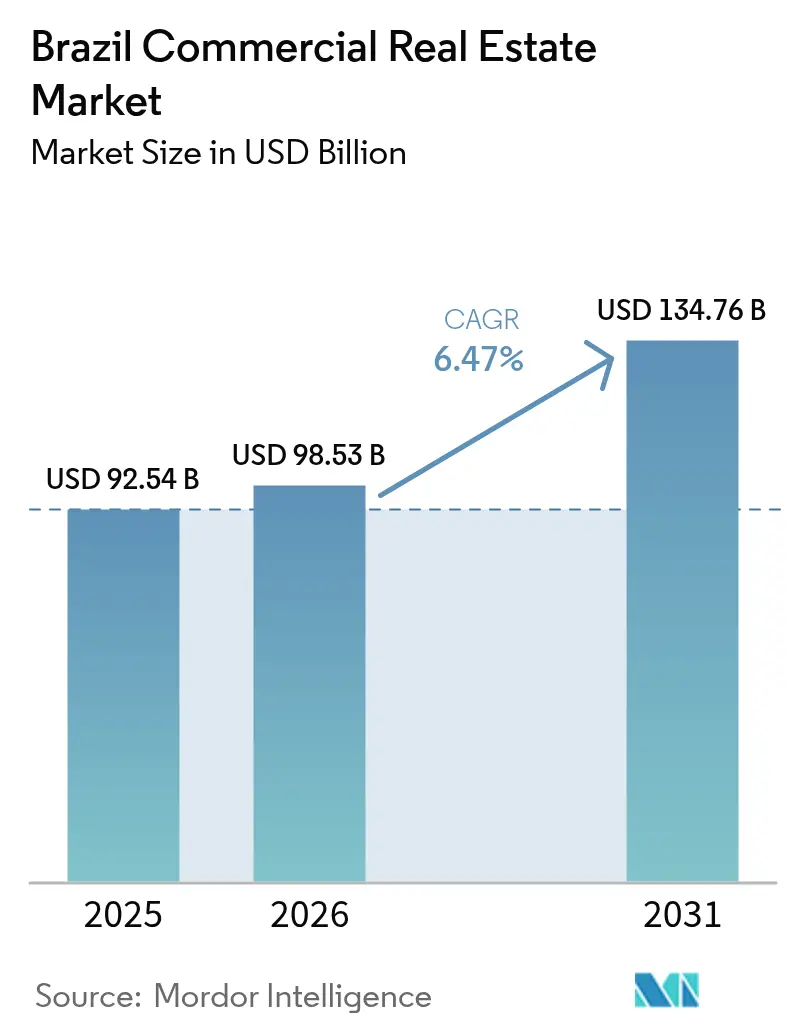
| Base Year Market Size (2025) | USD 92.54 Billion |
| Market Size (2026) | USD 98.53 Billion |
| Market Size (2031) | USD 134.76 Billion |
| Growth Rate (2026 - 2031) | 6.47% CAGR |
| Market Concentration | Medium |
Major Players *Disclaimer: Major Players sorted in no particular order Image © Mordor Intelligence. Reuse requires attribution under CC BY 4.0. | |
Brazil Commercial Real Estate Market Analysis by Mordor Intelligence
The Brazil commercial real estate market size is expected to grow from USD 92.54 billion in 2025 to USD 98.53 billion in 2026 and is forecast to reach USD 134.76 billion by 2031 at 6.47% CAGR over 2026-2031. This steady trajectory reflects deepening institutional capital pools, the rapid scale-up of Brazilian REITs, and public infrastructure concessions that anchor demand in key metropolitan corridors. Grade-A logistics parks along the São Paulo–Rio axis continue to tighten, while LEED-certified office developments gain cost advantages through BNDES green-finance incentives. Corporate occupiers in fintech, cloud services, and consumer staples are driving absorption in São Paulo’s premium sub-markets. Meanwhile, a deceleration in speculative construction, caused by elevated SELIC rates, tempers short-term supply additions yet improves occupancy prospects for completed projects. Brownfield parcels released through port and airport privatizations create new development pipelines that broaden the investable universe beyond traditional urban cores.
Key Report Takeaways
- By geography, São Paulo held 44.78% of Brazil Commercial Real Estate market share in 2025. The Brazil Commercial Real Estate market for the Rest of Brazil is forecast to record 7.28% CAGR between 2026-2031.
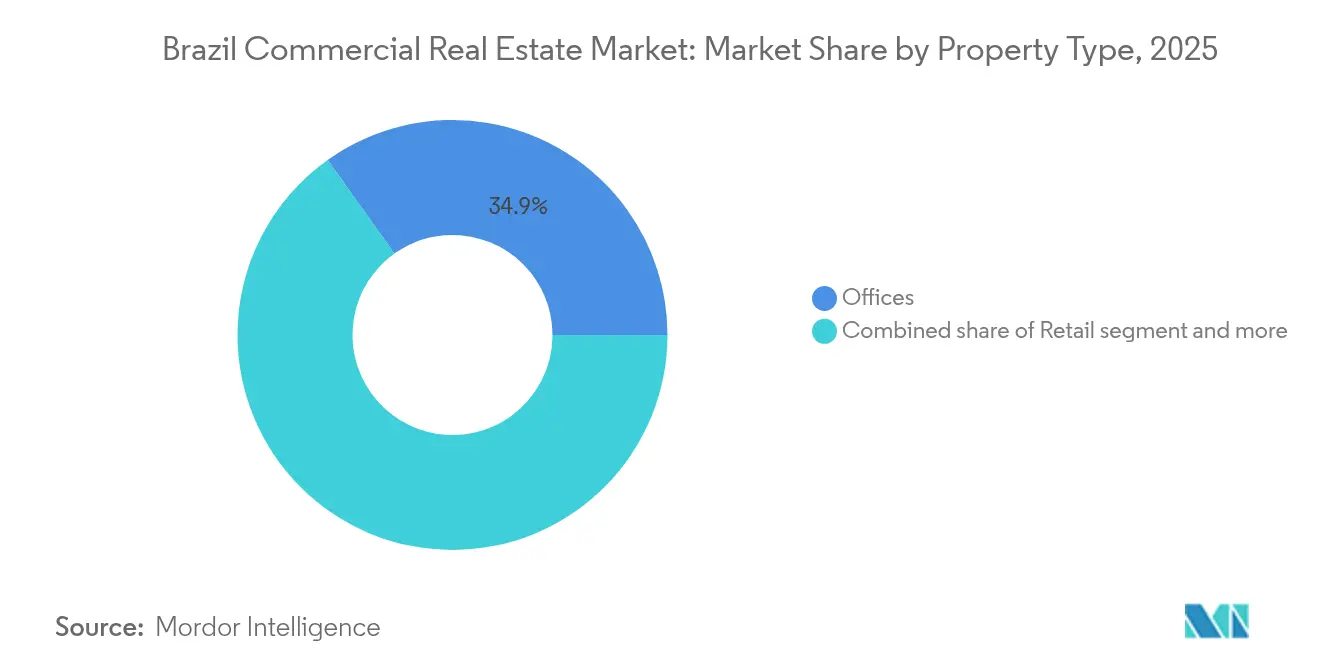
- By property type, offices led with 34.86% of the Brazil Commercial Real Estate market revenue share in 2025. The Brazil Commercial Real Estate market for logistics properties is projected to advance at a 7.69% CAGR between 2026-2031.
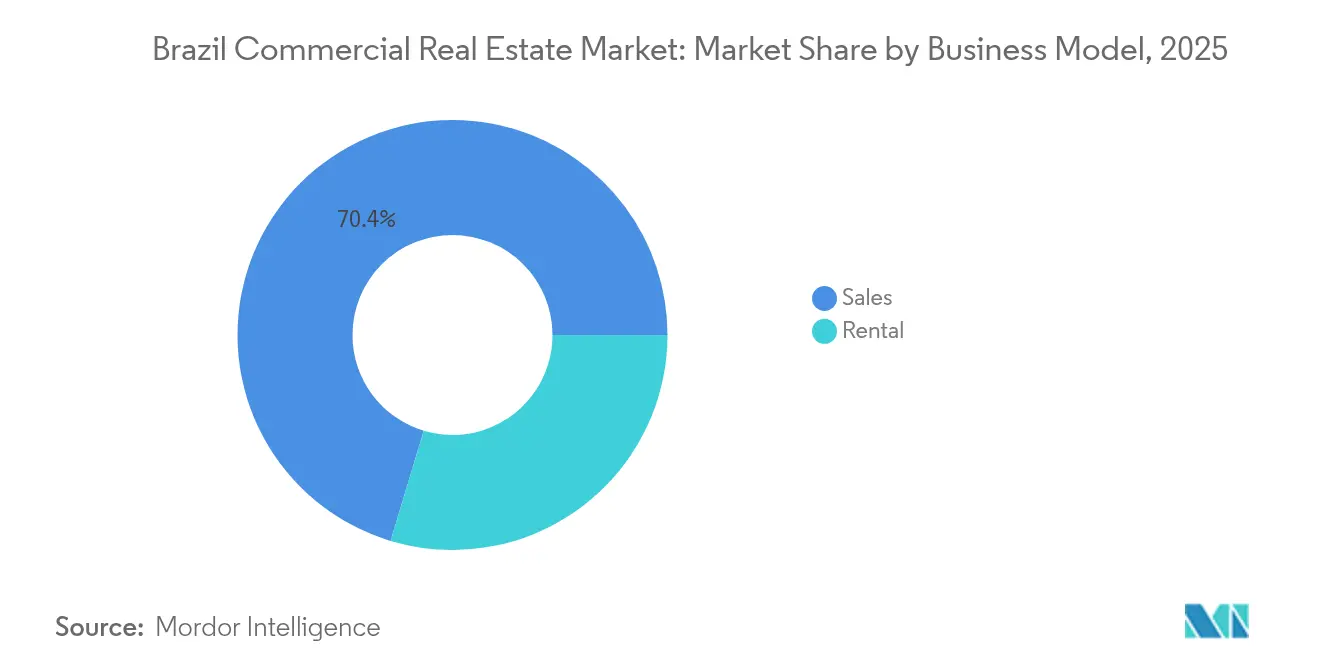
- By business model, sales transactions accounted for 70.35% share of the Brazil Commercial Real Estate market size in 2025. The Brazil Commercial Real Estate market for rental operations is expanding at a 6.94% CAGR between 2026-2031.
- By end user, corporates and SMEs commanded 75.48% of the Brazil Commercial Real Estate market share in 2025. The Brazil Commercial Real Estate market for the individual and household segment is set to grow at a 7.18% CAGR between 2026-2031.
Note: Market size and forecast figures in this report are generated using Mordor Intelligence’s proprietary estimation framework, updated with the latest available data and insights as of 2026.
Brazil Commercial Real Estate Market Trends and Insights
Drivers Impact Analysis*
| Driver | ( ~ ) % Impact on CAGR Forecast | Geographic Relevance | Impact Timeline |
|---|---|---|---|
| Near-shoring-led demand spike for Grade-A logistics parks along the São Paulo–Rio corridor | +1.2% | São Paulo metropolitan area, Rio de Janeiro corridor | Medium term (2-4 years) |
| BNDES-subsidized green finance accelerating LEED-certified office developments | +0.8% | National, concentrated in São Paulo and Rio de Janeiro | Long term (≥ 4 years) |
| Expansion of FIIs (Brazilian REITs) deepening institutional capital pool | +1.1% | National with emphasis on São Paulo and secondary metros | Medium term (2-4 years) |
| Fintech and cloud-services boom fueling prime office absorption in Paulista and Faria Lima | +0.7% | São Paulo financial districts | Short term (≤ 2 years) |
| Airport and port privatization unlocking brownfield commercial parcels | +0.6% | National, early gains in São Paulo, Rio de Janeiro, Salvador | Long term (≥ 4 years) |
| On-shoring of data centers driving special-purpose industrial campuses | +0.9% | São Paulo, Rio de Janeiro, emerging Northeast | Medium term (2-4 years) |
| Source: Mordor Intelligence | |||
Near-shoring led demand spike for Grade-A logistics parks along the São Paulo–Rio corridor
In 2024, net effective rents for Class-A distribution facilities in the São Paulo–Rio corridor rose by 15%, reflecting its position as the region's premier logistics hub. Vacancy rates dropped to 9.3% as operators pivoted towards near-shoring and last-mile models. New deliveries faced hurdles from power-grid capacity issues and intricate permitting processes. Consequently, demand has shifted towards emerging nodes like Castelo and Raposo. Developers are now diversifying their sites, aiming to harness the near-shoring boom while navigating infrastructure challenges. This evolving landscape not only tightens occupancy rates but also boosts achievable rents, ensuring steady cash flows for funds focused on logistics.
BNDES subsidized green finance accelerating LEED-certified office developments
BNDES is increasingly directing funds towards sustainable projects, particularly those focused on reducing costs for LEED-oriented buildings[1]Banco Nacional de Desenvolvimento Econômico e Social, “BNDES Disbursement Report 2023,” bndes.gov.br . Mapping by the IFC reveals that 55 municipalities have begun offering tax incentives to promote green construction[2]International Finance Corporation, “Green Buildings Market Intelligence Brazil,” ifc.org. Legislation passed in November 2024, concerning infrastructure debentures, enhances access to capital with zero withholding tax, drawing developers closer to ESG-focused investors. With federal incentives, local tax breaks, and a global capital push for tangible sustainability results, LEED-certified assets are becoming prime targets for long-term leasing demand.
Expansion of FIIs (Foreign Institutional Investors) deepening institutional capital pool
Brazil’s listed REIT universe grew from BRL 20 billion (USD 3.60 billion) in 2014 to BRL 168 billion (USD 30.23 billion) in 2024, lifted the count of listed funds to 534. Mortgage REITs hold 40% of net asset value, indicating a structural pivot toward income-focused debt portfolios. Proposed regulation to base dividend distributions on accounting profit could stabilize cash flows and attract cross-border pension allocations. The step-up in minimum shareholder count creates scale thresholds that encourage consolidation, improve liquidity, and standardize reporting quality.
Fintech and cloud-services boom fueling prime office absorption in Paulista & Faria Lima
Gross absorption in São Paulo’s Grade-A office stock exceeded 520,000 m² in 2024, the strongest annual take-up in ten years. Vacancy trended down to 17.35%, while average asking rents reached BRL 131.50 (USD 23.66) per m² per month. Technology and financial tenants drove more than half the leasing volume in sub-markets such as Rebouças, Marginal Pinheiros, and Faria Lima. Pipeline deliveries of 250,000 m² in 2025 aim to meet persistent demand for resilient infrastructure, flexible layouts, and sustainability certifications.
Restraints Impact Analysis*
| Restraint | ( ~ ) % Impact on CAGR Forecast | Geographic Relevance | Impact Timeline |
|---|---|---|---|
| Persistently high SELIC rates curtailing speculative developments | -1.8% | National, stronger drag in São Paulo and Rio de Janeiro | Short term (≤ 2 years) |
| FX volatility limiting foreign capital allocation | -1.1% | National, sharper impact in international gateway cities | Medium term (2-4 years) |
| Structural vacancy in Rio CBD depressing office rents | -0.7% | Rio de Janeiro CBD | Medium term (2-4 years) |
| Restrictive heritage-zone zoning slowing permit cycle | -0.4% | São Paulo and Rio historic districts | Long term (≥ 4 years) |
| Source: Mordor Intelligence | |||
Persistently high SELIC rates curtailing speculative developments
The Brazilian Association of Real Estate Credit and Savings Entities forecasts a 17% decline in SBPE-funded mortgages during 2025 amid a tighter monetary stance[3]Associação Brasileira das Entidades de Crédito Imobiliário e Poupança, “Projeções para o Crédito Imobiliário 2025,” abecip.org.br. BNP Paribas projects the SELIC to peak at 14.75% by mid-2025, increasing debt costs for capital-intensive projects. Developers pivot to pre-sold or institutionally backed ventures, while well-capitalized investors monitor distressed opportunities triggered by tighter bank covenants. The rate environment prioritizes projects with pre-leasing or government support, filtering speculative activity across major metros.
Structural vacancy in Rio CBD depressing office rents
Rio de Janeiro’s CBD carries a 30.9% vacancy rate, almost double São Paulo’s, which compresses achievable rents to USD 17.73 per m² and limits near-term new starts. The decline in oil headquarters and public-sector downsizing reshaped demand patterns. While logistics assets within the metropolitan belt record rent growth, CBD offices await conversion or redevelopment that aligns with mixed-use or hospitality formats. Investors with long-dated horizons target discounted assets positioned near transit or waterfront regeneration plans.
*Our forecasts treat driver/restraint impacts as directional, not additive. The impact forecasts reflect baseline growth, mix effects, and variable interactions.
Segment Analysis
By Property Type: Logistics Drives Growth Despite Office Dominance
The office segment accounted for 34.86% of Brazil commercial real estate market share in 2025, underscoring its entrenched position in corporate location strategies. Logistics assets, however, exhibit the fastest trajectory, expanding at a 7.69% CAGR to 2031 as online retail penetration, just-in-time inventory models, and near-shoring elevate national warehouse demand. Prime logistics parks surrounding São Paulo and Rio capture spillover from port privatizations and manufacturing relocations. Grade-A facilities command premium rents, support less than 10% vacancy, and meet growing requirements for ESG compliance. Retail properties show stable occupancy in top-tier malls managed by operators such as Multiplan, yet high-street formats continue to rationalize footprints as digital channels scale. Industrial campuses geared to data center activity are receiving sizeable commitments, including a USD 500 million initial phase for Latin America’s largest hub in Eldorado do Sul. Hospitality and mixed-use projects benefit from the tourism rebound and improved airlift capacity following airport concessions.
Logistics’ long-run outperformance signals a shift in tenant priorities toward fulfillment speed, temperature-controlled design, and renewable-energy integration. Developers employ build-to-suit contracts with e-commerce and 3PL tenants to secure long leases while sidestepping speculative risk. In parallel, the office pipeline integrates touch-free systems, greater daylighting, and modular fit-outs to satisfy hybrid workforce expectations. The Brazil commercial real estate market size allocated to logistics is forecast to expand at 8% of total stock by 2030, compared with 6% in 2024. Office landlords enhance competitiveness by repositioning legacy assets through green retrofits funded by low-cost BNDES credit. Retail players reverse cyclical exposure by layering experiential concepts such as fine dining and health services that extend dwell times and support rent sustainability.


By Business Model: Sales Dominance Shifts Toward Rental Growth
Sales transactions comprised 70.35% of the Brazil commercial real estate market size in 2025, reflecting a longstanding preference for direct ownership that is reinforced by tax deductibility of mortgage interest and favorable capital-gains treatment. Yet rental-oriented strategies record a 6.94% CAGR, outpacing headline sector growth as institutional investors scale up FIIs dedicated to stabilized income streams. Pension funds and insurers diversify away from fixed income by purchasing partial stakes in core logistics and office portfolios. The PREVI pension fund’s 90% stake in Prologis CCP Cajamar Industrial Park signals a turning point in domestic institutional appetite for yield-accretive logistics stock.
Developers adjust by structuring build-to-rent platforms, extending tenant-improvement packages, and leveraging proptech for predictive maintenance. REIT consolidation raises transparency and lowers trading spreads, which improves liquidity for foreign participants. A gradual reduction in SELIC is expected to escalate refinance activity, freeing further capital for rental expansion. Over the forecast horizon, rental products could account for one-third of Brazil's commercial real estate market transactions, signalling a portfolio shift toward cash-flow resilience.
By End User: Corporate Demand Leads Individual Growth Acceleration
Corporate and SME occupiers sustained 75.48% of total demand in 2025, anchored by fintech, agribusiness, and consumer goods multinationals that expanded footprints in core and secondary metros. Workspace strategies now prioritize energy-efficient design, smart building systems, and proximity to multimodal hubs. Individuals and households, while smaller at present, represent the fastest-growing segment with a 7.18% CAGR. Government programs such as the expanded Minha Casa, Minha Vida widen eligibility to families earning up to BRL 12,000 (USD 2159.21) and encourage retail participation in real estate mutual funds.
Democratization of investment-grade real estate through fractional share apps and lower entry barriers in public FIIs allows emerging middle-class investors to gain exposure to stabilized shopping centers and warehouses. SME leasing volumes pick up as BNDES lines re-open post-pandemic, facilitating the purchase of light-industrial condos outside São Paulo’s ring road. Over time, the blended demand profile enhances depth and liquidity, reducing vacancy risk for multi-tenant assets.
Geography Analysis
The Brazil commercial real estate market remains anchored in São Paulo, which captured 44.78% of revenue in 2025 and posted record office absorption above 520,000 m² during 2024. Average asking rents climbed to BRL 131.50 (USD 23.66) per m² per month and vacancy eased to 17.35%, supported by high take-up in Paulista, Faria Lima, and Chucri Zaidan. Logistics clusters migrated westward to Castelo and Raposo as land in Cajamar and Guarulhos tightened. Port privatizations at Santos bolster throughput, enhancing the city’s role as a distribution nucleus.
Rio de Janeiro’s CBD vacancy of 30.9% underlines lingering supply-demand imbalances, yet logistics assets within Greater Rio match São Paulo’s 15% rent growth, reflecting robust e-commerce activity. Hospitality investors revisit beachfront locations as tourism recovers. Brownfield plots released through Galeão Airport’s concession entice mixed-use proposals, though office recovery remains slow until excess inventory clears.
The rest of Brazil is forecast to expand at a 7.28% CAGR, signalling a structural decentralization of growth. Federal initiatives under the New Growth Acceleration Programme fund 2,000 infrastructure projects that extend rail and road corridors into agribusiness-rich Mato Grosso and the Northeast. Cement consumption in the Southeast and Northeast climbed 5.4% year-on-year in January 2025, corroborating elevated construction activity. Mid-sized cities benefit from lower land costs, streamlined permit processes, and incentives offered by local governments eager to attract logistics hubs and data-center campuses. Secondary nodes such as Campinas, Goiânia, and Recife gain traction as occupiers widen site-selection criteria beyond the São Paulo–Rio conurbation.
Regulatory Landscape
Brazil's commercial real estate is shaped by securities-market rules for listed real estate funds and by federal-to-municipal requirements covering development approvals and building compliance. In April 2026, Comissao de Valores Mobiliarios (CVM) issued Circular Letter CVM/SSE 2/2026 to guide mandatory structured quarterly reporting for FIIs holding exposure to CRIs, tightening disclosure and standardizing data fields for fund administrators and, in turn, increasing reporting discipline for underlying property and receivables portfolios.
On the development and urban-policy side, the Ministerio das Cidades continued to refine program and execution rules through ordinances. This included Portaria MCID No. 827 (July 2025) adjusting requirements and submission deadlines under Minha Casa, Minha Vida, and Portaria MCID No. 328 (March 2026) updating procedures and deadlines tied to 2026 budget execution for state bench amendments and committee projects. Separately, the federal Construa Brasil program under MDIC has published good-practice guides (updated materials in 2024) to harmonize municipal building codes and streamline construction-permit processes, affecting approval timelines and compliance costs for commercial and mixed-use projects.
Value Chain Analysis
Brazil's commercial real estate value chain starts with land sourcing and structuring (developers and investors), moves through financing (banks, FIIs, CRIs, and other capital-market instruments), and then into design and construction (contractors and specialist subcontractors). It continues with leasing and sales execution (brokers), operations (property and facilities management), and transactional services such as valuation, legal, and registry.
Institutionalization is increasingly supported by FIIs, and CVM reporting requirements for FIIs with CRI exposure add process rigor around asset-level information flows between originators, fund administrators, and investors. On the supply side, contractors and material suppliers are also drawing more closely on contech and open-innovation initiatives supported by industry bodies such as CBIC and Sebrae, while larger developers run proprietary innovation programs. Project feasibility still hinges on physical constraints in key logistics corridors, particularly access, power availability, and permitting. This upstream-to-downstream linkage shows up in recent in-country capacity additions, including Goodman’s construction of a 60,000 m2 last-mile logistics center in Santo Andre (SP), reported as a R$360 million investment in July 2025, and Multilog’s start of a new dry port in Foz do Iguacu, reported as a R$500 million investment in August 2025, supporting cross-border logistics flows that feed warehouse demand and tenant absorption.
Competitive Landscape
The Brazil commercial real estate market is moderately fragmented, highlighting a competitive environment with a diverse range of players. Global operators Prologis and Goodman dominate Brazil's logistics holdings, boasting a combined AUM of over USD 90 billion and an impressive average portfolio occupancy of 99%. Domestic players Cyrela, BR Properties, and LOG Commercial Properties command scale in office, retail, and light-industrial verticals. Shopping-center operators Multiplan and Iguatemi leverage curated luxury tenant mixes that shield rent rolls from pure-play e-commerce substitution. JHSF Participações integrates development, property management, and private aviation services, illustrating a vertically aligned strategy that locks in diversified revenues.
Proptech adoption accelerates portfolio efficiency: IoT sensors monitor energy loads, AI-driven leasing algorithms target high-probability tenants, and blockchain pilots streamline fractional ownership transfers. ESG differentiation is a decisive factor in capital allocation; funds benchmark carbon footprints, install rooftop photovoltaics, and certify through EDGE or LEED programs to unlock cheaper green loans. The market favors balance-sheet strength as restrictive rates elevate interest-coverage thresholds. Asset trades increasingly occur via forward-purchase agreements that mitigate construction risk while preserving upside on completion.
Strategic moves underscore consolidation and specialization. Goodman initiated a multi-asset JV focused on cold-chain facilities serving Brazil’s agrifood exports. Multiplan allocated BRL 1.5 billion (USD 0.27 billion) to seven retail expansions that emphasize high-margin gourmet dining, while Iguatemi stakes BRL 236 million (USD 42.46 million) in premium floorplate extensions to anchor global luxury brands. Scala Data Centers progresses on a USD 500 million first phase in Eldorado do Sul that aims to tap hyperscale cloud requirements and drive industrial land absorption.
Brazil Commercial Real Estate Industry Leaders
Cyrela Commercial Properties S.A.
LOG Commercial Properties
Multiplan
BR Properties
Aliansce Sonae
- *Disclaimer: Major Players sorted in no particular order

Market Opportunities and Future Outlook
A clear opportunity is emerging in income-focused, institutionally held assets where transparency, reporting cadence, and liquidity are improving through Brazil's FII ecosystem and CVM standardization. The shift to the new tax system beginning in 2026 under Complementary Law No. 214/2025 adds near-term modeling and compliance work for developers, landlords, and fund vehicles, which creates room for advisory, structuring, and asset-management platforms to reprice leases and operating models under the IBS/CBS transition.
Opportunity also shows up in logistics and mixed-use formats tied to concessions and mobility projects. In May 2026, the federal concessions pipeline was presented at R$327.5 billion in potential investments for transport corridors (railways and highways), expanding the set of developable nodes beyond traditional urban cores and supporting distribution-led site selection near upgraded links. Leasing activity is also visible in commercial rent data: in May 2026, FipeZap cited a 1.48% monthly increase in commercial rents (the highest monthly rise since April 2012) and a 10.60% cumulative increase over the prior 12 months, reinforcing demand for well-located, operationally efficient properties where tenants absorb costs through productivity and location advantages. Execution is increasingly tied to digitalization, with CBIC’s ENIC 2026 programming on AI and BIM alongside reported evidence that 56.5% of developers use AI (June 2026), supporting proptech-enabled cost control, faster delivery cycles, and building-operations optimization across offices, logistics parks, and retail centers.
Recent Industry Developments
- July 2026: Multiplan sold three plots of land adjacent to ParkJacarepaguá, ParkShoppingCampoGrande, and ParkShopping Canoas for mixed-use development by local entrepreneurs. The transactions recycle capital from non-core adjacent land while advancing a mixed-use ecosystem around existing malls. The sale supports densification strategies that can lift footfall and diversify income streams beyond pure retail leasing.
- May 2026: LOG Commercial Properties concluded the sale of a logistics portfolio of 11 operational assets totaling 332,851 square meters for over R$1 billion to the Itau Log CP real estate investment fund. The disposal represents a major asset-recycling event in the logistics segment, with stabilized warehouses transferred into an income vehicle. Proceeds strengthen LOG's ability to fund its development pipeline and reshape portfolio duration toward higher-return projects.
- September 2024: Scala Data Centers committed USD 500 million to develop Scala AI City in Eldorado do Sul, positioned as a large-scale data-center complex. The investment anchors demand for special-purpose industrial campuses with high power and connectivity requirements. It also broadens commercial real estate activity into data-center driven land absorption and supporting logistics and services around hyperscale infrastructure.


Research Methodology Framework and Report Scope
Market Definition and Coverage
For this methodology, the Brazil commercial real estate market is treated as the yearly value of income-producing commercial properties located in Brazil that are sold, leased, or held for rental income, across major asset types used by businesses and institutions.
Scope exclusions: We exclude land banking, single-family housing, and properties primarily used for farming or mining, even if they may be traded as land parcels.
Segmentation Overview
- By Property Type
- Offices
- Retail
- Logistics
- Others (Industrial, Hospitality, etc.)
- By Business Model
- Sales
- Rental
- By End-user
- Individuals / Households
- Corporates & SMEs
- Others
- Key Cities
- São Paulo
- Rio de Janeiro
- Rest of Brazil
Data Sources, Market Sizing, and Validation
Desk Research
Desk research starts by mapping demand and supply signals for offices, retail space, industrial and logistics sites, hospitality assets, and other income-producing formats that are commonly tracked in Brazil. We relied on public and official sources such as IBGE (economic activity, services, and construction indicators), Banco Central do Brasil (interest rate, credit, and macro series), CVM (fund and issuer filings), and SECEX trade statistics from MDIC to understand freight-linked and industrial corridor activity.
To add property-market context, we also reviewed public releases and market notes from industry associations and exchanges where relevant, along with company reports such as annual reports, investor presentations, and official press releases for portfolio and pipeline updates. A paid subscription used for company financials and news helped with cross-checking event timing and financial consistency, and an import-export shipment-level database was used selectively to sanity-check logistics demand signals. The sources listed above are illustrative only, and many other public references were also used to collect, verify, and clarify data points.
Primary Interviews and Surveys
Primary interviews and surveys were used to pressure-test the desk assumptions on rent resets, vacancy and absorption, cap rate direction, and the pace of new supply delivery in Brazil. We spoke with owners and asset managers, developers, lenders, leasing and brokerage professionals, and large occupiers so the final model reflects real contracting behavior, not only announced plans.
Distribution of primary research fieldwork respondents
| Company type | Respondent position | Region |
|---|---|---|
| Top tier: 37% | CXOs: 15% | |
| Mid tier: 47% | Functional/Unit leaders: 31% | |
| Smaller Players: 16% | Managers: 54% |
Market-Sizing & Forecasting
Sizing is built using top-down and bottom-up approach, where macro, credit, and investment signals are first converted into an implied annual transaction value for income-producing assets in Brazil, and then cross-checked with asset-level reality checks. On the top-down side, we used indicators such as Selic rate direction, inflation and rent indexation behavior, vacancy and net absorption in major cities, construction starts and completions, and listed real estate vehicle activity as practical inputs that move pricing and deal volumes.
After the total is formed, selective bottom-up approximations are used to validate and fine-tune it, such as sampled transaction values by property type, typical rent per square meter combined with occupied area logic, and channel checks on cap rate movement and leasing incentives. Where a city or sub-market has thinner public visibility, gaps are handled using conservative proxy relationships like linking stock growth to completion pipelines, then confirming the direction with expert feedback. For forecasting, we use scenario analysis so interest-rate paths, leasing recovery speed, and pipeline delivery timing can be varied, and then filter them through what market participants expect for occupancy, rents, and investor risk appetite.
Data Validation & Update Cycle
Validation is done in layers so that one unusual input does not distort the final number. We compare model outputs with independent market signals such as vacancy movement, absorption direction, publicly discussed investment volumes, and macro shifts that typically change cap rates, then review large variances before sign-off.
Each key assumption is checked across more than one analyst pass, and re-contact is triggered when a driver changes sharply, such as a sudden rate move, a credit tightening signal, or a clear shift in development activity. Reports are refreshed annually, with interim updates when material events affect pricing, demand, or supply. Before delivery, a final current-events sweep is completed so the latest available data is reflected.
Mordor Intelligence's Brazil Commercial Real Estate Market Size Compared Against Other Published Estimates
Published market sizes for Brazil commercial real estate can look far apart because the word market is not always measured the same way, and the timing of currency conversion can move the USD value even when local pricing is stable. Differences also come from what is counted as commercial activity, such as whether multifamily is included, and whether land-only trades or rural and resource-linked properties are mixed into the total.
A refresh-led lens explains much of the spread, because FX timing, rent indexation choices, and late-year deal capture can shift the number quickly. When exchange rates are updated on a different schedule, and when rent and vacancy checks are not re-run close to publication, the range widens, which is why the annual refresh and revalidation cadence applied in the Mordor Intelligence model can land at a different level than broader, less frequently rechecked transaction pools.
Benchmark comparison
| Source | Market Size | Gaps in Research Methodology |
|---|---|---|
| Mordor Intelligence | USD 92.54 B (2025) | |
| Syndicated Publisher A | USD 63.67 B (2024) | Uses a different start year and a transaction-value framing that can blend in non-comparable real estate activity, which changes the total when matched to an income-producing commercial scope. |
| Syndicated Publisher B | USD 266.80 B (2025) | Applies a broader aggregation across property categories and geography groupings, and the resulting USD figure can also shift based on how price growth and currency conversion timing are applied through the year. |
Taken together, the comparison points to three practical drivers, which are scope boundaries, the timing of USD conversion, and how rent and vacancy are used to keep pricing logic realistic. By keeping the inputs tied to observable demand and supply signals and by rechecking key assumptions before release, we aim to provide a number that is traceable and repeatable.


Key Questions Answered in the Report
What is the current size of the Brazil commercial real estate market?
The Brazil commercial real estate market size stands at USD 98.53 billion in 2026 and is forecast to reach USD 134.76 billion by 2031.
Which property type is growing the fastest?
Logistics properties post the highest growth, expanding at a 7.69% CAGR driven by e-commerce fulfilment and near-shoring demand.
Why are rental models gaining traction?
Institutional investors favor predictable income from Brazilian REITs, resulting in rental operations advancing at a 6.94% CAGR compared with slower growth in sales transactions.
How dominant is São Paulo in national commercial real estate?
São Paulo holds 44.78% of Brazil commercial real estate market share, supported by robust office absorption and high logistics demand.
What macro headwinds could affect market growth?
Elevated SELIC rates and currency volatility raise financing costs and temper speculative development, especially in capital-intensive projects.
Which sustainability incentives matter most for developers?
Low-cost BNDES green loans and municipal tax breaks for LEED-certified buildings reduce funding costs and align assets with global ESG capital pools.
Page last updated on:


