Market Overview
| Study Period | 2020 - 2031 |
|---|---|
| Forecast Data Period | 2026 - 2031 |
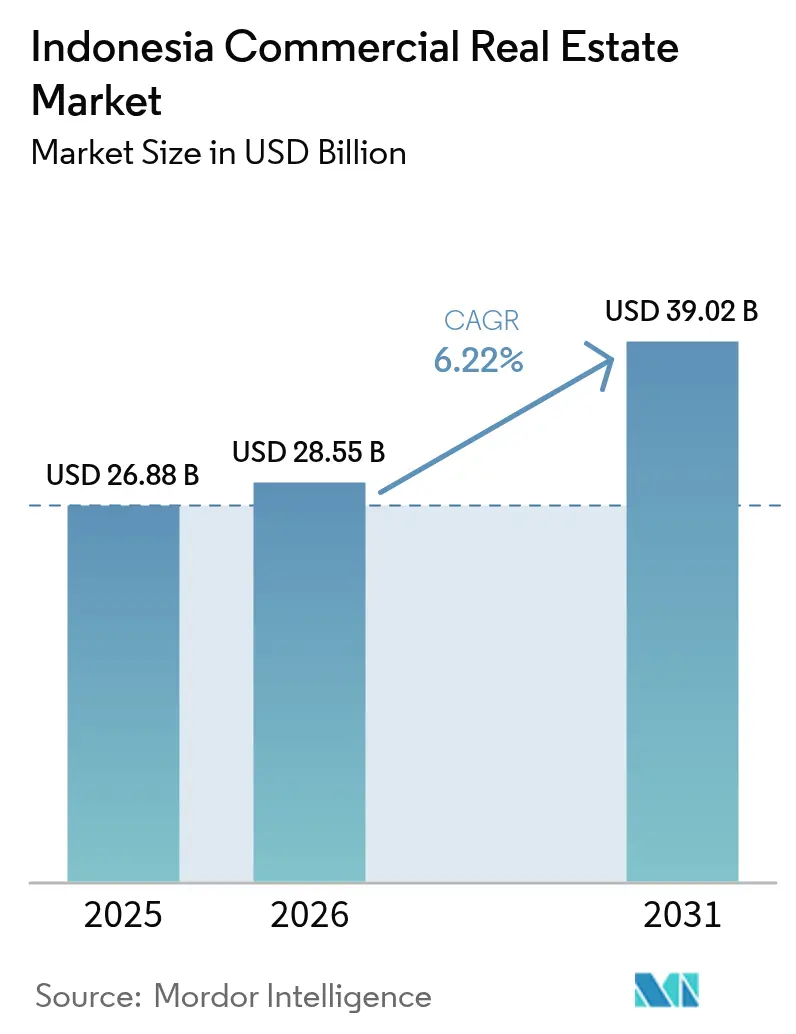
| Base Year Market Size (2025) | USD 26.88 Billion |
| Market Size (2026) | USD 28.55 Billion |
| Market Size (2031) | USD 39.02 Billion |
| Growth Rate (2026 - 2031) | 6.22% CAGR |
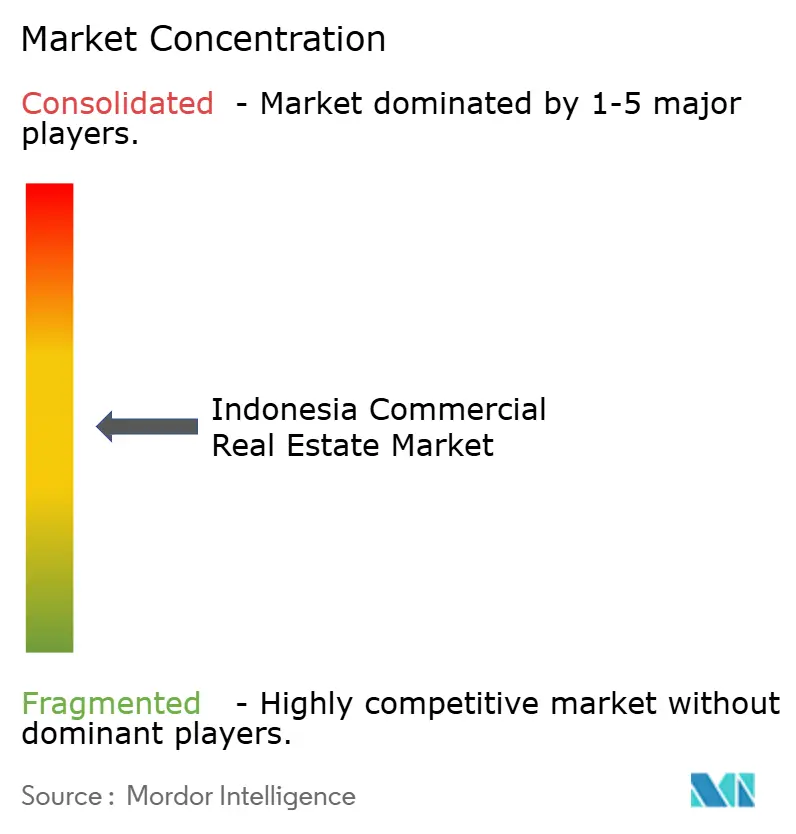
| Market Concentration | Medium |
Major Players *Disclaimer: Major Players sorted in no particular order Image © Mordor Intelligence. Reuse requires attribution under CC BY 4.0. | |
Indonesia Commercial Real Estate Market Analysis by Mordor Intelligence
The Indonesia commercial real estate market size is projected to expand from USD 26.88 billion in 2025 and USD 28.55 billion in 2026 to USD 39.02 billion by 2031, registering a CAGR of 6.22% between 2026 and 2031[1]Gayatri Suroyo, “Indonesia Cuts Nusantara Budget for 2025,” Reuters, reuters.com. Demand is rotating toward logistics warehouses, hyperscale data-center campuses, and mixed-use projects linked to the Nusantara capital relocation, while traditional Grade-A offices in Jakarta face double-digit vacancy. Developers are responding by converting underused towers into flexible workplaces, pursuing EDGE or LEED certifications to secure rental premiums, and partnering with energy providers to guarantee power resilience for digital-infrastructure tenants. Investment momentum is strongest along new toll-road corridors and in secondary cities where land remains inexpensive but accessibility has improved. Capital-market liquidity favors sale-leaseback and REIT structures that let sponsors recycle equity quickly into growth assets.
Key Report Takeaways
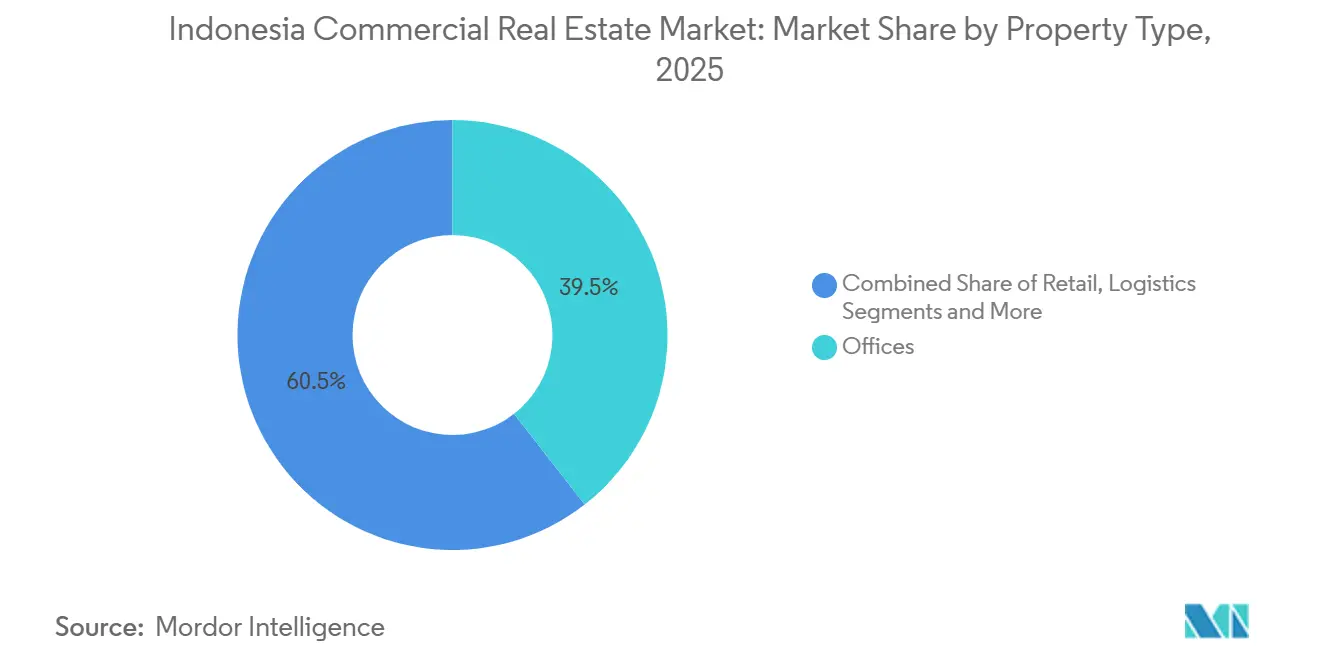
- By property type, offices led with 39.45% of Indonesia commercial real estate market share in 2025, while logistics is forecast to expand at a 9.12% CAGR through 2031.
- By business model, rentals accounted for 62.00% of the Indonesia commercial real estate market size in 2025 and are projected to grow at a 7.20% CAGR between 2026 and 2031.
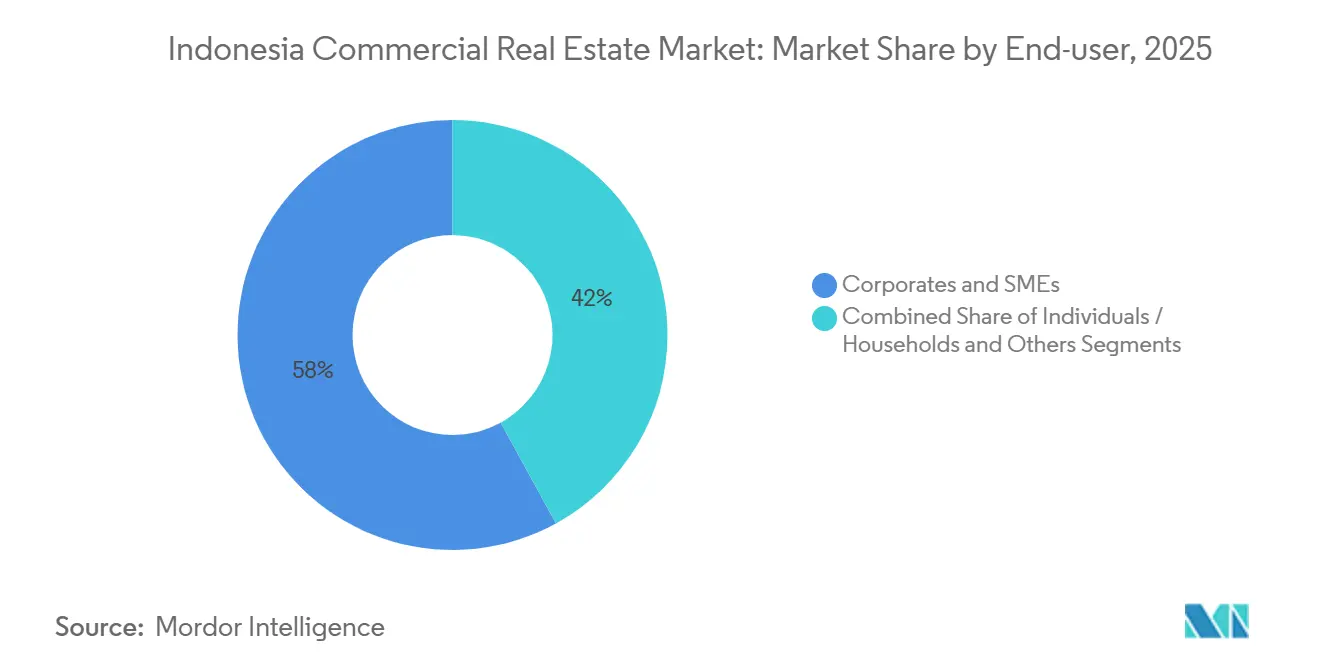
- By end-user, corporates and SMEs held 58.00% of the Indonesia commercial real estate market share in 2025; e-commerce 3PLs represent the fastest-growing cohort at a 9.88% CAGR to 2031.
- By geography, Jakarta retained 25.20% of the Indonesia commercial real estate market in 2025, whereas Rest of Indonesia is poised to advance at an 11.22% CAGR through 2031.
Note: Market size and forecast figures in this report are generated using Mordor Intelligence’s proprietary estimation framework, updated with the latest available data and insights as of 2026.
Indonesia Commercial Real Estate Market Trends and Insights
Drivers Impact Analysis*
| Driver | (%) Impact on CAGR Forecast | Geographic Relevance | Impact Timeline |
|---|---|---|---|
| Expansion of e-commerce and 3PL fueling logistics and warehouse uptake | +1.2% | Jakarta, Surabaya, Batam | Short term (≤ 2 years) |
| Surging demand for hyperscale data-center campuses and edge facilities | +1.1% | Greater Jakarta, Batam, Surabaya | Short term (≤ 2 years) |
| Connectivity megaprojects unlocking peripheral land banks | +0.9% | Trans-Sumatra, Trans-Java, Sulawesi | Long term (≥ 4 years) |
| Relocation of national capital to Nusantara catalyzing office and mixed-use development | +0.8% | East Kalimantan, Balikpapan, Samarinda | Medium term (2–4 years) |
| Cold-chain and flexible manufacturing growth in secondary cities boosting specialized parks | +0.6% | Semarang, Medan, Makassar, Karawang | Long term (≥ 4 years) |
| Stricter municipal green-building codes driving retrofit and premium-rent opportunities | +0.5% | Jakarta, Surabaya, Bandung | Medium term (2–4 years) |
| Source: Mordor Intelligence | |||
Relocation of National Capital to Nusantara Catalyzing Office and Mixed-Use Development
Government ministries plan to begin phased moves into Nusantara during late 2026, anchoring a pipeline of purpose-built Grade-A offices, hotels, and civic amenities[2]Indonesian Data Center Association, “Pipeline Report 2025,” idca.or.id . Land acquisition inside the 256,000-hectare core accelerated in early 2025, with leading developers locking in parcels at discounts that should crystallize once supporting ports and power grids are delivered. Pre-leasing reached 18% of planned inventory by December 2025, signaling cautious but real tenant commitment. Jakarta landlords are reacting by converting partially vacant floors into coworking suites to offset outflows. Taken together, the two cities will operate as a dual-hub system that increases total national office demand over the medium term.
Expansion of E-Commerce and 3PL Fueling Logistics and Warehouse Uptake
Indonesia’s online-shopping GMV topped USD 77 billion in 2025, pushing 3PLs to add high-throughput cross-docks and city-edge fulfillment centers within two-day trucking distance of 200 million consumers. Average warehouse lease tenures now span 5-7 years, twice office norms, giving landlords predictable cash flows. Automated sortation hubs announced by SiCepat alone will raise national Grade-A logistics stock by nearly 450,000 m² before 2027. Cold-chain footprints are expanding fastest, and facilities with pharma-grade temperature control secure up to 30% rent premiums over ambient space. Accelerated customs clearance, cut to 48 hours in 2024, further incentivizes merchants to keep inventory onshore rather than in Singapore.
Connectivity Megaprojects Unlocking Peripheral Land Banks
The Medan–Binjai toll road slashed travel to Belawan Port from 90 minutes to 35 minutes after its March 2025 opening. Similar upgrades along the 2,700 km Trans-Sumatra corridor are bringing undeveloped plots into the investment calculus of logistics, food processing, and light-manufacturing companies. Land prices near new interchanges jumped 40-60% between 2024 and early 2026 yet remain far below those inside Jabodetabek, creating an attractive arbitrage. PPP structures grant road-building consortia first rights to adjacent commercial lots, blurring the line between infrastructure contractor and property developer. Over the long term, every billion dollars spent on roads is forecast to unlock more than twice that amount in follow-on real-estate value.
REIT Tax Incentives Accelerating Institutional Investment Flows
Total Jakarta pipeline capacity reached 709 MW by end-2025, up 58% year-on-year, fueled by cloud-service providers and AI workload operators demanding robust power and connectivity. New regulations allow foreign ownership of up to 67% in data-center ventures, accelerating capital inflows. Developers are co-investing in on-site substations and battery-storage arrays that add 15-20% to upfront spend but ensure the 99.95% uptime hyperscalers require. Batam, only 20 km from Singapore’s cable-landings, has emerged as a viable alternative for latency-sensitive computing following DAMAC’s USD 2.3 billion commitment in February 2025. Lease terms of 10–15 years on triple-net bases deliver annuity-style returns uncorrelated with office cycles.
Restraints Impact Analysis*
| Restraint | (%) Impact on CAGR Forecast | Geographic Relevance | Impact Timeline |
|---|---|---|---|
| FX volatility and higher USD funding costs squeezing developer margins | –0.9% | Nationwide, especially Jakarta & Surabaya | Short term (≤ 2 years) |
| Persistently high vacancy and falling effective rents in Jakarta CBD offices | –0.7% | Jakarta CBD, Sudirman, Kuningan | Short term (≤ 2 years) |
| Escalating climate-risk premiums on coastal assets | –0.6% | North Jakarta, Semarang coast, Surabaya | Long term (≥ 4 years) |
| Uncertain funding timeline for Nusantara causing land bubbles & investor hesitancy | –0.4% | East Kalimantan | Medium term (2-4 years) |
| Source: Mordor Intelligence | |||
Persistently High Vacancy and Falling Effective Rents in Jakarta CBD Offices
Grade-A vacancy in Jakarta’s central business district climbed to 23.7% in December 2025, as multinational tenants compressed floorplates in response to hybrid work. Effective rents fell 9% year-on-year once inducements like rent-free periods were netted, eroding landlord yields. Older non-certified towers bear the brunt, prompting owners to repurpose top floors for serviced apartments or coworking spaces. Net absorption of 180,000 m² per year implies the oversupply could persist until 2028. Investors now price a clear premium for green-compliant buildings that consistently post sub-12% vacancies.
FX Volatility and Higher USD Funding Costs Squeezing Developer Margins
The rupiah depreciated 7.3% against the U.S. dollar in 2025, raising debt-service outlays for developers who borrowed in greenbacks while earning rupiah rents. A USD 80 million construction loan at 8.5% interest cost roughly IDR 1.1 billion (USD 71,000) more per month due solely to currency moves[3]Bank Indonesia, “Monetary Policy 2025,” bi.go.id . Bank Indonesia kept its policy rate at 6.00% through early 2026 to defend the currency, but that held local-currency construction finance near 11-12%. Smaller sponsors lacking offshore partners postponed projects or substituted imported finishes with local materials, amplifying quality divergence across new supply.
*Our forecasts treat driver/restraint impacts as directional, not additive. The impact forecasts reflect baseline growth, mix effects, and variable interactions.
Segment Analysis
By Property Type: Logistics Outpaces Traditional Office Dominance
Offices captured 39.45% of the Indonesia commercial real estate market share in 2025, maintaining numerical leadership even as leasing momentum tilts toward logistics parks. The Indonesia commercial real estate market size tied to office stock is stabilizing as owners convert excess floors into data-center shells or serviced workspaces. Logistics facilities, meanwhile, are forecast to grow at a 9.12% CAGR through 2031, lifted by e-commerce, regional trade pacts, and cold-chain mandates. Demand for hyperscale data-center land within industrial estates reveals how digital infrastructure is morphing the traditional industrial category.
Rapid cycle-time requirements have spawned micro-fulfillment “dark stores” embedded in residential districts, blurring lines between retail and logistics. Data-center campuses secure 10–15-year triple-net leases that shift operating risk to tenants, appealing to yield-hungry institutions. Retail footprints, though pressured by online shopping, are reinventing themselves through experiential formats such as food halls and entertainment hubs, which logged footfall-recovery rates above 90% of pre-pandemic levels by late 2025. Hospitality and cold-storage assets under the “Others” label benefit from tourism rebound and pharmaceutical distribution, respectively, providing diversification options for developers traditionally wedded to office pipelines.


By Business Model: Rental Dominance Reflects Capital Preservation
Rentals commanded 62.00% of total Indonesia commercial real estate market value in 2025, reflecting corporate preference for balance-sheet agility amid currency swings. The Indonesia commercial real estate market size attributable to rental cash flows is projected to rise at a 7.20% CAGR through 2031, supported by sale-leaseback deals that let sponsors recycle capital quickly. Multi-national tenants appreciate the optionality to scale space up or down in response to shifting demand or potential Nusantara relocation.
Sales transactions remain anchored in industrial land parcels and strata office floors attractive to high-net-worth individuals chasing inflation hedges. REIT managers deployed more than USD 130 million in November 2024 acquisitions, frequently under sale-leaseback formats that secure 8–9% initial yields and embedded escalations. Credit-worthy 3PL tenants lock in 5- to 7-year triple-net leases, enabling warehousing portfolios to achieve institutional-grade stature once elusive in Indonesia. The model’s success is catalyzing conversations around asset-backed securities tied to long-term logistics rents.
By End-User: E-Commerce 3PLs Redefine Demand Drivers
Corporates and SMEs held 58.00% of Indonesia commercial real estate market share in 2025, spanning finance, professional services, and assembly operations. Yet e-commerce 3PLs are expanding at a 9.88% CAGR through 2031, the strongest momentum among user cohorts, as same-day-delivery expectations take hold. A single 10,000 m² sortation hub can generate eight times the daily truck movements of an equivalent office, compelling landlords to design wider turning radii and 24-hour access.
Individual investors buy small strata retail units mainly in secondary cities where prices remain accessible. Government requirements for regional pharma distribution centers by 2027 are steering public-sector demand into temperature-controlled warehouses in Medan and Makassar. Consequently, segmentation by label—corporate, 3PL, public—offers less predictive value than metrics such as loading-dock capacity, clear height, and power redundancy, nudging valuers toward operational-intensity frameworks rather than simple user categories.
Geography Analysis
Jakarta accounted for 25.20% of Indonesia's commercial real estate market value in 2025, driven by its deep tenant pool and established appraisal benchmarks. Effective rents for Grade-A towers in the Golden Triangle sit 20–30% above those in Surabaya or Bandung, yet vacancy pressure tempers overall revenue growth. The rest of Indonesia is forecast to post the nation’s fastest expansion, advancing at an 11.22% CAGR through 2031 as toll-road projects compress freight times and unlock cheaper land. Batam is emerging as a data-center hot-spot because of its submarine-cable connectivity and proximity to Singapore, exemplified by DAMAC’s USD 2.3 billion campus now under construction.
Surabaya, with its automotive supply chain in nearby Gresik, contributes roughly 12% of national commercial real estate activity. Vacancies stand at 14.3% for top-tier offices, meaningfully tighter than Jakarta, which has attracted back-office hubs for global banks. Bandung and Semarang leverage new Trans-Java segments to become fulfillment nodes for FMCG and apparel, collectively absorbing more than 200,000 m² of warehouse space in 2025. Medan’s cold-chain leasing momentum aligns with North Sumatra’s palm-oil downstreaming policies and export orientation.
Risk-adjusted yields diverge by location: core-Jakarta Grade-A offices transacted at 7.5–8.5% cap rates in 2025, whereas secondary-city stock cleared closer to 10–11% to compensate for thinner buyer pools and longer lease-up. Coastal subsidence adds climate-risk premiums in North Jakarta and Semarang, where insurers charge 15–20% more than inland Bandung or elevated Makassar. Developers active in flood-exposed zones elevate ground floors and install permanent barriers, adding 8–10% to build costs but unlocking broader financing access and tenant confidence.
Competitive Landscape
The leading developers in Indonesia’s commercial real estate market, Sinarmas Land, Agung Podomoro Land, Lippo Karawaci, Ciputra Development, and Summarecon Agung, collectively account for a relatively limited portion of total supply, leaving the market fragmented and competitive. Large integrated township developers often balance multiple asset classes within their portfolios, while smaller and specialized players compete by focusing on faster project execution and niche segments. Meanwhile, proptech platforms such as Pinhome and SpaceStock are shortening leasing cycles by digitizing listings and payment processes, encouraging traditional developers and brokers to adopt similar digital capabilities.
Sustainability has also become a major competitive differentiator. Buildings certified under green standards such as EDGE Certification and LEED increasingly attract stronger tenant interest and stable occupancy levels, even during periods of office oversupply. As environmental performance becomes more important for corporate tenants and investors, some developers that lack the capital to undertake green retrofits are selling assets to sustainability-focused investment funds that can finance energy-efficiency upgrades.
At the same time, the logistics and industrial segment is seeing deeper international collaboration. Partnerships between Indonesian developers and foreign operators particularly from Japan and Singapore are helping expand cold-chain logistics facilities and large-scale distribution parks while introducing advanced automation and energy-management systems. Digital infrastructure is emerging as another area of competition, with industrial estates increasingly integrating data-center capacity within their developments to capture additional infrastructure-related revenue streams. A recent partnership by RDTX Group with a Singapore-based colocation provider illustrates this convergence between industrial real estate and digital infrastructure.
Advisory and brokerage firms such as JLL, CBRE, and Colliers are also expanding their capabilities through data-driven tools, including AI-enabled valuation dashboards and carbon-tracking modules. While these platforms enhance analytics for corporate occupiers and investors, the brokerage market continues to rely heavily on local relationships and market knowledge, allowing boutique agencies to maintain a presence, particularly in secondary cities and specialized tenant-representation services.
Indonesia Commercial Real Estate Industry Leaders
Sinarmas Land
Agung Podomoro Land
Lippo Karawaci
Ciputra Development
RDTX Group
- *Disclaimer: Major Players sorted in no particular order

Recent Industry Developments
- February 2025: DAMAC Properties signed a USD 2.3 billion deal with the Indonesian Investment Coordinating Board to build a 150-MW data-center campus in Batam, with phased completion to 2028
- January 2025: SiCepat committed USD 456 million to add 450,000 m² of automated sortation hubs across 12 cities by 2027, each capable of processing 1 million parcels daily
- December 2024: Sinarmas Land acquired 500 ha near Nusantara for a mixed-use township scheduled to break ground mid-2026.
- November 2024: Danareksa DIRE purchased eight properties for USD 133 million under sale-leaseback terms, funneling liquidity to regional developers while locking in long-term rents


Indonesia Commercial Real Estate Market Report Scope
Commercial real estate, investment property, or income property is intended to generate a profit, either from capital gains or rental income. This report aims to provide a detailed analysis of the Indonesian commercial real estate market. The Indonesian commercial real estate market is segmented by type (offices, retail, industrial, logistics, multi-family, and hospitality) and key cities (Jakarta, Surabaya, and Semarang). The report offers market size and forecast values (USD billion) for all the above segments.
By Property Type
| Offices |
| Retail |
| Logistics |
| Others |
By Business Model
| Sales |
| Rental |
By End-user
| Individuals / Households |
| Corporates & SMEs |
| Others |
By Geography
| Jakarta |
| Surabaya |
| Bandung |
| Semarang |
| Medan |
| Rest of Indonesia |
| By Property Type | Offices |
| Retail | |
| Logistics | |
| Others | |
| By Business Model | Sales |
| Rental | |
| By End-user | Individuals / Households |
| Corporates & SMEs | |
| Others | |
| By Geography | Jakarta |
| Surabaya | |
| Bandung | |
| Semarang | |
| Medan | |
| Rest of Indonesia |


Key Questions Answered in the Report
How large is the Indonesia commercial real estate market in 2026?
It is estimated at USD 28.55 billion, on track to reach USD 39.02 billion by 2031.
Which property type is expanding fastest?
Logistics assets are projected to rise at a 9.12% CAGR through 2031 on e-commerce and 3PL demand.
What share of activity comes from rentals?
Rental contracts represented 62.00% of 2025 value and will remain the dominant model through 2031.
Which geography offers the highest forecast growth?
Rest of Indonesia, encompassing Batam, Makassar, and Sulawesi hubs, is set for an 11.22% CAGR to 2031.
How are sustainability rules affecting landlords?
Jakarta’s 2025 energy code compels retrofits; certified towers secured 8–12% rent premiums and higher occupancies.
Page last updated on:


