Reduced Fat Butter Market Size and Share
Market Overview
| Study Period | 2021 - 2031 |
|---|---|
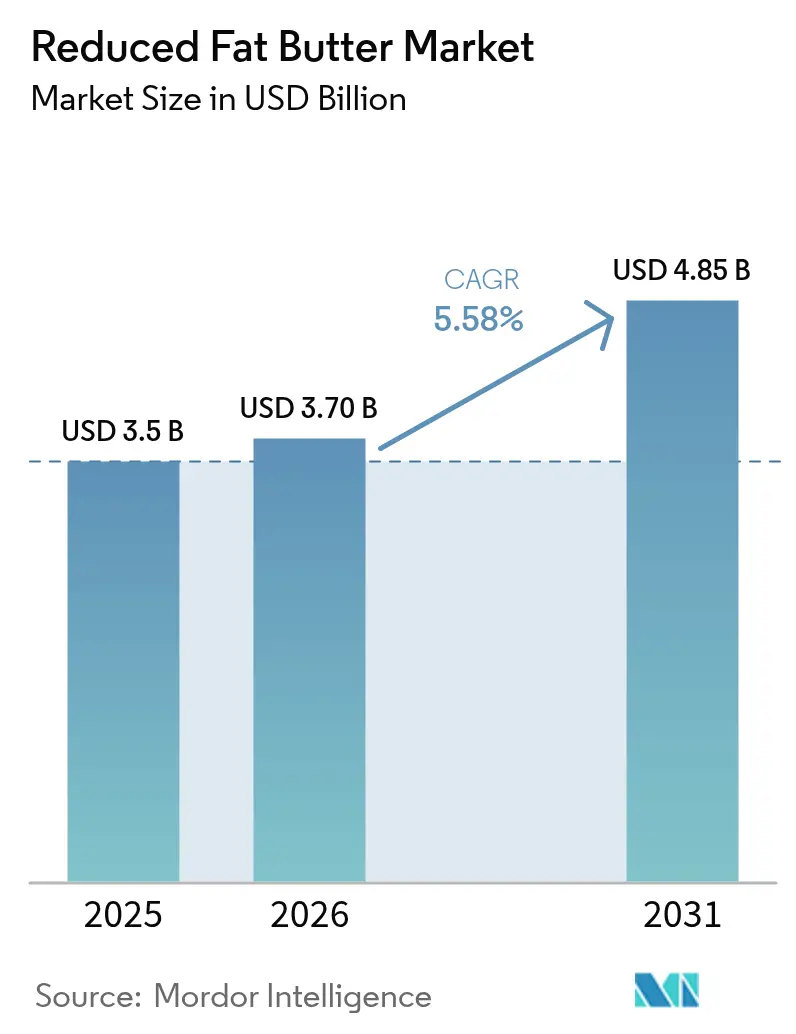
| Market Size (2026) | USD 3.7 Billion |
| Market Size (2031) | USD 4.85 Billion |
| Growth Rate (2026 - 2031) | 5.58% CAGR |
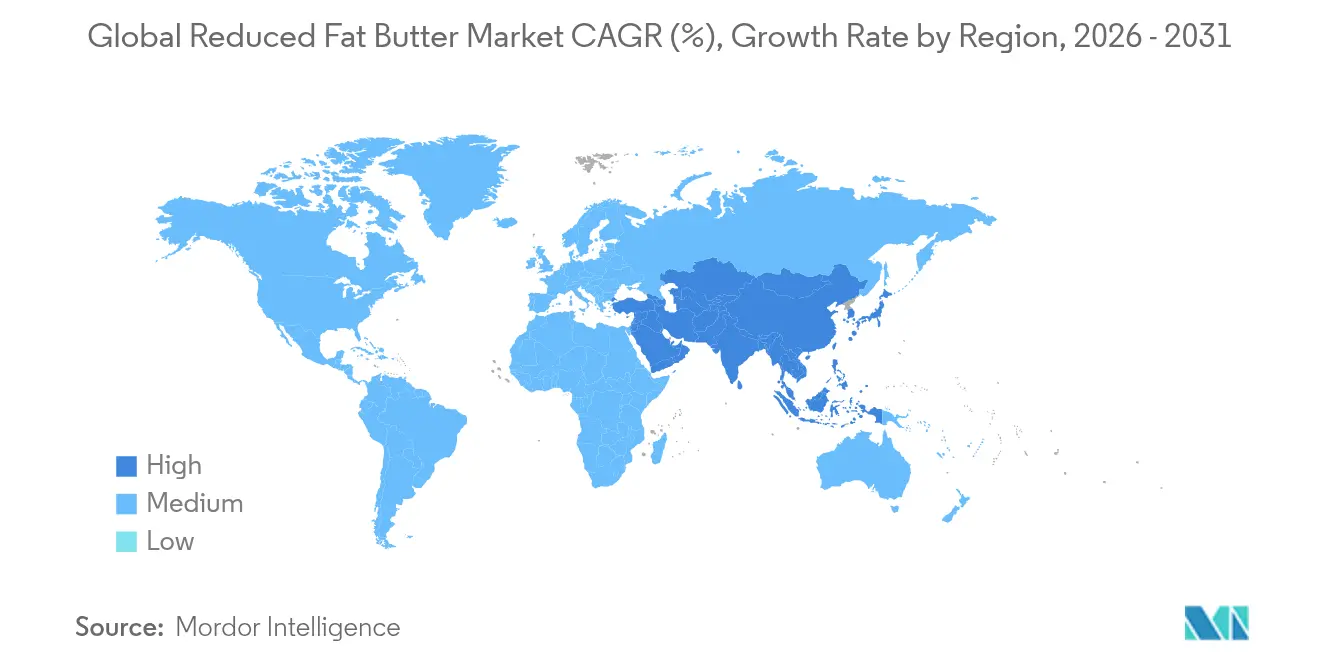
| Fastest Growing Market | Asia Pacific |
| Largest Market | North America |
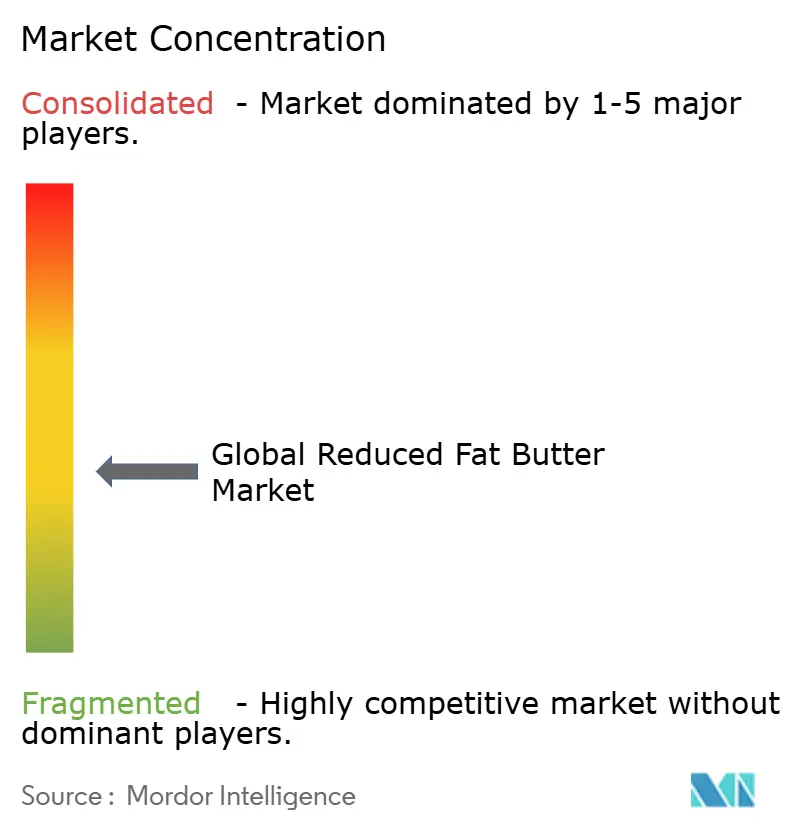
| Market Concentration | Low |
Major Players
*Disclaimer: Major Players sorted in no particular order Image © Mordor Intelligence. Reuse requires attribution under CC BY 4.0. |
|
Reduced Fat Butter Market Analysis by Mordor Intelligence
The reduced fat butter market size is expected to grow from USD 3.50 billion in 2025 to USD 3.70 billion in 2026 and is forecast to reach USD 4.85 billion by 2031 at 5.58% CAGR over 2026-2031. Rising health awareness, particularly concerns about saturated fat and cholesterol intake, is encouraging consumers to opt for lighter dairy alternatives. Innovations in production technologies, such as membrane filtration and protein-based fat substitutes, are enabling manufacturers to replicate the taste and texture of traditional butter in reduced-fat versions. Furthermore, healthcare professionals are increasingly recommending reformulated butter as a dietary solution for managing hypercholesterolemia, which is further driving market growth. The rapid expansion of online grocery platforms has resolved previous distribution challenges, providing brands with direct access to health-conscious consumers. Additionally, premium bakery chains are adopting reduced fat butter to maintain indulgent flavor profiles while catering to the growing demand for wellness-oriented products.
Key Report Takeaways
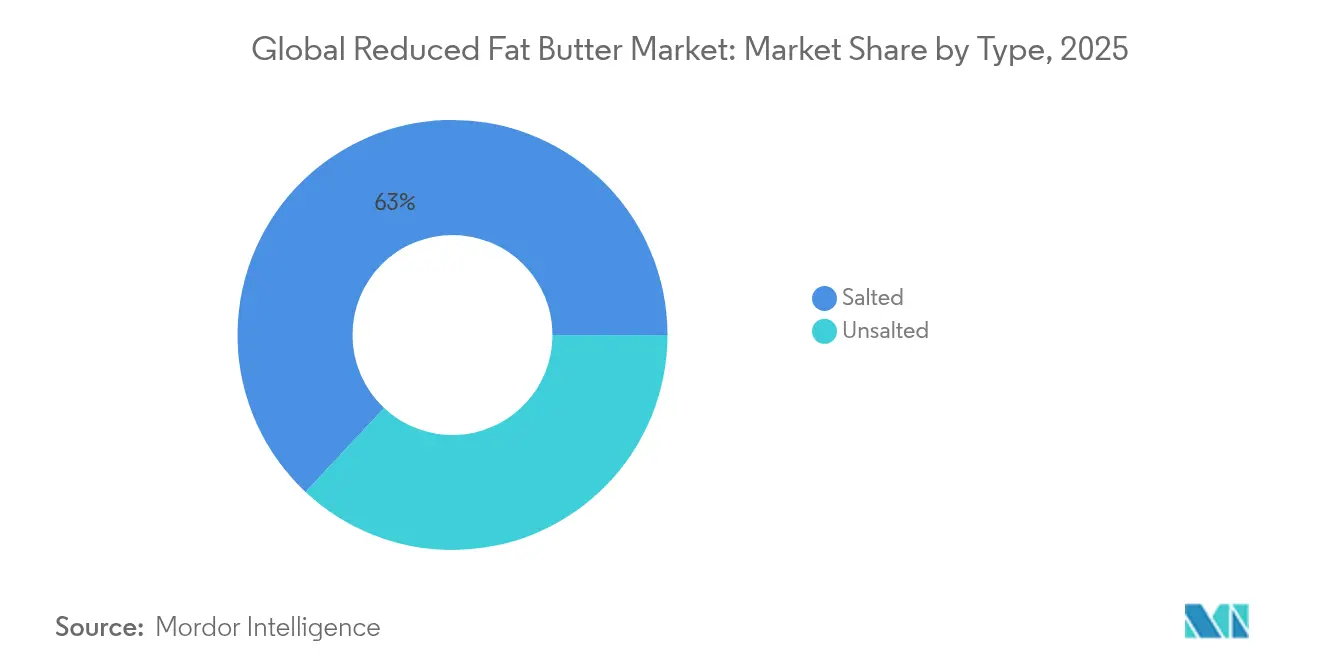
- By type, salted products led with 63.02% of reduced fat butter market share in 2025, while unsalted offerings are set to grow at 5.69% CAGR through 2031.
- By form, spreadable variants dominated with 57.74% of the reduced-fat butter market size in 2025; stick/block formats are the fastest-rising at 6.12% CAGR to 2031.
- By distribution channel, the off-trade segment held 69.35% share of the reduced-fat butter market in 2025, yet on-trade sales are moving ahead at 7.02% CAGR.
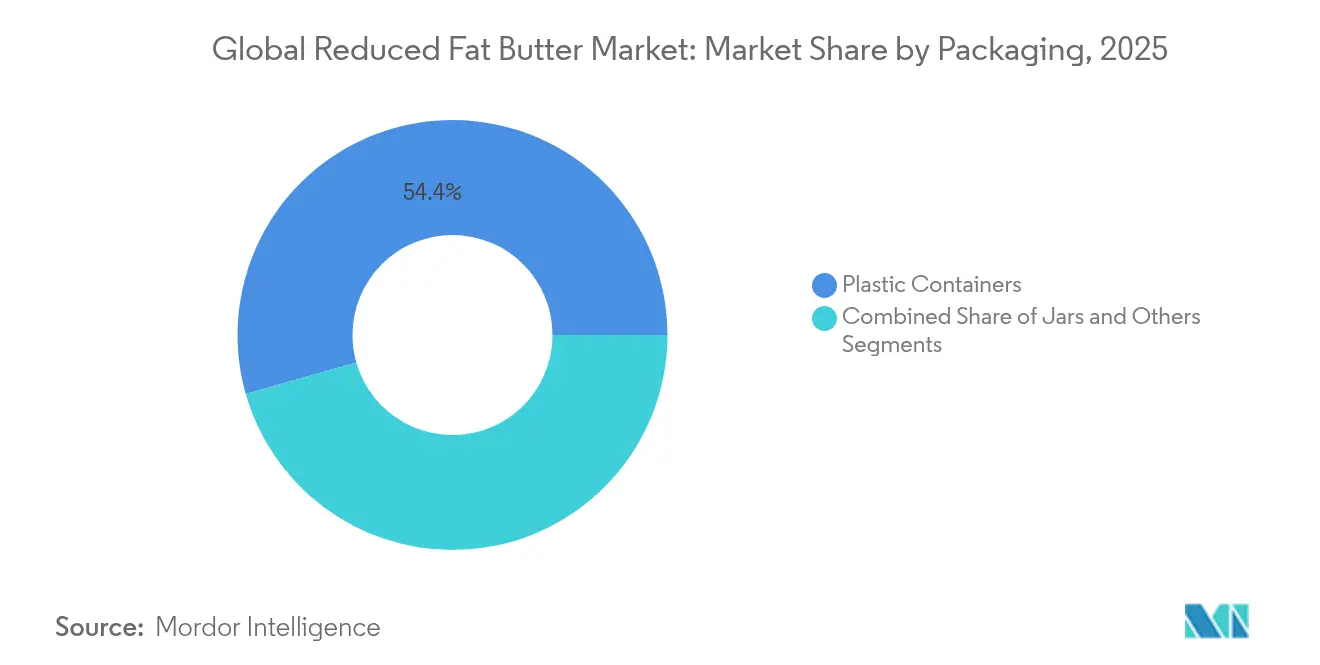
- By packaging, plastic containers captured 54.42% share of the reduced-fat butter market in 2025, whereas jar solutions are projected to advance at 5.21% CAGR.
- By geography, North America accounted for 39.85% of the reduced-fat butter market in 2025; Asia-Pacific delivers the strongest growth at 7.05% CAGR.
Note: Market size and forecast figures in this report are generated using Mordor Intelligence’s proprietary estimation framework, updated with the latest available data and insights as of 2026.
Global Reduced Fat Butter Market Trends and Insights
Drivers Impact Analysis*
| DRIVER | (~) % IMPACT ON CAGR FORECAST | GEOGRAPHIC RELEVANCE | IMPACT TIMELINE |
|---|---|---|---|
| Rising prevalence of hypercholesterolemia spurring demand for lower-fat dairy spreads | +1.2% | Global, with concentration in North America and Europe | Medium term (2-4 years) |
| Reformulation and clean-label mandates driving reduced-fat butter launches | +0.9% | Global, led by North America and Europe regulatory frameworks | Short term (≤ 2 years) |
| Expansion of online grocery platforms enabling direct-to-consumer light butter sales | +0.7% | North America, Europe, with emerging presence in Asia-Pacific | Medium term (2-4 years) |
| Advances in fractionation and micro-filtration preserving full-fat mouthfeel at lower fat levels | +0.8% | Global, with technology leadership in Europe and North America | Long term (≥ 4 years) |
| Premiumization in bakery chains using low-fat butter for health positioning | +0.6% | North America, Europe, expanding to Asia-Pacific urban centers | Medium term (2-4 years) |
| Government initiatives promoting healthier eating habits | +0.5% | Global, with strongest impact in developed markets | Long term (≥ 4 years) |
| Source: Mordor Intelligence | |||
Rising prevalence of hypercholesterolemia spurring demand for lower-fat dairy spreads
The rising global prevalence of hypercholesterolemia is significantly influencing dairy consumption trends, with reduced fat butter gaining popularity as an effective option for managing dietary fats. A 2024 study published in JAMA Internal Medicine, a journal by the American Medical Association, highlights that replacing 10 grams of butter daily with plant-based oils can lower overall mortality risk by 17%. This evidence strongly supports the adoption of reduced-fat alternatives. The proven benefits of the Mediterranean diet in managing cholesterol levels have led healthcare providers to recommend reduced fat dairy products as part of comprehensive cholesterol management plans. For individuals with familial hypercholesterolemia, reducing saturated fat intake is critical, positioning reduced fat butter as a functional food with therapeutic benefits rather than just a lifestyle choice. From an economic perspective, healthcare systems are increasingly recognizing dietary interventions as a cost-effective alternative to pharmaceutical treatments. This growing medical endorsement is driving consistent demand, as consumers now perceive reduced fat butter as a health-conscious investment rather than a compromise on taste.
Reformulation and clean-label mandates driving reduced-fat butter launches
Regulatory requirements for cleaner and healthier food products are accelerating innovation in the reduced fat butter market. The FDA's finalized "healthy" claim guidelines, effective February 25, 2025, set clear limits on saturated fat, sodium, and added sugars. These guidelines provide a competitive advantage to products that meet the criteria[1]Federal Register, "Food Labeling: Nutrient Content Claims; Definition of Term “Healthy”", www.federalregister.gov. Additionally, clean-label trends are encouraging manufacturers to go beyond reducing fat content by optimizing ingredients comprehensively. This includes removing artificial preservatives and stabilizers while maintaining the functionality of the product. The removal of partially hydrogenated oils from food standards has also driven reformulation efforts in butter alternatives, creating opportunities for reduced fat butter to gain market share from traditional margarine. Proposed front-of-package labeling for saturated fat content is expected to further influence consumer preferences, increasing demand for reduced fat options. With a compliance deadline of February 25, 2028, manufacturers have a strategic timeframe to reformulate existing products and introduce new reduced fat variants that align with these evolving regulatory and consumer expectations.
Expansion of online grocery platforms enabling direct-to-consumer light butter sales
Digital commerce is transforming the reduced fat butter market by removing traditional distribution barriers that previously limited its reach. Since the COVID-19 pandemic, the direct-to-consumer (D2C) model has gained significant momentum in the dairy industry. Companies like Amul and Country Delight have successfully adopted D2C strategies, enabling them to maintain better control over their brands while fostering stronger customer relationships. E-commerce platforms have become essential for promoting health-focused products, allowing reduced fat butter brands to target specific consumer groups more effectively than traditional retail channels. Advancements in temperature-controlled logistics have addressed the challenges of perishability in online dairy sales. Specialized packaging and delivery systems now ensure that products maintain their quality during transit. Younger consumers, who value convenience and are willing to pay extra for health-oriented products, are driving the shift toward online purchasing. Additionally, digital platforms provide critical consumer data, enabling brands to offer personalized nutrition recommendations. This positions reduced fat butter not just as a standalone product but as part of a larger wellness ecosystem, aligning with the growing demand for health and wellness solutions.
Advances in fractionation and micro-filtration preserving full-fat mouthfeel at lower fat levels
Advancements in processing technologies are addressing the sensory challenges that previously limited the acceptance of reduced-fat butter among mainstream consumers. In 2024, Nestlé introduced a dairy fat reduction innovation capable of reducing fat content by up to 60%. This innovation uses protein-based fat mimicry to retain the creamy texture and rich mouthfeel associated with full-fat butter. Membrane filtration technologies, including microfiltration, ultrafiltration, and nanofiltration, now enable precise separation of milk components while preserving the functional properties that define butter's texture. Additionally, SPX FLOW's LeanCreme technology modifies whey proteins to create structures that replicate the functionality of traditional butter, making it suitable for both spreading and baking applications. These advancements are particularly critical for food service sectors, where maintaining functional performance is essential. Furthermore, the scalability of these technologies supports cost-efficient production, allowing reduced-fat butter to compete effectively with traditional options in terms of both price and performance.
Restraint Impact Analysis*
| RESTRAINT | (~) % IMPACT ON CAGR FORECAST | GEOGRAPHIC RELEVANCE | IMPACT TIMELINE |
|---|---|---|---|
| Premium price discouraging mass-market adoption in emerging economies | -0.8% | Asia-Pacific, Latin America, Africa | Medium term (2-4 years) |
| Stringent dairy fat labelling rules constraining innovation | -0.4% | Global, with particular impact in Europe and North America | Short term (≤ 2 years) |
| Rising plant-based spread adoption cannibalising reduced-fat butter | -0.6% | North America and Europe, expanding globally | Long term (≥ 4 years) |
| Skepticism about additives or sugars in reduced-fat products | -0.3% | Global, with higher impact in health-conscious demographics | Medium term (2-4 years) |
| Source: Mordor Intelligence | |||
Premium price discouraging mass-market adoption in emerging economies
Price sensitivity in developing markets creates a major challenge for the adoption of reduced-fat butter. In these regions, income levels heavily influence consumption patterns, with lower-income populations opting for affordable, traditional options over premium products. A study covering 164 countries highlights that food price elasticity varies significantly by income, with lower-income groups being more sensitive to higher prices for dairy products. As emerging economies transition from traditional animal fats to modern dairy products, the higher cost of reduced-fat butter becomes difficult to justify. In many markets, purchasing decisions are driven by caloric density, making reduced-fat options less appealing due to their higher relative cost compared to calorie-dense alternatives. Additionally, currency fluctuations and reliance on imports in these regions further increase the affordability challenges for processed dairy products. Limited local production of reduced-fat butter in most developing areas forces reliance on imports or investments in technology transfer, both of which raise production costs.
Rising plant-based spread adoption cannibalising reduced-fat butter
Health-conscious consumers, who form the primary audience for both plant-based spreads and reduced-fat butter, are increasingly drawn to plant-based alternatives, creating significant competition in the market. Flora Food Group reported USD 3.3 billion in net sales in 2023, highlighting the strong presence of plant-based spreads. The company is actively investing in advanced technologies to improve the taste and performance of its products, addressing areas where dairy has traditionally held an advantage. Consumer concerns about plant-based fats are gradually decreasing as sustainability and animal welfare considerations become key factors influencing purchasing decisions, often surpassing health-related motivations. The butter market is expected to grow steadily, intensifying competition as price differences shrink and taste profiles improve. Additionally, Upfield's introduction of plastic-free packaging showcases how plant-based brands are leveraging sustainability to stand out from traditional dairy alternatives, further strengthening their market position.
*Our forecasts treat driver/restraint impacts as directional, not additive. The impact forecasts reflect baseline growth, mix effects, and variable interactions.
Segment Analysis
By Type: Clean-Label Drives Unsalted Growth
In 2025, salted reduced fat butter captures a commanding 63.02% of the market share, underscoring consumers' steadfast preference for familiar flavors that seamlessly integrate into both household and food service settings. Salted varieties dominate due to their adaptability in spreading and cooking, where added salt not only elevates flavor but also conceals textural nuances from fat reduction. Research in Food Function highlights that salt content in dairy plays a pivotal role in consumer acceptance and repeat purchases, especially in cultures with deep-rooted butter consumption. The FDA's revised criteria for "healthy" claims, while capping sodium levels, still permit moderate salt that appeals to consumers, ensuring products retain their health positioning. Salted reduced fat butter is a favorite in commercial food services, delivering consistent flavor across varied menu items without the need for recipe tweaks.
Unsalted reduced fat butter is on a growth trajectory, boasting a 5.69% CAGR through 2031. This surge is fueled by clean-label demands and the need for precise sodium control in professional bakeries. The rising preference for unsalted butter highlights a blend of health awareness and culinary finesse. Commercial bakeries are now opting for unsalted variants to achieve the perfect flavor balance in their premium offerings. Challenge Dairy's nationwide debut of lactose-free clarified butter showcases the dual benefits of unsalted formulations: catering to both sodium-conscious consumers and those with lactose intolerance. Regulatory shifts, like the front-of-package labeling proposals focusing on sodium, further bolster the unsalted segment's appeal in health-centric retail spaces. Unsalted reduced fat butter is becoming the go-to for chefs and food producers, prized for its seasoning flexibility and alignment with clean-label trends.


By Form: Convenience Dominance Meets Industrial Innovation
In 2025, spreadable reduced fat butter commands a 57.74% market share, riding the wave of consumer preferences for convenience and immediate usability. This format's appeal lies in its ability to be used straight from the fridge, bypassing the usual temperature conditioning. Households, especially during breakfast and snack times, gravitate towards this format, valuing the consistency it offers for spreading. Innovations like Anchor's squeezable butter-oil blends highlight the evolution of spreadable formats, merging the rich flavor of butter with enhanced usability. Furthermore, packaging advancements ensure that the spreadable format maintains its consistency, even with temperature fluctuations, tackling a common issue faced by traditional butter users. Retailers are increasingly favoring these spreadable varieties, as they promise instant satisfaction and simplify the preparation process, making them more enticing to consumers.
Stick/block reduced fat butter formats are projected to achieve a 6.12% CAGR through 2031, outpacing their spreadable counterparts. This surge is largely driven by the industrial food sector's preference, where the precise portioning and controlled melting of stick/block formats are paramount for consistent manufacturing. Bluegrass Ingredients has introduced butter concentrates in stick/block formats, offering the same rich flavor at reduced usage rates, showcasing their adaptability to cost pressures without compromising on commercial functionality. Research underscores the superiority of stick/block formats in providing structural integrity for baked goods, especially where precise fat distribution is crucial. As the industrial food service sector expands, the demand for these resilient stick/block formats grows, thanks to their ability to endure mechanical processing and ensure consistent results in high-volume production.
By Packaging: Plastic Containers Dominates, Jars Accelerates
In 2025, plastic containers hold a 54.42% market share due to their cost-effectiveness and practical benefits in retail distribution, consumer handling, and supply chain efficiency. Their widespread use is supported by a strong manufacturing base and consumer familiarity with traditional butter packaging, which reduces resistance to adoption. These containers offer excellent barrier properties, helping to extend shelf life and preserve product quality during transportation and storage. This is particularly important for retailers aiming to manage inventory efficiently and minimize waste. Additionally, the standardized dimensions of plastic containers simplify distribution and merchandising across various retail formats. Studies show that features like portion visibility and resealability not only improve the user experience but also contribute to reducing food waste.
Jar packaging formats are expected to grow at a 5.21% CAGR through 2031, surpassing plastic containers in growth rate. This trend is driven by sustainability efforts and premium branding strategies that emphasize recyclability and higher perceived quality. For instance, Upfield has introduced the world’s first plastic-free, recyclable tub for plant-based butters, aiming to replace up to 2 billion plastic tubs by 2030 and reduce plastic waste by over 25,000 tons annually. Similarly, ALDI has launched recyclable butter packaging in the UK, replacing non-recyclable materials with paper-based wraps, which is expected to eliminate over 10 tonnes of non-recyclable packaging each year. Consumers, particularly those who prioritize environmental sustainability, are increasingly willing to pay more for eco-friendly packaging. This shift highlights how packaging choices are becoming a reflection of consumers’ sustainability values, further driving the adoption of jar formats.
By Distribution Channel: Retail Stability Versus Foodservice Innovation
In 2025, off-trade distribution channels hold a significant 69.35% market share, driven by consistent consumer buying habits and the convenience of retail options such as supermarkets, hypermarkets, and specialty stores. This dominance highlights the importance of household consumption in the demand for reduced fat butter, where easy access to retail outlets and strong brand recognition influence purchasing decisions. Walmart's investment in new milk processing facilities further strengthens the retail infrastructure supporting the dairy supply chain. For instance, its Robinson, Texas facility is set to serve over 750 stores and process a variety of milk products, including reduced fat options. Off-trade channels also benefit from direct-to-consumer (D2C) models, which allow companies to target health-conscious consumers more effectively. Brands like Amul have successfully implemented D2C strategies, enhancing their control over branding and improving customer engagement. Additionally, online retail within the off-trade segment is gaining traction, supported by advancements in temperature-controlled logistics that address the challenges of dairy product perishability in e-commerce.
On-trade distribution channels are growing at a faster pace, with a 7.02% CAGR projected through 2031. This growth outpaces that of off-trade channels, fueled by the food service industry's focus on healthier menu options and premium offerings. Restaurants increasingly use reduced fat butter as a way to offer health benefits without compromising on taste, making it a key ingredient in high-visibility dishes. The National Restaurant Association predicted record restaurant sales in 2024, creating favorable conditions for the adoption of premium ingredients, despite challenges like rising food costs and labor shortages. Grupo Bimbo's focus on health-oriented product innovations, such as high-protein and healthier formulations, reflects the food service sector's response to growing consumer demand for better-for-you options. The on-trade segment's growth is particularly strong in commercial bakery chains, where reduced fat butter supports health-focused branding while maintaining the premium quality that justifies higher menu prices.
Geography Analysis
In 2025, North America commands a dominant 39.85% share of the market, bolstered by a deep-rooted health consciousness, stringent regulatory frameworks, and a sophisticated food service sector that champions the adoption of reduced-fat butter. The region's established dairy consumption habits, coupled with advanced distribution networks, pave the way for premium products to thrive in both retail and commercial arenas. Walmart's foray into new milk processing facilities underscores the significant infrastructure investments bolstering the dairy supply chain. Meanwhile, the FDA's revised "healthy" claim criteria lend a favorable nod to reduced-fat formulations. This is further amplified by a well-informed consumer base acutely aware of cardiovascular health risks, fueling a consistent demand for fat-reduced options. Additionally, Canada's uptick in butter imports, facilitated by CPTPP and USMCA trade agreements, underscores the region's dynamic trade landscape, paving the way for innovative dairy products.
Asia-Pacific stands out as the region with the most rapid growth, boasting a 7.05% CAGR projected through 2031. This surge is largely attributed to swift urbanization, climbing disposable incomes, and a shift in dietary preferences leaning towards Western-style dairy consumption. China's status as Asia's largest butter importer unveils lucrative prospects for reduced-fat variants, especially as urban health awareness sharpens. The region's burgeoning middle class, coupled with a shift towards Western-style dairy products, paints a promising picture for the adoption of reduced-fat butter. While Japan and South Korea navigate as mature markets with nuanced health positioning needs, Southeast Asian markets are on the brink of evolution in their dairy consumption patterns, hinting at untapped growth potential.
Europe's regulatory landscape is increasingly favoring products that boast clean labels and sustainable credentials. A testament to this trend is Arla's hefty EUR 300 million investment across its UK sites, underscoring the industry's commitment to elevating dairy processing standards. The continent's rigorous food safety and environmental regulations not only set high benchmarks but also offer a competitive edge to companies that can seamlessly blend health benefits with sustainability. Meanwhile, while South America and the Middle East and Africa have traditionally been price-sensitive, urban hubs in these regions are gradually warming up to health-oriented dairy products, signaling a shift as their economies evolve.

Competitive Landscape
The global reduced-fat butter market has low fragmentation, comprising a mix of multinational dairy corporations and regional players competing to address the increasing demand for healthier butter alternatives. Prominent companies such as Land O’Lakes, Inc., Gujarat Cooperative Milk Marketing Federation Ltd. (Amul), Saputo Inc, Arla Foods amba, and Ornua Co-operative Ltd. (Kerrygold) dominate the market by leveraging their extensive distribution networks and strong brand presence. At the same time, smaller niche and regional brands are gaining momentum by offering innovative formulations and tailoring their marketing strategies to local consumer needs.
Significant growth opportunities exist in specialized segments like industrial food services and premium retail markets. These areas require high-performance products, which create barriers for alternative technologies to compete effectively. Emerging players are disrupting the market by introducing advanced solutions. Biotechnology companies are developing innovative fat production methods, while packaging innovators are addressing sustainability concerns by creating recyclable and compostable packaging materials to meet consumer and regulatory demands.
Technological advancements are playing a crucial role in providing a competitive edge. Companies are focusing on processing innovations that reduce fat content without compromising product quality or functionality. Industry leaders such as Nestlé and SPX FLOW are spearheading these efforts by developing next-generation dairy processing equipment to cater to the evolving needs of the market.
Reduced Fat Butter Industry Leaders
-
Gujarat Cooperative Milk Marketing Federation Ltd. (Amul)
-
Arla Foods amba
-
Ornua Co-operative Ltd. (Kerrygold)
-
Land O’Lakes, Inc.
-
Saputo Inc.
- *Disclaimer: Major Players sorted in no particular order

Recent Industry Developments
- April 2025: Arla Foods and DMK Group announced a mega-merger to form Europe's largest dairy cooperative, combining over 12,000 farmers and generating pro forma revenue of EUR 19 billion, pending regulatory approval to enhance dairy production capabilities and innovation in reduced-fat products.
- April 2025: Chobani has commenced construction on a USD 1.2 billion production facility in Rome, New York. This state-of-the-art facility is designed to process more than 1 billion pounds of dairy annually, aiming to meet the growing demand for high-quality dairy products while supporting the local economy and creating new job opportunities in the region.
- March 2025: Amul is set to gradually broaden its footprint in Tamil Nadu, India, by introducing a range of its popular dairy products, including butter, cheese, and ice cream. This expansion aligns with the company's strategy to strengthen its presence in southern India and cater to the growing demand for high-quality dairy products in the region.
- June 2024: Savencia Fromage & Dairy, leveraging its 60th anniversary of diplomatic relations between China and France, expanded its market presence and strengthened its corporate image in China, focusing on premium dairy products such as specialty cheeses and butters. This strategic move also includes the promotion of dairy products like reduced-fat butter and other health-conscious dairy offerings, aligning with rising Chinese consumer demand for nutritious, high-quality, and innovative dairy products.


Global Reduced Fat Butter Market Report Scope
Global reduced fat butter market is segmented by type, form, distribution channel, and geography. Based on type, the market is segmented into salted and unsalted. Based on form, the market is segmented into spreadable and non-spreadable. Based on the distribution channel, supermarkets/hypermarkets, convenience stores, online retailers, and other distribution channels. Furthermore, the report takes into consideration the market for reduced-fat butter in the established and emerging economies across the globe, including North America, Europe, Asia-Pacific, South America, Middle East & Africa.
| Salted |
| Unsalted |
| Spreadable |
| Stick/Block |
| Others |
| Plastic Containers |
| Jars |
| Others |
| Off-Trade | Supermarkets and Hypermarkets |
| Convenience and Specialty Stores | |
| Online Retailers | |
| Others Distribution Channels | |
| On-Trade |
| North America | United States |
| Canada | |
| Mexico | |
| Rest of North America | |
| South America | Brazil |
| Argentina | |
| Colombia | |
| Chile | |
| Peru | |
| Rest of South America | |
| Europe | Germany |
| United Kingdom | |
| Italy | |
| France | |
| Netherlands | |
| Poland | |
| Belgium | |
| Sweden | |
| Rest of Europe | |
| Asia-Pacific | China |
| India | |
| Japan | |
| Australia | |
| Indonesia | |
| South Korea | |
| Thailand | |
| Singapore | |
| Rest of Asia-Pacific | |
| Middle East and Africa | South Africa |
| Saudi Arabia | |
| United Arab Emirates | |
| Nigeria | |
| Egypt | |
| Morocco | |
| Turkey | |
| Rest of Middle East and Africa |
| By Type | Salted | |
| Unsalted | ||
| By Form | Spreadable | |
| Stick/Block | ||
| Others | ||
| By Packaging | Plastic Containers | |
| Jars | ||
| Others | ||
| By Distribution Channel | Off-Trade | Supermarkets and Hypermarkets |
| Convenience and Specialty Stores | ||
| Online Retailers | ||
| Others Distribution Channels | ||
| On-Trade | ||
| By Geography | North America | United States |
| Canada | ||
| Mexico | ||
| Rest of North America | ||
| South America | Brazil | |
| Argentina | ||
| Colombia | ||
| Chile | ||
| Peru | ||
| Rest of South America | ||
| Europe | Germany | |
| United Kingdom | ||
| Italy | ||
| France | ||
| Netherlands | ||
| Poland | ||
| Belgium | ||
| Sweden | ||
| Rest of Europe | ||
| Asia-Pacific | China | |
| India | ||
| Japan | ||
| Australia | ||
| Indonesia | ||
| South Korea | ||
| Thailand | ||
| Singapore | ||
| Rest of Asia-Pacific | ||
| Middle East and Africa | South Africa | |
| Saudi Arabia | ||
| United Arab Emirates | ||
| Nigeria | ||
| Egypt | ||
| Morocco | ||
| Turkey | ||
| Rest of Middle East and Africa | ||


Key Questions Answered in the Report
What is the current size of the reduced fat butter market?
The reduced fat butter market is valued at USD 3.70 billion in 2026 and is projected to reach USD 4.85 billion by 2031, reflecting a 5.58% CAGR.
Which region shows the fastest growth for reduced fat butter?
Asia-Pacific leads with a projected 7.05% CAGR through 2031, driven by rising health awareness and growing Western-style dairy consumption.
Why are unsalted reduced fat butter variants growing faster than salted?
Unsalted lines meet stricter sodium guidelines under new “healthy” labeling rules and satisfy bakery demand for precise flavor control, supporting a 5.69% CAGR.
Are plant-based spreads a threat to reduced fat butter?
Yes, vegan spreads with improved taste and lower environmental footprints attract similar health-conscious consumers, creating competitive pressure on shelf space and pricing.
Page last updated on:


