Recreation Services Market Size and Share
Market Overview
| Study Period | 2020 - 2031 |
|---|---|
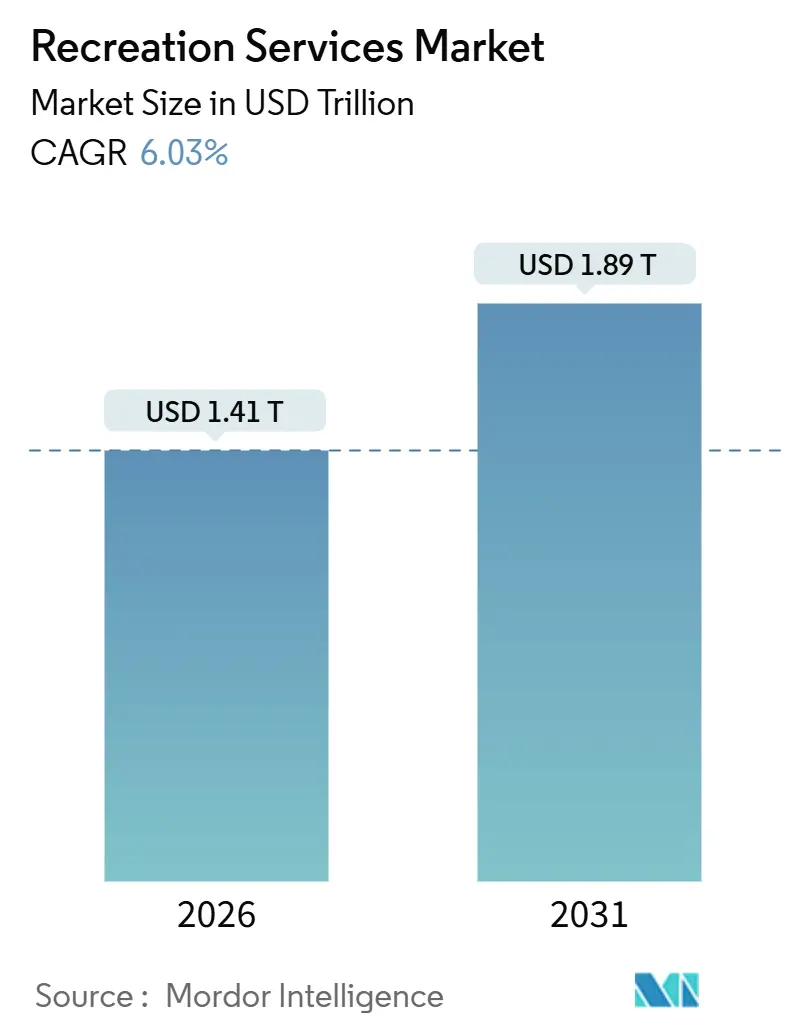
| Market Size (2026) | USD 1.41 Trillion |
| Market Size (2031) | USD 1.89 Trillion |
| Growth Rate (2026 - 2031) | 6.03% CAGR |
| Fastest Growing Market | Asia Pacific |
| Largest Market | North America |
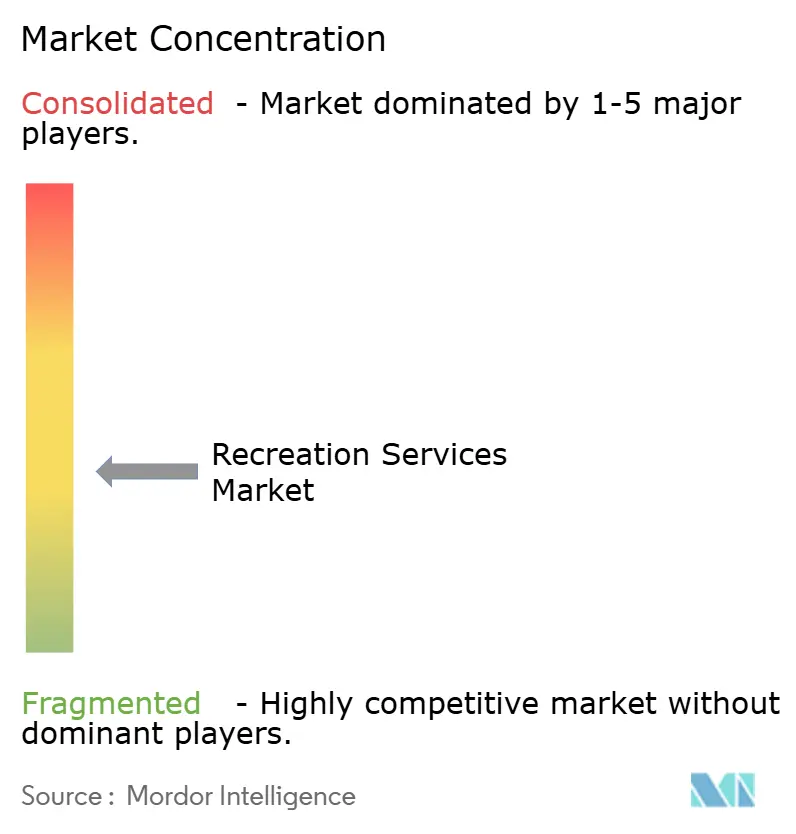
| Market Concentration | Medium |
Major Players *Disclaimer: Major Players sorted in no particular order Image © Mordor Intelligence. Reuse requires attribution under CC BY 4.0. | |
Recreation Services Market Analysis by Mordor Intelligence
The global recreation services market size reached USD 1.41 trillion in 2026 and is projected to climb to USD 1.89 trillion by 2031, registering a 6.03% CAGR during the forecast period. This expansion reflects a decisive move away from passive leisure toward immersive, intellectual-property-anchored venues that command higher per-capita outlays. Operators that integrate physical infrastructure with digital overlays are extracting larger margins, while brands eager for captive audiences are accelerating sponsorship demand. North America remains the single-largest region, yet Asia-Pacific is advancing the fastest on the back of a wealthier middle class and government tourism investments. Competitive intensity is rising as media conglomerates vertically integrate, capital costs escalate, and technology reshapes visitor engagement.
Key Report Takeaways
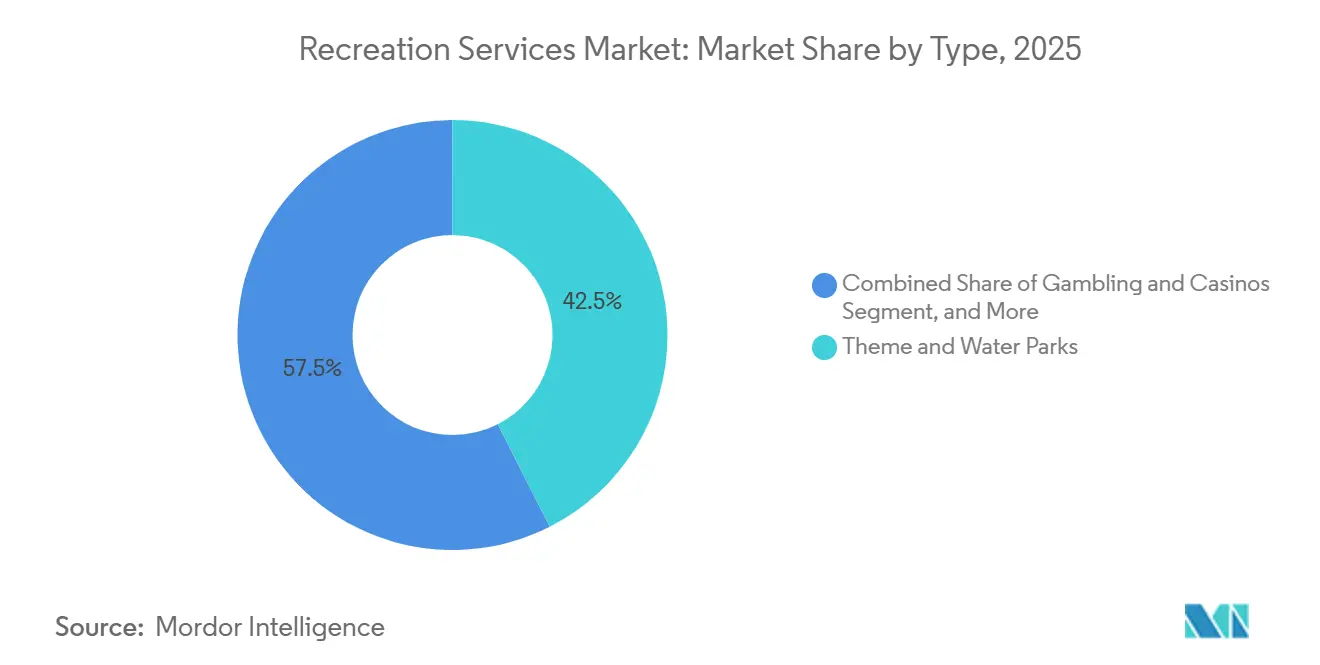
- By type, theme and water parks led with 42.53% of recreation services market share in 2025, while online and virtual experiences are forecast to expand at a 6.92% CAGR to 2031.
- By revenue stream, admission and ticket sales accounted for 48.27% of the recreation services market size in 2025, whereas sponsorship and advertising is the fastest-growing stream at a 6.71% CAGR through 2031.
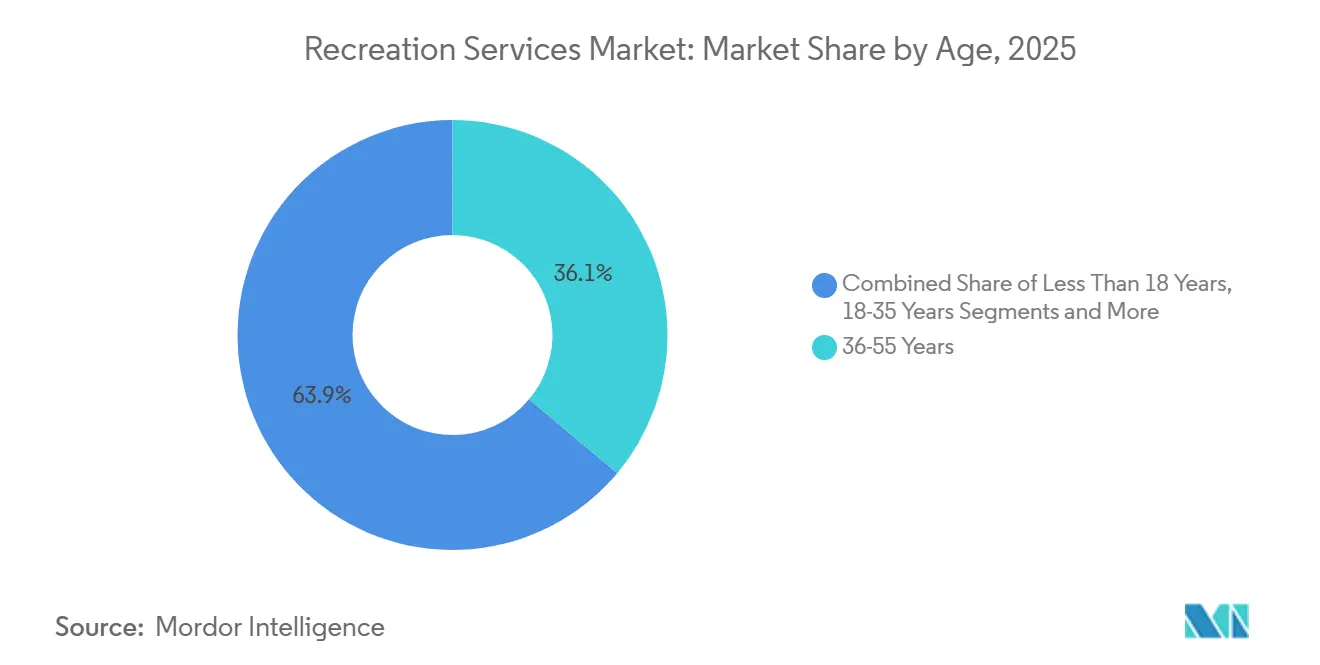
- By age group, millennials contributed 36.11% of 2025 revenue, but Generation Z is poised for a 6.47% CAGR through 2031, reflecting its appetite for shareable experiences.
- By mode, on-site physical visits dominated with an 88.07% share in 2025, yet virtual and online formats are expanding at a 6.92% CAGR, underscoring the need for hybrid propositions.
- By geography, North America commanded 35.49% of revenue in 2025, while Asia-Pacific is projected to post a 6.54% CAGR through 2031 on surging discretionary incomes and tourism infrastructure.
Note: Market size and forecast figures in this report are generated using Mordor Intelligence’s proprietary estimation framework, updated with the latest available data and insights as of January 2026.
Global Recreation Services Market Trends and Insights
Drivers Impact Analysis*
| Driver | (~) % Impact on CAGR Forecast | Geographic Relevance | Impact Timeline |
|---|---|---|---|
| Consumer-led shift toward experiential leisure travel in Asia-Pacific | +1.2% | Asia-Pacific core, spillover to Middle East and Africa | Medium term (2-4 years) |
| Surge of IP-based theme parks tied to global media franchises | +1.4% | Global, highest in North America, Europe, Asia-Pacific | Long term (≥ 4 years) |
| Casino-integrated resorts driving non-gaming revenue diversification in North America | +0.9% | North America, Macau, Singapore | Medium term (2-4 years) |
| Government urban-revitalization programs spurring cultural attractions in Europe | +0.7% | Europe, early gains in France, Germany, United Kingdom | Long term (≥ 4 years) |
| Sports-tourism campaigns ahead of 2028 Los Angeles and 2032 Brisbane Olympics | +0.8% | North America, Australia | Short term (≤ 2 years) |
| Rapid adoption of AR/VR attractions to boost per-capita spend in GCC | +1.0% | Middle East (UAE, Saudi Arabia, Qatar) | Medium term (2-4 years) |
| Source: Mordor Intelligence | |||
Consumer-Led Shift Toward Experiential Leisure Travel in Asia-Pacific
China’s domestic tourism bill hit CNY 5.8 trillion (USD 820 billion) in 2025, with 22% flowing to theme parks and cultural venues, up four percentage points since 2023.[1]China National Tourism Administration, “Domestic Tourism Expenditure Report 2025,” cnta.gov.cn Parallel spending pivots are visible in India, where outbound travel jumped 34% year-over-year in 2025, yet domestic venues captured a bigger slice as operators expanded capacity. Younger visitors prize photogenic, interactive installations, prompting operators to prioritize set design and mobile-ready experiences. Governments from Thailand to Vietnam now market experiential attractions as anchors for economic diversification, reinforcing the region’s 6.54% CAGR outlook.
Surge of IP-Based Theme Parks Tied to Global Media Franchises
Intellectual property is the chief price premium driver, raising per-capita spending by as much as 40% relative to generic rides. Universal’s Epic Universe, opened in 2025 after a USD 5 billion build-out, charges USD 150-200 entry by bundling Nintendo, Harry Potter, and How to Train Your Dragon lands. Disney answered with a USD 2.2 billion Shanghai Resort expansion announced in December 2025. Independent parks lacking franchise access face a squeeze, often pivoting to culturally rooted themes or selling to larger platforms.
Casino-Integrated Resorts Driving Non-Gaming Revenue Diversification in North America
MGM Resorts derived 58% of Q3 2025 revenue from entertainment, dining, and retail as traditional table-game propensity wanes among younger patrons.[2]MGM Resorts Investor Relations, “Q3 2025 Earnings Report,” mgmresorts.com Las Vegas Sands’ Macau resorts generated 61% from non-gaming streams in the same quarter, while Wynn Resorts earmarked USD 1.1 billion for a Las Vegas theater and immersive dining upgrade. The pivot shields earnings from regulatory caps on gaming tables and aligns with Generation Z demand for diversified leisure.
Government Urban-Revitalization Programs Spurring Cultural Attractions in Europe
France allocated EUR 850 million (USD 920 million) in 2025 to regional museums, and Germany committed EUR 1.3 billion for digitized heritage upgrades through 2027. The United Kingdom increased regional gallery funding by 28% in 2025. Publicly financed venues now pull visitor traffic away from private parks, particularly older travelers favoring educational content.
Restraints Impact Analysis*
| Restraint | (~) % Impact on CAGR Forecast | Geographic Relevance | Impact Timeline |
|---|---|---|---|
| High Up-Front CAPEX for Large-Scale Experiential Venues (More than USD 500 million) | -0.8% | Global, with acute impact in emerging markets | Long term (≥ 4 years) |
| Rising Liability-Insurance Premiums for High-Thrill Attractions | -0.6% | North America, Europe, Australia | Short term (≤ 2 years) |
| Talent Shortages in Specialised Live-Event Operations Post-COVID | -0.5% | Global, with concentration in North America and Europe | Medium term (2-4 years) |
| Intensifying ESG Scrutiny on Animal-Based Entertainment | -0.4% | North America, Europe, with emerging pressure in Asia-Pacific | Medium term (2-4 years) |
| Source: Mordor Intelligence | |||
High Up-Front CAPEX for Large-Scale Experiential Venues
Universal’s latest park consumed USD 5 billion over five years, a threshold unattainable for most independents. Interest-rate hikes added 200-300 basis points to emerging-market borrowing costs in 2024-2025, delaying project timelines and nudging smaller operators toward asset-light licensing arrangements.
Rising Liability-Insurance Premiums for High-Thrill Attractions
Insurance costs for roller coasters and water slides climbed 18-22% across North America and Europe in 2025. Cedar Fair said premiums now consume 4-5% of revenue, almost double 2022 levels.[3]Cedar Fair, “Form 10-K 2024,” sec.gov European regulators shortened inspection intervals, magnifying compliance spending and pressuring margins.
*Our forecasts treat driver/restraint impacts as directional, not additive. The impact forecasts reflect baseline growth, mix effects, and variable interactions.
Segment Analysis
By Type - Virtual Add-Ons Amplify IP-Driven Park Economics
Theme and water parks captured 42.53% of 2025 revenue thanks to multi-day visit potential, premium quick-queue passes, and on-site hotels that elevate recreation services market size. Yet virtual experiences, though only 11.93% of revenue in 2025, are forecast for a 6.92% CAGR, the highest in the recreation services market. IP-anchored mega-resorts continue to justify USD 5 billion budgets, whereas mid-market operators such as Merlin Entertainments avoid head-to-head competition by emphasizing city-center attractions. Gambling venues, integrating luxury dining and live shows, reduce gaming dependency as regulators tighten oversight. Cultural sites, boosted by urban-renewal grants, meet the accessibility preferences of older segments yet must address ESG pressure on animal exhibits.
Second-order dynamics revolve around data-driven personalization. RFID wristbands and mobile apps at Epic Universe and Six Flags transform visitor flow management and coax incremental spending, supporting recreation services market share gains for operators that can fund such systems. Asset-light strategies are proliferating: smaller park chains license IP or sell to larger groups to sidestep CAPEX barriers.


By Revenue Stream - Sponsorship Scales Beyond Static Signage
Admission fees remained the backbone at 48.27% of 2025 turnover, but brands are accelerating into immersive collaborations that yield the 6.71% CAGR in sponsorship and advertising. Food and beverage receipts outpace headline attendance growth as celebrity chef partnerships lift average checks to USD 80-120. Merchandise now skews toward personalized items enabled by RFID and mobile checkout, while premium fast-pass products and after-hours events embed dynamic pricing. MGM Resorts extracted 42% of Q3 2025 turnover from food and beverage, illustrating how premiumization counters ticket-price sensitivity.
Operators increasingly bundle experiences: Coca-Cola’s interactive tasting lab at Disney Springs and Samsung’s VR zones at Six Flags recast sponsorship as an attraction in itself, enhancing the recreation services market size without overcrowding price-conscious admission lines. The strategy also decreases revenue cyclicality by aligning brand budgets with off-peak periods.
By Age Group - Social-First Design Captures Generation Z Wallets
Operators that segment offerings with VIP tours for millennials and sensory-inclusive experiences for seniors balance per-capita upside with inclusivity mandates.
By Mode - Hybrid Visitation Extends Lifetime Customer Value
On-site visits still anchor the recreation services market, but virtual modes expand reach to international or mobility-constrained audiences. Disney’s late-2025 VR park lets users roam Magic Kingdom remotely, purchase merchandise, and bank loyalty points redeemable on future physical trips. Universal deploys VR pre-shows that feed narrative context before guests join physical queues, cutting perceived wait time and supporting higher recreation services market share. Hybrid passes coupling physical tickets with exclusive digital content encourage annual renewals and minimize seasonality.
Geography Analysis
North America maintained a 35.49% hold on the recreation services market in 2025, anchored by mature clusters in Florida, California, and Nevada. Growth is moderating in absolute attendance; hence, operators emphasize premiumization through VIP tours, backstage events, and dynamic pricing to boost per-capita spend. Liability insurance inflation and talent shortages temper expansion, although large chains leverage economies of scale to maintain margins.
Asia-Pacific is on a 6.54% CAGR trajectory to 2031, powered by expanding middle-class households and government-backed tourism corridors. China’s 2025 domestic tourism bill of CNY 5.8 trillion (USD 820 billion) channeled 22% to parks and cultural venues, while India’s theme park footfall rose 28% and operators pushed into tier-2 cities. Japan’s Universal Studios Osaka logged record attendance in fiscal 2025 on the magnetism of Super Nintendo World. Rapid AR/VR adoption bolsters per-capita spend in Gulf Cooperation Council states, with Saudi Arabia’s Qiddiya aiming for 17 million annual visitors by 2030.
Europe benefits from cultural-site subsidies, yet tepid macro conditions in Germany and France restrain disposable income. Urban renewal programs channel visitors to secondary cities, easing congestion in legacy hubs like Paris and London. The Middle East and South America are earlier-stage but assertive: Dubai Parks and Resorts added a Bollywood zone in 2025 to capture South Asian travelers. Africa’s growth potential hinges on infrastructure investment; operators eye clusters in Egypt, South Africa, and Kenya for long-term positioning.


Competitive Landscape
The recreation services market registers moderate concentration: the top 10 players account for roughly 35-40% of global revenue. Disney, Universal, Merlin Entertainments, Las Vegas Sands, and MGM Resorts anchor this cohort, each leveraging IP, real estate scale, and data analytics to widen moats. Capital requirements north of USD 500 million for marquee assets deter new entrants, though asset-light licensing provides a bridge for regional players.
Technological differentiation is accelerating. Universal’s Epic Universe adopted biometric entry and predictive analytics to steer visitor flow and optimize staffing, demonstrating cost deflation and elevated guest spending. Disney’s 2025 augmented-reality patents foreshadow customizable storylines delivered through personal devices, lifting dwell time and merchandise sales. Data-centric upstarts like Dreamscape and Sandbox VR offer location-based VR attractions with lighter CAPEX, siphoning urban consumers seeking novel night-out options.
Consolidation is set to intensify as smaller parks battle insurance inflation and labor scarcities. Larger groups can absorb these costs, standardize training, and negotiate enterprise-wide sponsorship deals, further uplifting their recreation services market share. IP gatekeepers also wield leverage: holders that once licensed brands now prefer vertical integration, tilting bargaining power away from stand-alone operators.
Recreation Services Industry Leaders
The Walt Disney Company
Universal Destinations & Experiences
Las Vegas Sands Corp.
Merlin Entertainments Group
MGM Resorts International
- *Disclaimer: Major Players sorted in no particular order

Recent Industry Developments
- January 2026: Comcast’s Universal Destinations and Experiences secured final zoning for its USD 4.5 billion Bedford, United Kingdom resort, clearing land preparation to start in Q2 2026.
- December 2025: The Walt Disney Company committed USD 2.2 billion to expand Shanghai Disney Resort with Zootopia and Frozen lands opening in 2028.
- May 2025: Universal opened Epic Universe in Orlando after investing USD 5 billion across five years.
- October 2024: MGM Resorts partnered with Live Nation on a USD 1.5 billion Las Vegas entertainment district.


Research Methodology Framework and Report Scope
Market Definitions and Key Coverage
Our study frames the global recreation services market as all paid facilities and experiences that people select in their free time for amusement, sport, cultural enrichment, or wellness, ranging from theme-park admission and fitness club memberships to live entertainment tickets and guided outdoor activities. Values are expressed in nominal US dollars and cover on-site as well as digitally delivered services where the consumer goal is leisure rather than transport, lodging, or core retail.
Scope exclusion: equipment sales and pure travel packages are left outside the model.
Segmentation Overview
- By Type
- Amusements
- Theme and Water Parks
- Gambling and Casinos
- Cultural and Heritage Attractions (Museums, Galleries, Zoos)
- Sports Facilities and Events
- By Revenue Stream
- Admission / Ticket Sales
- Food and Beverage
- Merchandise and Licensing
- Sponsorship and Advertising
- By Age Group
- Less Than 18 Years
- 18-35 Years
- 36-55 Years
- 55+ Years
- By Mode
- On-Site / Physical
- Online and Virtual Experiences
- By Geography
- North America
- United States
- Canada
- Mexico
- South America
- Brazil
- Argentina
- Rest of South America
- Europe
- United Kingdom
- Germany
- France
- Italy
- Rest of Europe
- Asia-Pacific
- China
- Japan
- India
- South Korea
- Rest of Asia
- Middle East and Africa
- Middle East
- Israel
- Saudi Arabia
- United Arab Emirates
- Turkey
- Rest of Middle East
- Africa
- South Africa
- Egypt
- Rest of Africa
- Middle East
- North America
Detailed Research Methodology and Data Validation
Primary Research
Structured interviews and short surveys were run with park operators, fitness chains, sports event organizers, ticketing platforms, and municipal recreation departments across North America, Europe, and Asia-Pacific. Insights on average spend per visit, utilization rates, and post-pandemic attendance recovery helped us refine assumptions and sanity-check desk findings before numbers were frozen.
Desk Research
Analysts began with publicly available macro-datasets such as the UNWTO tourism barometer, the World Bank household final consumption tables, U.S. BEA Outdoor Recreation Satellite Account, Eurostat cultural attendance surveys, and trade association dashboards from bodies like the International Association of Amusement Parks and Attractions. Company filings, investor decks, and tier-1 news retrieved through Dow Jones Factiva and D&B Hoovers added price points and capacity figures for key operators. Academic journals and patent abstracts supplied context on emerging virtual-reality formats that influence service mix. The sources listed illustrate the breadth consulted; several more were referenced for corroboration and clarification.
Market-Sizing & Forecasting
A top-down reconstruction starts with consumer leisure expenditure pools by country, then isolates the share attributable to recreation services using participation ratios, average ticket yields, and venue day counts; results are cross-verified through selective bottom-up roll-ups of major operator revenues and sampled average selling price times volume checks. Key variables in the model include real disposable income, urbanization, smartphone booking penetration, sporting event attendance, and new attraction pipeline openings, each trended forward through 2030. Multivariate regression, supported by scenario discussions with industry experts, projects the baseline while gap-filling rules smooth regions lacking granular data.
Data Validation & Update Cycle
Outputs pass two analyst layers for variance checks against independent indicators, after which anomalies trigger targeted call-backs. Models refresh every twelve months, and interim flashes are issued when material events, policy shifts, large-scale venue launches, or natural disasters alter demand trajectories.
Why Mordor's Recreation Services Baseline Commands Reliability
Published estimates often diverge because firms draw borders around the leisure universe differently, convert currencies at assorted dates, or let optimistic rebound themes over stretch growth curves.
Key gap drivers include inclusion of media rights and gambling revenue by some publishers, early cut-off years that miss the 2024 recovery bump, and lower refresh cadence leading to stale price assumptions.
Benchmark comparison
| Market Size | Anonymized source | Primary gap driver |
|---|---|---|
| USD 1.39 trn (2025) | Mordor Intelligence | |
| USD 1.72 trn (2025) | Global Consultancy A | Adds sports betting and media rights, relies on revenue allocation ratios without operator validation |
| USD 1.20 trn (2024) | Industry Journal B | Excludes virtual experiences, stops at 2024 base, uses constant price conversion and biennial updates |
These comparisons show that our disciplined scope setting, annual refresh, and dual-track validation give decision-makers a balanced, transparent starting point that can be traced back to clearly stated variables and repeatable steps.


Key Questions Answered in the Report
How large is the recreation services market in 2026?
The recreation services market size reached USD 1.41 trillion in 2026.
What is the expected CAGR through 2031?
Market value is projected to rise at a 6.03% CAGR from 2026 to 2031.
Which segment is growing the fastest?
Online and virtual experiences lead with a forecast 6.92% CAGR.
Why are sponsorship revenues rising?
Brands seek captive audiences, making sponsorship the fastest-growing revenue stream at 6.71% CAGR.
Which region shows the strongest growth outlook?
Asia-Pacific is expected to advance at a 6.54% CAGR through 2031, supported by a growing middle class and tourism infrastructure.
How are operators responding to high CAPEX barriers?
Smaller parks adopt asset-light licensing or sell to larger groups, while major players leverage diversified cash flows to self-finance expansions.
Page last updated on:


