
Reach Stacker Market Size and Share
Market Overview
| Study Period | 2020 - 2031 |
|---|---|
| Market Size (2026) | USD 2.9 Billion |
| Market Size (2031) | USD 3.74 Billion |
| Growth Rate (2026 - 2031) | 5.19 % |
| Fastest Growing Market | Middle East and Africa |
| Largest Market | Asia-Pacific |
| Market Concentration | Low |
Major Players
*Disclaimer: Major Players sorted in no particular order Image © Mordor Intelligence. Reuse requires attribution under CC BY 4.0. |
|
Reach Stacker Market Analysis by Mordor Intelligence
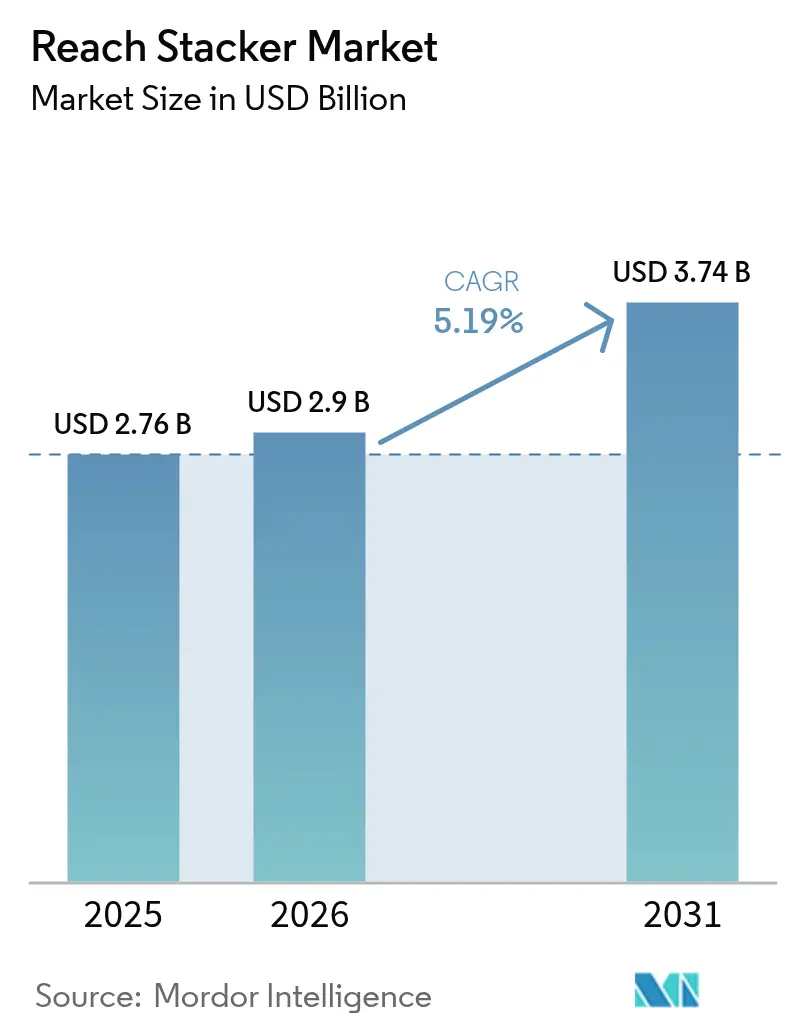
The reach stacker market size was valued at USD 2.76 billion in 2025 and estimated to grow from USD 2.9 billion in 2026 to reach USD 3.74 billion by 2031, at a CAGR of 5.19% during the forecast period (2026-2031). Elevated ship-size trends, coupled with recurring berth congestion, continue to push terminals toward mobile container-handling equipment that can complement fixed cranes during peak demand windows. Simultaneously, the transition from diesel engines to electrified and hydrogen-ready drivetrains is reshaping procurement criteria as operators balance sustainability goals with total cost of ownership targets. Asia-Pacific’s dense port network and automation leadership sustain its dominant share, while record infrastructure outlays across the Middle East and Africa unlock fresh demand nodes. Technology differentiation has moved decisively toward software, and AI-based predictive diagnostics and remote operation platforms are now key purchase influencers alongside lifting capacity and fuel choice.
Key Report Takeaways
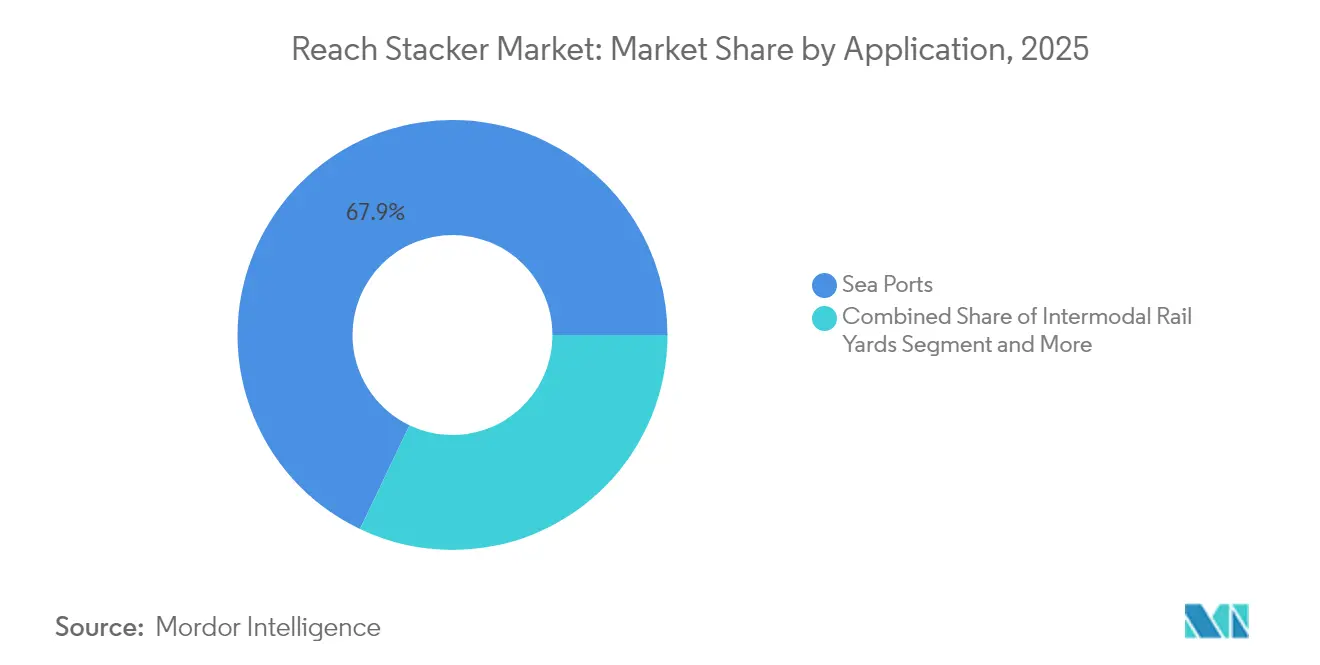
- By application, sea ports held 67.92% of the reach stacker market share in 2025; barge terminals are projected to register the fastest 10.15% CAGR through 2031.
- By tonnage, the 30 to 45 ton class accounted for 53.64% of the reach stacker market size in 2025, while units above 100 tons are set to grow at 7.78% CAGR to 2031.
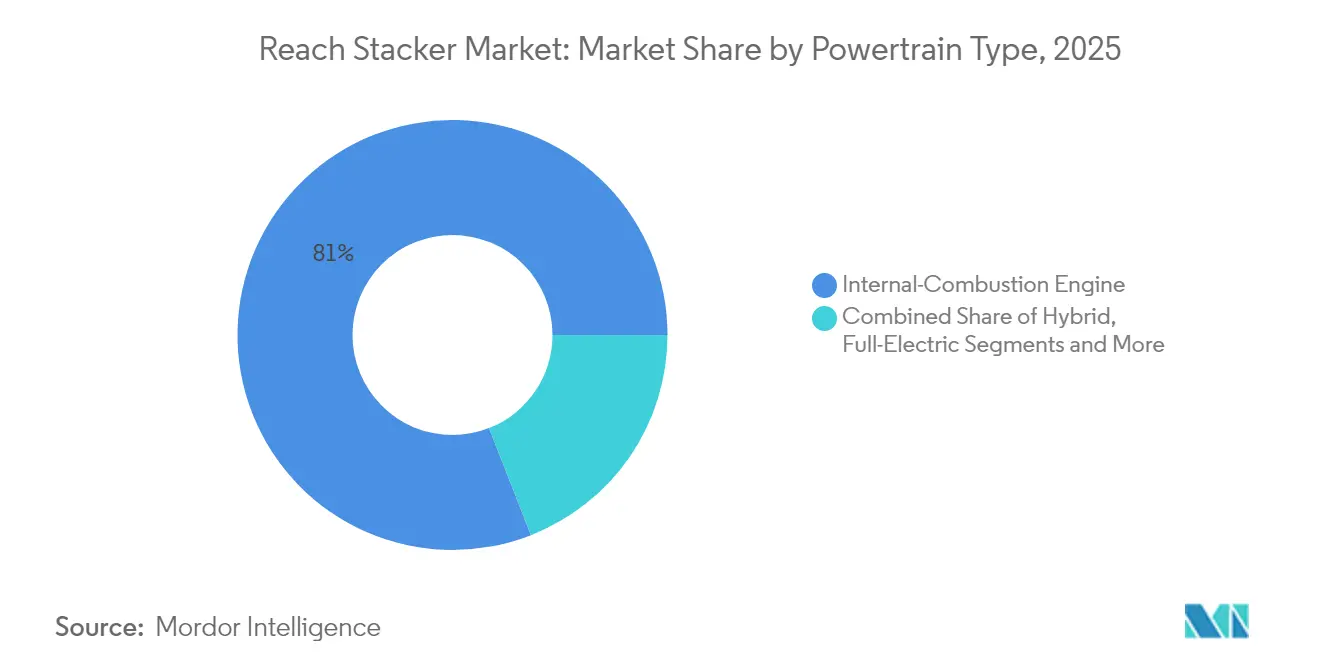
- By powertrain, internal combustion engines commanded an 80.95% share of the reach stacker market size in 2025; electric variants will advance at the highest 21.61% CAGR through 2031.
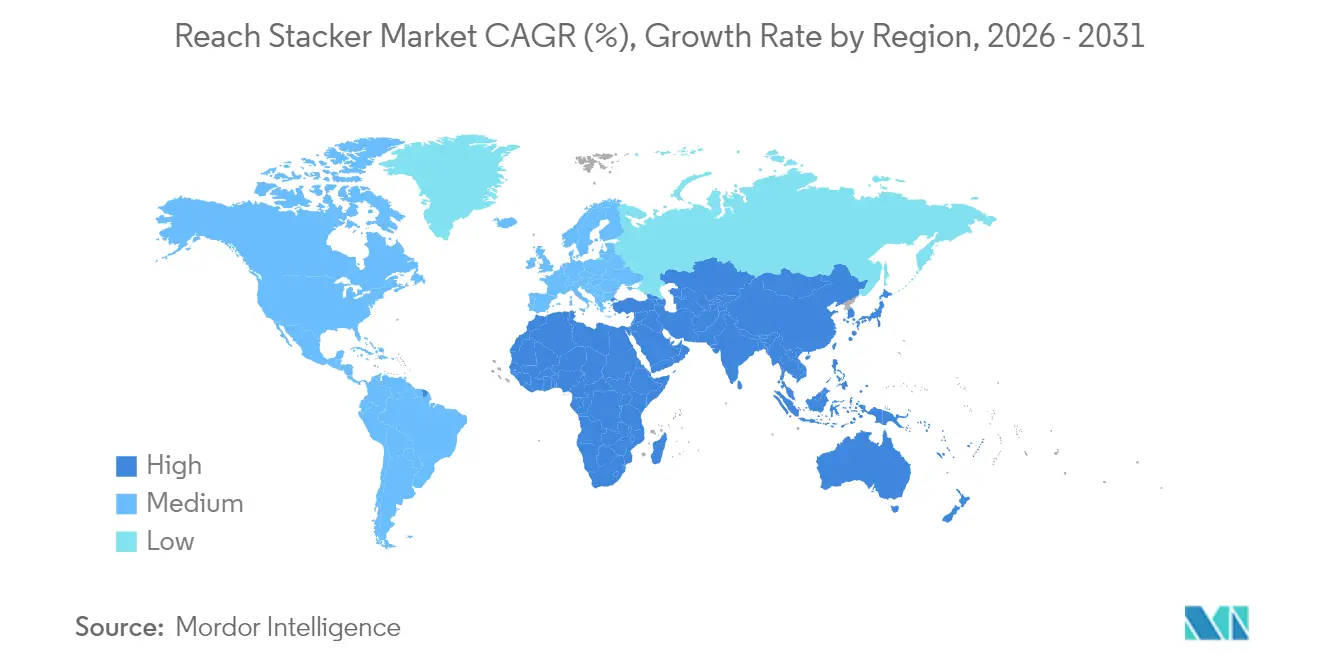
- By geography, Asia-Pacific led with 42.08% revenue of the reach stacker market share in 2025, whereas the Middle East and Africa bloc is forecast to climb fastest at an 8.73% CAGR up to 2031.
Note: Market size and forecast figures in this report are generated using Mordor Intelligence’s proprietary estimation framework, updated with the latest available data and insights as of 2026.
Market Trends and Insights
Drivers Impact Analysis of Reach Stacker Market*
| Driver | (~) % Impact on CAGR Forecast | Geographic Relevance | Impact Timeline |
|---|---|---|---|
| Rapid Container-Traffic Growth at Seaports | +1.2% | Global, with Asia-Pacific Leading Growth | Medium Term (2–4 Years) |
| Accelerated Fleet Electrification to Meet IMO 2030 Targets | +0.8% | Global, EU and North America Early Adopters | Long Term (≥ 4 Years) |
| Intermodal Rail Expansion in Land-Locked Regions | +0.6% | North America, Central Europe, Central Asia | Medium Term (2–4 Years) |
| Port Automation Mandates in EU Fit-for-55 Package | +0.5% | European Union | Medium Term (2–4 Years) |
| AI-Driven Predictive Maintenance Lowering TCO | +0.4% | Developed Markets, Premium Terminals | Short Term (≤ 2 Years) |
| Emergence of Hydrogen Fuel-Cell Powertrains in Heavy-Duty Handling | +0.3% | EU, North America, Japan | Long Term (≥ 4 Years) |
| Source: Mordor Intelligence | |||
Rapid Container-Traffic Growth at Seaports
Global container volumes surged in 2024, with TEU-mile demand rising as Red Sea diversions extended shipping routes and intensified equipment utilization rates. Shanghai Port processed a record 5 million containers in January 2025, while China's top 8 container ports collectively handled 224 million TEU, representing 7% year-over-year growth that outpaced global averages[1] "China’s container volumes surged in 2024", Rebecca Moore, Riviera, rivieramm.com.. This traffic concentration creates equipment bottlenecks at major hubs, driving reach stacker demand as terminals seek flexible container handling solutions that operate independently of fixed crane infrastructure. The Asia-Europe trade lane's resilience despite geopolitical disruptions demonstrates sustained cargo flow momentum. At the same time, emerging markets like Africa show 66.71% growth in equipment demand as regional ports expand capacity to capture diverted volumes[2] "Sany reports 2024 half-year financial results", Anjali Sooknanan, IVT International, ivtinternational.com. . Port congestion patterns suggest that reach stackers' mobility advantage becomes increasingly valuable as terminals optimize yard operations under constrained berth availability.
Accelerated Fleet Electrification to Meet IMO 2030 Targets
The International Maritime Organization's 40% CO2 reduction target by 2030 catalyzes port equipment electrification programs extending beyond ship emissions to encompass terminal operations. Zero Emission Port Alliance (ZEPA) research indicates that battery-electric container handling equipment will comprise over 94% of new purchases from 2031 to 2035, with terminal operators accelerating replacement cycles to meet decarbonization commitments. APM Terminals' deployment of 240 pieces of new container handling equipment, including electric terminal tractors for its first 100% electric terminal in South America, demonstrates the scale of infrastructure transformation underway. The Port of Los Angeles launched the nation's first commercial electric cargo top handlers in 2024, validating zero-emission technology for heavy-duty applications while California's emissions controls require vessel compliance by 2027. However, the transition timeline depends critically on grid infrastructure upgrades, as European transmission networks may require 20-50% capacity expansion by 2040 to support electrification demands.
Intermodal Rail Expansion in Land-locked Regions
Union Pacific's USD 3.4 billion intermodal investment in 2024, including new terminals in Kansas City and Phoenix, reflects the strategic shift toward inland container handling as coastal ports reach capacity constraints[3]"Union Pacific Invests Significantly in Intermodal Service", Inside Track, www.up.com. . BNSF's USD 1.5 billion Barstow Rail Project, targeting 2026 construction for the world's largest intermodal hub, demonstrates the scale of inland infrastructure development that creates new reach stacker deployment opportunities. The Fort Worth Alliance Smart Port received USD 80 million in federal funding for a 32-acre intermodal depot that will double truck traffic by 2035, highlighting how inland terminals serve as pressure release valves for congested coastal facilities. NC Ports' USD 50 million rail infrastructure expansion in Wilmington will triple container-handling capacity and divert 250,000 containers from trucks to rail annually, creating demand for flexible handling equipment to serve both rail and truck interfaces. These developments position reach stackers as critical equipment for intermodal yards that require versatile container handling capabilities across multiple transport modes.
AI-driven Predictive Maintenance Lowering TCO
DP World's AI-powered container-decking tool implementation at its Busan logistics center achieved measurable operational improvements by optimizing equipment utilization and reducing bottlenecks through predictive analytics. Konecranes' Future Fields automation concept integrates AI-driven maintenance scheduling with real-time equipment monitoring, enabling predictive interventions that minimize downtime costs while extending asset lifecycles. Maritime transport research demonstrates that AI-driven predictive maintenance can reduce machinery-related incidents, which represent a significant portion of operational disruptions in port environments. The technology's economic impact extends beyond maintenance savings, as IoT-enabled predictive systems can optimize equipment deployment patterns and reduce idle time through demand forecasting algorithms. However, implementation requires substantial digital infrastructure investments and workforce development to manage AI systems effectively, creating adoption barriers for smaller terminal operators.
Restraints Impact Analysis of Reach Stacker Market*
| Restraint | (~) % Impact on CAGR Forecast | Geographic Relevance | Impact Timeline |
|---|---|---|---|
| Cap-ex Freeze at Emerging-Market Ports Amid Debt Distress | -0.7% | Africa, South America, Southeast Asia | Short Term (≤ 2 Years) |
| Grid-Capacity Bottlenecks for Large-Scale Electric Chargers | -0.6% | Emerging Markets, Older Port Infrastructure | Long Term (≥ 4 Years) |
| Volatile Steel Prices Inflating OEM Costs | -0.5% | Global Manufacturing Hubs | Medium Term (2–4 Years) |
| Skilled-Operator Shortages Slowing Adoption in Africa | -0.4% | Sub-Saharan Africa Primarily | Medium Term (2–4 Years) |
| Source: Mordor Intelligence | |||
Cap-ex Freeze at Emerging-Market Ports Amid Debt Distress
Emerging market ports face mounting capital expenditure constraints as debt servicing costs rise amid elevated interest rates, creating a significant headwind for equipment procurement cycles. The World Bank's infrastructure financing analysis for Egypt highlights complex institutional structures and regulatory barriers that impede private investment in transport sector modernization, patterns that extend across multiple emerging economies. Despite DP World's USD 3 billion African investment commitment through 2029, the company acknowledges high logistics costs and infrastructure gaps that require sustained capital deployment to achieve operational efficiency targets. Port operators in debt-distressed markets increasingly prioritize maintenance of existing equipment over new acquisitions, extending replacement cycles, and deferring technology upgrades that would otherwise drive reach stacker demand. The constraint particularly affects smaller regional ports that lack access to international capital markets, creating a bifurcated market where major hub ports continue investing while secondary facilities postpone modernization programs.
Volatile Steel Prices Inflating OEM Costs
Steel price volatility continues pressuring reach stacker manufacturing costs, these fluctuations create procurement uncertainty for equipment manufacturers who struggle to maintain stable pricing while managing input cost variability across multi-month production cycles. The constraint particularly affects heavy-duty reach stackers in the 45-100 ton and super-heavy categories, where steel content represents a higher proportion of total manufacturing costs than lighter equipment variants. OEMs increasingly implement dynamic pricing mechanisms and raw material surcharges to manage cost volatility, but these strategies can delay customer purchase decisions as buyers await more favorable pricing conditions. The U.S. tariffs on Chinese cargo handling equipment, announced in 2025, add another layer of cost pressure that may accelerate supply chain regionalization while increasing equipment prices for North American buyers.
*Our forecasts treat driver/restraint impacts as directional, not additive. The impact forecasts reflect baseline growth, mix effects, and variable interactions.
Reach Stacker Market Segment Analysis
By Application:
Sea Ports Drive Volume GrowthSeaports command 67.92% market share of the reach stacker market in 2025, reflecting their role as primary container handling hubs where reach stackers provide essential flexibility for yard operations and vessel loading sequences. The segment's dominance stems from increasing vessel sizes that require versatile ground-based equipment to complement fixed crane infrastructure, particularly during peak berthing periods when container throughput demands exceed quay crane capacity. Barge and river terminals represent the fastest-growing application segment at 10.15% CAGR through 2031, driven by inland waterway development programs and intermodal transport expansion that connects coastal ports with interior distribution centers. Inland container depots and dry ports benefit from infrastructure investments like Utah's planned inland terminal and Virginia's port expansion programs, which create new equipment deployment opportunities in landlocked regions.
Industrial applications, including steel, timber, and paper handling, maintain steady demand as manufacturing facilities require specialized container handling capabilities for raw material logistics and finished goods distribution. Intermodal rail yards show accelerating growth as Union Pacific's Kansas City terminal and BNSF's Barstow project demonstrate the scale of inland infrastructure development, with these facilities requiring reach stackers that can efficiently transfer containers between rail cars and truck chassis. The application segmentation reflects broader supply chain evolution toward distributed logistics networks that reduce coastal port congestion while creating new equipment demand centers in previously underserved inland markets.



By Tonnage:
Super-Heavy Units Gain MomentumThe 30 to 45 ton segment maintains market leadership with 53.64% share of the reach stacker market in 2025, representing the optimal balance between operational versatility and capital efficiency for standard container handling operations across diverse port environments. This tonnage range accommodates most container weights while providing sufficient lifting capacity for stacked operations, making it the preferred choice for terminals with mixed cargo profiles and varying operational requirements. However, the super-heavy segment above 100 tons demonstrates the strongest growth trajectory at 7.78% CAGR through 2031, driven by automated terminal requirements and larger vessel operations that demand higher-capacity equipment for efficient container stacking and retrieval operations.
The less than 30-ton segment serves specialized applications including empty container handling and light cargo operations, while the 45 to 100-ton category addresses heavy container applications and high-density stacking requirements in space-constrained terminals. China's container port automation leadership, with 52 automated terminals achieving record efficiency levels, creates demand for super-heavy reach stackers that can integrate with automated systems while handling the increased container weights associated with modern logistics operations. The tonnage segmentation evolution reflects terminal operators' strategic shift toward higher-capacity equipment that can handle growing container sizes and weights while supporting automated operations that require precise positioning capabilities.
By Powertrain Type:
Electric Transition AcceleratesInternal combustion engines retain 80.95% market share of the reach stacker market in 2025, reflecting the installed base of diesel-powered equipment and the operational reliability requirements of continuous port operations, where refueling infrastructure remains more accessible than charging systems. However, electric powertrains exhibit the highest growth velocity at 21.61% CAGR through 2031, supported by regulatory mandates and technological advances that address range and charging constraints previously limiting electric adoption in heavy-duty applications. The Port of Los Angeles' deployment of the nation's first commercial electric cargo top handlers validates zero-emission technology for intensive port operations, while Hyster's hydrogen fuel cell reach stackers at Valencia and Los Angeles ports demonstrate alternative pathways for decarbonization.
Hybrid diesel-electric systems provide transitional technology that combines operational flexibility with reduced emissions, appealing to operators who require extended operating ranges while meeting intermediate sustainability targets. Hydrogen fuel cell powertrains represent the emerging frontier for heavy-duty applications, with successful deployments at Hamburg and California ports proving commercial viability for intensive container handling operations. ZEPA's projection that 94% of container handling equipment purchases will be battery-electric by 2035 indicates the pace of powertrain transformation. However, grid infrastructure constraints may moderate adoption timelines in emerging markets with limited electrical capacity.
Geography Analysis
APAC Reach Stacker Market
Asia-Pacific carried a 42.08% share of the reach stacker market in 2025, anchored by China’s 224 million TEU throughput at its top eight ports and continuing capacity additions across Indonesia, India, and Vietnam. The region’s early adoption of port automation, led by Shanghai’s yard robots, accelerates upgrades toward sensor-rich and sometimes driver-optional reach stackers that harmonize with gate-to-quay digital workflows. Japanese ports have begun hydrogen fuel-cell pilot programs for rubber-tired gantries, reinforcing a broader ecosystem shift toward alternative power sources in Asia.
MEA Reach Stacker Market
The Middle East and Africa will post the fastest 8.73% CAGR, underwritten by Saudi Arabia’s Vision 2030 logistics outlay exceeding USD 106.6 billion and DP World’s USD 3 billion African port expansion drive. Projects such as NEOM’s fully automated crane installation and Jeddah Islamic Port’s USD 240 million logistics park exemplify how the region is leap-frogging legacy yard designs and specifying high-capacity electric or hybrid reach stackers from inception. Capacity gaps in grid infrastructure and shortages of certified operators could temper the adoption slope, yet state-backed financing vehicles are helping expedite equipment procurement despite near-term fiscal constraints.
North America and Europe Reach Stacker Market
North America presents a mature yet tech-intensive landscape driven by intermodal rail spending and strict emissions regulations. Union Pacific’s and BNSF’s mega-hubs are set to anchor inland demand, while California’s port authorities mandate zero-emission terminal equipment by 2035, foreshadowing large replacement orders for electric reach stackers. Europe’s market, shaped by Fit-for-55 and port automation imperatives, is shifting toward battery swap systems and remote-driven fleets, fostering collaboration between OEMs and software firms to meet escalating performance benchmarks. The combined influence of these developed regions on specification standards reverberates globally, often dictating product design norms that cascade into emerging markets.

Regulatory Landscape
Reach stackers sit at the overlap of off-road equipment rules, workplace safety requirements, and road-circulation approvals when machines travel on public roads. In the European Union, Regulation (EU) 2025/14 (published January 2025) established a type-approval framework for mobile machinery circulation on public roads, with application provisions starting January 29, 2028 and transition periods extending through 2036, affecting documentation and configuration planning for multi-country fleet deployments.
Safety and conformity requirements continue to tighten around machine design and operator protection. The EU Machinery Regulation applies from January 20, 2027, driving OEM emphasis on digital instructions, cybersecurity, and autonomous functions, as highlighted by AEM discussions in 2026. Globally, ISO standards used for design verification and procurement specifications were refreshed with ISO 22915-8:2026 and ISO 22915-13:2026 for stability testing, alongside ISO 3691-2:2023 for industrial variable-reach trucks. In the United States, reach stackers are classified as powered industrial trucks under OSHA 29 CFR 1910.178 (training and safe operation requirements), while certain marine-terminal certification provisions do not apply, shifting compliance responsibilities across ports and intermodal yards.
Value Chain Analysis
The reach stacker value chain begins with high-value inputs such as fabricated steel structures, diesel engines or electric drivetrains, power electronics, batteries, hydraulics, tires, and embedded control systems. OEMs (including Kalmar, Konecranes, Hyster-Yale, and regional Chinese manufacturers) increasingly differentiate through modular product architectures and software stacks, such as remote diagnostics, predictive maintenance, and terminal operating system integration. As electrification scales, upstream dependency shifts toward battery cells, thermal management, and charging interfaces, increasing the role of qualified electrical component suppliers and local service capability.
Manufacturing and final assembly are also being regionalized to reduce delivery times and mitigate trade and tariff exposure, including Kalmar supplying electric reach stacker orders from its expanded Shanghai manufacturing plant in June 2026. Distribution typically follows direct OEM sales to large terminal operators, with dealers or integrators serving smaller ports, inland container depots, and industrial yards. Aftermarket parts, uptime contracts, and software subscriptions are taking on larger shares of lifecycle revenue. On the demand side, procurement is increasingly bundled with charging infrastructure, yard digitalization, and operator training, while trade measures such as Section 301-related tariff pressures in the United States push some buyers to diversify sourcing and favor locally supported configurations.
Competitive Landscape
The reach stacker market exhibits moderate fragmentation with established European and American manufacturers competing against emerging Chinese players who leverage cost advantages and domestic market scale. Market concentration remains distributed across regional leaders, with Kalmar Corporation, Konecranes, and Hyster-Yale, Inc. maintaining technology leadership in developed markets while Shanghai Zhenhua Heavy Industries Company Limited (ZPMC), SANY Group, and other Chinese manufacturers expand global footprints through competitive pricing and expanding product portfolios.
Strategic differentiation increasingly centers on electrification capabilities and autonomous integration, as evidenced by Konecranes' acquisition of Peinemann Port Services to accelerate battery-powered vehicle transitions in Rotterdam and Taylor Machine Works' partnership with Proterra for port electrification programs. Technology adoption patterns reveal competitive advantages shifting toward software integration and predictive maintenance capabilities, with companies like DP World implementing AI-powered container-decking tools that optimize equipment utilization while reducing operational bottlenecks.
White-space opportunities emerge in hydrogen fuel cell applications and super-heavy tonnage segments, where established players like Hyster demonstrate commercial viability through successful deployments at Valencia and Los Angeles ports. The Taylor Group's acquisition of 85% of CVS Ferrari, valued for its mobile container handling expertise and digital integration capabilities, exemplifies consolidation strategies that combine operational know-how with technological advancement. Emerging disruptors include automation specialists and electric powertrain developers who partner with traditional OEMs to accelerate technology integration while avoiding capital-intensive manufacturing investments.
Reach Stacker Industry Leaders
-
Konecranes
-
Liebherr Group
-
CVS FERRARI S.P.A.
-
Kalmar Corporation
-
SANY Group
- *Disclaimer: Major Players sorted in no particular order

Reach Stacker Market Companies Covered in this Report
- Kalmar Corporation
- Konecranes Inc.
- Hyster-Yale, Inc.
- Liebherr Group
- SANY Group
- CVS FERRARI S.P.A.
- Terex Corporation
- Toyota Material Handling International
- Shanghai Zhenhua Heavy Industries Company Limited (ZPMC)
- Dalian forklift Co., Ltd.
- Hoist Material Handling, Inc.
- Valla Cranes
- Taylor Group
- FTMH S.P.A.
- SENNEBOGEN
- Linde Material Handling
- Anhui Heli Co., Ltd.
- SVETRUCK AB
- Komatsu Utility Co., Ltd.

Market Opportunities and Future Outlook
Electrification-linked replacement demand and new port and inland node build-outs are creating near-term whitespace for OEMs that can provide complete solutions, including equipment, charging, and digital fleet tools. Specific examples include Tuticorin Container Terminal commissioning an electric reach stacker in August 2024 and CONCOR commissioning two electric reach stackers in June 2026, showing adoption progressing from pilots to routine terminal operations. For customers that are not ready for full battery-electric deployment due to grid limits, operators are also adding alternative decarbonization pathways, such as HVO-compatible operations, illustrated by Bertschi adding a refueling station for reach stackers using sustainable HVO fuel at its Rotterdam terminal expansion completed in December 2024.
Capacity expansions and concession-led terminal investment continue to generate orders for reach stackers and related container-handling equipment, especially in high-throughput hubs and fast-growing gateways. APM Terminals expansion activity at the Port of Salalah, tied to a USD 300 million investment and including additional reach stackers (February 2025), underscores how terminal capacity projects translate into equipment demand. Product strategy opportunities also center on compliance-ready, upgradeable platforms as safety, cybersecurity, and digital documentation requirements tighten, with OEMs responding through modular designs such as Konecranes Generation D (introduced at TOC Europe in May 2026). Meanwhile, software-enabled uptime offerings and semi-automation features such as positioning assistance, collision avoidance, and remote diagnostics provide differentiation for operators managing congestion, labor constraints, and higher utilization cycles.
Recent Industry Developments in Reach Stacker Market
- June 2026: Kalmar expanded its Shanghai manufacturing plant to increase capacity for electric reach stackers, enabling multi-unit orders for regional terminals. The expansion supports faster lead times and aligns with regional electrification programs in Asia.
- May 2026: Konecranes unveiled its modular Generation D lift truck platform at TOC Europe in Hamburg, launching new diesel and electric reach stacker models for global ordering. The platform reduces configuration complexity and standardizes electronics and software interfaces across variants, supporting fleet-wide diagnostics and easier upgrades.
- June 2024: Konecranes booked an order for five reach stackers and six empty container handlers for a container terminal in the Republic of the Congo. The multi-unit fleet order reflects ongoing equipment modernization in African terminals where throughput and yard efficiency upgrades are priorities. It also expands the installed base for OEM aftermarket, parts, and service contracts in emerging port networks.


Reach Stacker Market Report Scope and Research Methodology
Market Definition and Coverage
This market covers the revenue generated from reach stackers used to lift, move, and stack intermodal containers and related cargo in ports, inland terminals, rail yards, and industrial sites, covering both new equipment sales and delivered systems value.
Scope exclusions: Used equipment resale, routine repair labor, and general port infrastructure projects are excluded from this sizing.
Segments Covered in This Report
-
By Application
- Sea Ports
- Inland Container Depots/Dry Ports
- Intermodal Rail Yards
- Barge and River Terminals
- Industrial (Steel, Timber, Paper, Etc.)
-
By Tonnage
- Less Than 30 Ton (Low)
- 30 to 45 Ton (Medium)
- 45 to 100 Ton (High)
- More Than 100 Ton (Super-Heavy)
-
By Powertrain Type
- Internal-Combustion Engine
- Hybrid (Diesel-Electric)
- Full-Electric
- Hydrogen Fuel Cell
-
By Geography
-
North America
- United States
- Canada
- Rest of North America
-
South America
- Brazil
- Argentina
- Rest of South America
-
Europe
- Germany
- United Kingdom
- France
- Italy
- Spain
- Netherlands
- Rest of Europe
-
Asia-Pacific
- China
- India
- Japan
- South Korea
- Rest of Asia-Pacific
-
Middle East and Africa
- Saudi Arabia
- United Arab Emirates
- Egypt
- Turkey
- South Africa
- Rest of Middle East and Africa
-
North America
Data Sources, Market Sizing, and Validation
Desk Research
For desk research, we first mapped the demand environment around container flows and terminal investment cycles, then used it to frame where reach stackers are actually deployed. Public sources such as UNCTAD port and maritime statistics, World Bank logistics indicators, IMO emissions and fuel transition documents, and national port authority throughput releases were reviewed to set realistic volume signals by region.
To connect these signals to market value, we used manufacturer annual reports, investor presentations, and earnings call notes to understand product mix and pricing direction, and we checked trade and customs publications where they help explain equipment import patterns. Patent databases were also used to track activity in hybrid and full electric drivetrains and spreader systems, which helps interpret where higher ASPs are more likely. This list is illustrative only, and many other public sources were used for data collection, cross-checks, and clarification.
Primary Interviews and Surveys
Primary work was used to pressure-test the desk view and fill in gaps that are hard to confirm from public documents, especially around replacement timing and the premium for alternative powertrains. Interviews and surveys were split across OEM and dealer roles, terminal operators, fleet managers, and service partners, with coverage across APAC, EMEA, and the Americas so the model reflects different utilization patterns and procurement cycles.
Distribution of primary research fieldwork respondents
| Company type | Respondent position | Region |
|---|---|---|
| Top tier: 36% | CXOs: 13% | APAC: 52% |
| Mid tier: 45% | Functional/Unit leaders: 42% | EMEA: 29% |
| Smaller Players: 19% | Managers: 45% | Americas: 19% |
Market-Sizing & Forecasting
Sizing starts with a top-down build where container handling activity is converted into an addressable equipment demand pool, then filtered by reach stacker suitability across terminals and inland yards. The model uses practical inputs such as container throughput growth, terminal expansion and modernization cycles, estimated fleet replacement age, the share of operations shifting to hybrid or full electric units, and observed ASP differences by tonnage band and application.
Once the demand pool is built, it is checked using selective bottom-up approximations, such as sampled unit shipments from channels, fleet counts discussed by operators, and ASP x volume sanity checks for key regions. Where unit visibility is limited, gaps are handled using bounded ranges from interviews, then tightened through throughput and utilization constraints so totals stay realistic. Forecasting is completed using scenario analysis tied to macro drivers (trade growth and port capex) and a simple regression check on throughput and replacement cycle assumptions to keep the trajectory stable.
Data Validation & Update Cycle
Validation is done through multiple passes where totals are compared against independent signals, then reviewed again at segment and regional levels. We check for anomalies like sudden ASP jumps without matching powertrain mix shifts, or unit growth that exceeds what throughput and fleet turnover can support, and those cases are reworked before sign-off.
Reports are refreshed annually, and interim updates are triggered when material events occur, such as sharp currency moves, major policy changes affecting diesel equipment, or unexpected shifts in terminal investment. Before delivery, a final analyst pass is completed so the latest public data and interview feedback are reflected in the numbers clients receive.
Mordor Intelligence's Reach Stacker Market Estimate Compared With Other Published Estimates
Published market sizes for reach stackers can differ even when the topic looks the same, because each publisher draws the boundary in a slightly different place and uses different timing for key inputs. Differences usually come down to what is counted as market revenue, how pricing is treated, and whether forecasts lean conservative or aggressive.
A common gap driver is how ASPs are updated over the forecast window, since price changes can be driven by higher tonnage mixes, electrification premiums, and shifting regional demand, rather than broad inflation alone. Another driver is currency timing and refresh cadence, where late-year price checks and variance reviews keep the result aligned to procurement reality, and that discipline is applied by Mordor Intelligence.
Benchmark comparison
| Source | Market Size | Gaps in Research Methodology |
|---|---|---|
| Mordor Intelligence | USD 2.90 B (2026) | |
| Global Consultancy A | USD 2.55 B (2026) | Uses a more conservative ASP progression and keeps a heavier weight on diesel-only units, which can understate mix-driven price uplift in electrifying yards. |
| Industry Association B | USD 3.15 B (2026) | Appears to include adjacent container handling equipment revenue and broader terminal vehicle categories, which expands the scope beyond dedicated reach stackers. |
The spread across published values is mainly explained by how tightly the market boundary is drawn and how price is carried forward through the forecast period. By tying growth to throughput, replacement timing, and realistic ASP movements, the estimate remains traceable to measurable operating signals and repeatable checks.


Key Questions Answered in the Report
What is the current size of the reach stacker market?
The market is valued at USD 2.9 billion in 2026 and is projected to reach USD 3.74 billion by 2031.
Which application segment dominates reach stacker demand?
Sea-port operations lead with 67.92% market share in 2025.
How fast is the electric reach stacker segment growing?
Electric models are expected to grow at a 21.61% CAGR between 2026 and 2031.
Which region is expanding the quickest?
The Middle East & Africa region is forecast to grow at an 8.73% CAGR through 2031.
What role does AI play in reach stacker operations?
Predictive maintenance and yard-planning algorithms are reducing downtime and boosting equipment utilization, thereby lowering total cost of ownership for operators.
Page last updated on:





