Pupillometer Market Size and Share
Market Overview
| Study Period | 2020 - 2031 |
|---|---|
| Forecast Data Period | 2026 - 2031 |
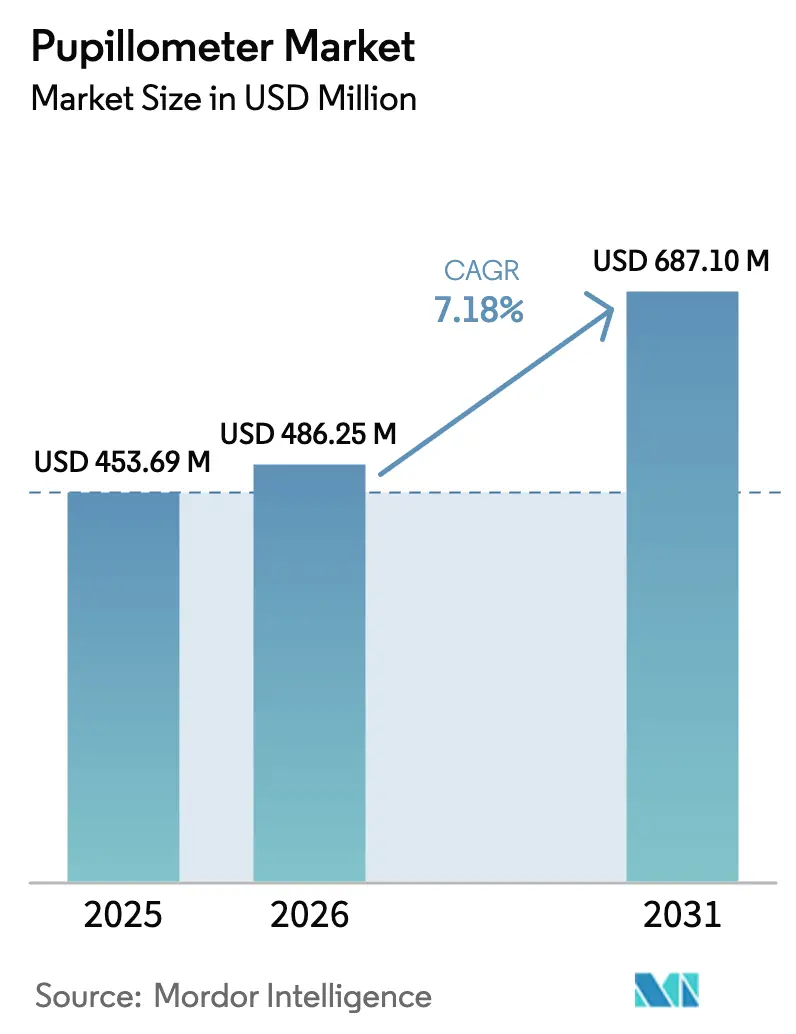
| Market Size (2026) | USD 486.25 Million |
| Market Size (2031) | USD 687.1 Million |
| Growth Rate (2026 - 2031) | 7.18% CAGR |
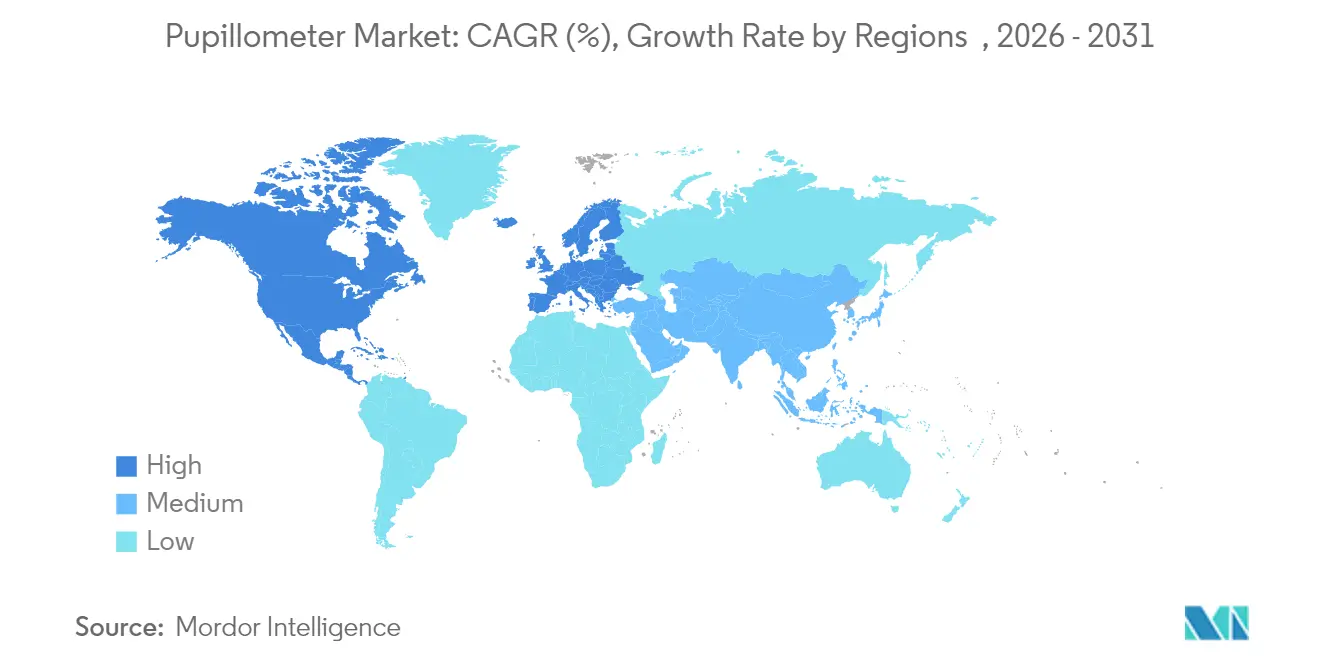
| Fastest Growing Market | Asia-Pacific |
| Largest Market | North America |
Major Players *Disclaimer: Major Players sorted in no particular order Image © Mordor Intelligence. Reuse requires attribution under CC BY 4.0. | |
Pupillometer Market Analysis by Mordor Intelligence
The pupillometer market size was valued at USD 453.69 million in 2025 and estimated to grow from USD 486.25 million in 2026 to reach USD 687.1 million by 2031, at a CAGR of 7.18% during the forecast period (2026-2031). Rapid adoption of quantitative pupillometry in trauma centers and intensive care units is widening clinical acceptance, while the fusion of infrared optics with AI algorithms is shrinking assessment time from minutes to seconds, boosting critical-care responsiveness. Original equipment manufacturers (OEMs) are embedding secure cloud connectivity that streams de-identified pupillary metrics to electronic health records, aiding trend analysis and early neurological intervention. Sports medicine, defense healthcare, and tele-neurology are opening new addressable volumes as portable and smartphone-based devices allow field deployment. Meanwhile, reimbursement ambiguity and clinician training gaps continue to temper near-term uptake despite clear evidence of outcome improvement.
Key Report Takeaways
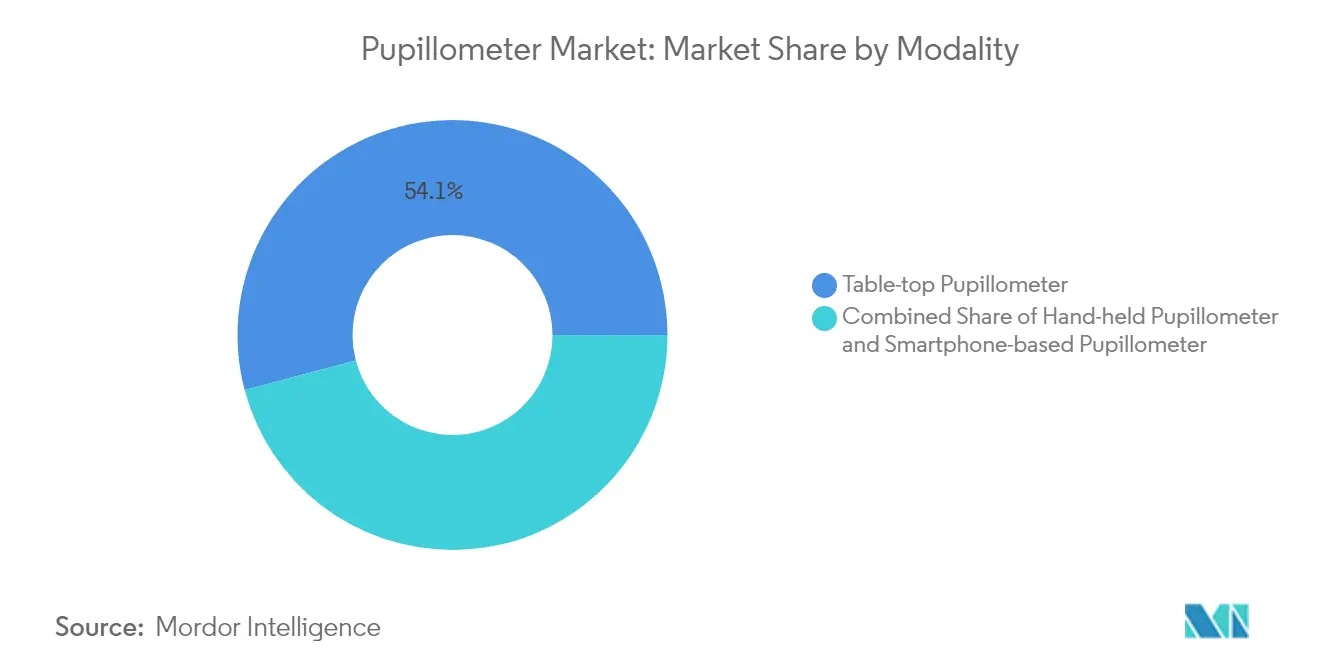
- By modality, table-top systems led with 54.12% revenue share in 2025; hand-held devices are forecast to expand at a 7.72% CAGR through 2031.
- By type, video technology captured 51.62% of the pupillometer market share in 2025, while digital infrared systems are growing at 7.89% CAGR.
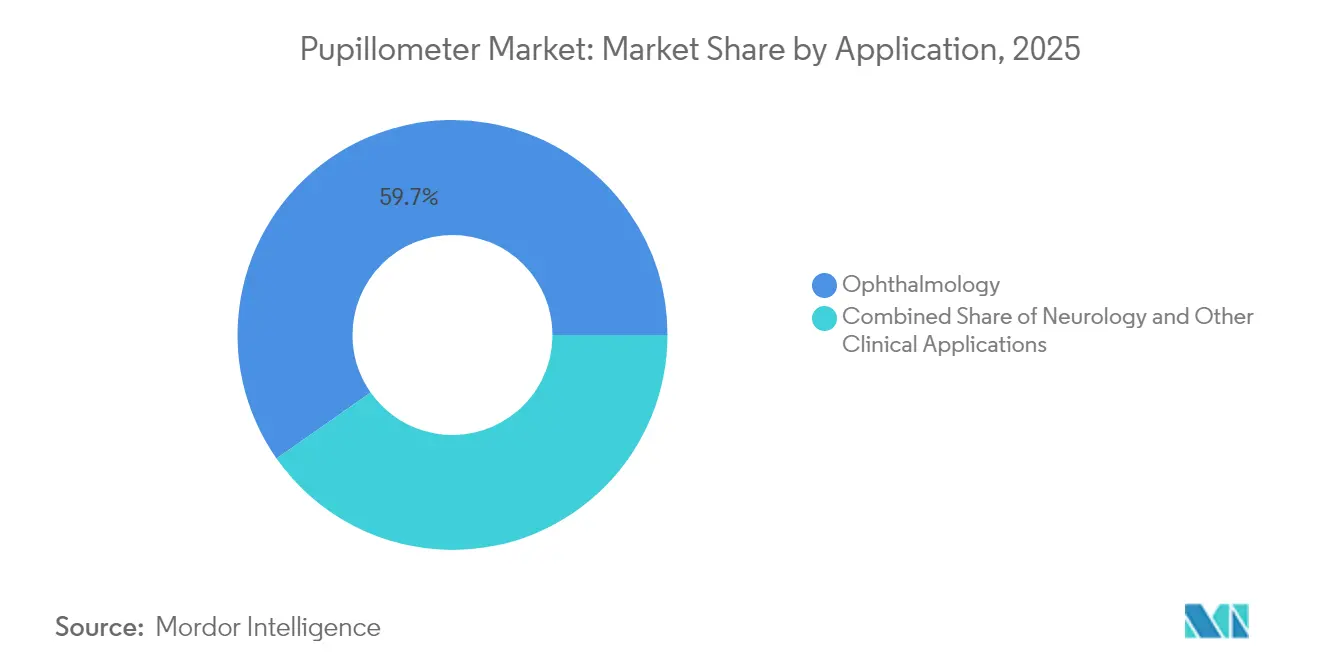
- By application, ophthalmology accounted for 59.74% share of the pupillometer market size in 2025; neurology applications are advancing at an 8.19% CAGR to 2031.
- By end user, hospitals retained 58.56% share in 2025; eye clinics and vision centers are set to grow at an 8.33% CAGR through 2031.
- Regionally, North America dominated with 42.75% share in 2025; Asia-Pacific is the fastest-growing region at an 8.53% CAGR.
Note: Market size and forecast figures in this report are generated using Mordor Intelligence’s proprietary estimation framework, updated with the latest available data and insights as of 2026.
Global Pupillometer Market Trends and Insights
Drivers Impact Analysis*
| Driver | (~) % Impact on CAGR Forecast | Geographic Relevance | Impact Timeline |
|---|---|---|---|
| Rise in awareness & technological advances in quantitative pupillometry | +1.8% | Global, with North America & Europe leading adoption | Medium term (2-4 years) |
| Growing prevalence of neuro-critical care & TBI cases | +1.5% | Global, concentrated in regions with aging populations | Long term (≥ 4 years) |
| Increasing adoption for glaucoma & refractive-surgery screening | +1.2% | APAC core, spill-over to North America & Europe | Medium term (2-4 years) |
| Integration into AI-enabled ophthalmic diagnostics | +1.0% | North America & EU, expanding to APAC | Long term (≥ 4 years) |
| Expansion of point-of-care & tele-neurology platforms | +0.8% | Global, with rural and underserved areas prioritized | Short term (≤ 2 years) |
| Use in sports concussion & battlefield triage protocols | +0.6% | North America & EU, military applications global | Medium term (2-4 years) |
| Source: Mordor Intelligence | |||
Rise in Awareness & Technological Advances in Quantitative Pupillometry
Clinicians are shifting from subjective flashlight checks to algorithm-driven Neurological Pupillary Index (NPi) readings that correlate tightly with intracranial pressure changes. Real-time analytics now quantify constriction velocity and dilation lag across diverse iris pigmentations. Portable devices equipped with infrared LEDs fit emergency carts and ambulances, widening the pupillometer market in pre-hospital triage. Cloud dashboards plot longitudinal pupil trends, flagging subclinical neurological shifts up to 4 hours earlier than Glasgow Coma Scale variations. Such objective metrics are convincing payers to pilot outcome-based reimbursement models in high-acuity settings.
Growing Prevalence of Neuro-Critical Care & TBI Cases
Global TBI rates remain elevated in aging populations and contact-sport participants, spurring hospitals to add handheld units across trauma bays. Military medics employ ruggedized devices during battlefield triage, where a 30-second pupil scan informs evacuation priority. Cardiac arrest teams use pupillometry for prognostication within the first 24 hours post-ROSC, trimming ICU length of stay when poor neurological outcomes are predicted early. The expanding evidence base positions the pupillometer market for deeper penetration into comprehensive stroke centers and concussion clinics.
Increasing Adoption for Glaucoma & Refractive-Surgery Screening
Ophthalmologists integrate quantitative pupil analysis to detect retinal ganglion cell dysfunction before visual field loss manifests. Refractive-surgery centers map scotopic and photopic pupil diameters to refine LASIK optical zone design, reducing night-vision complaints. Smartphone-based pupillometers paired with AI grading let outreach programs screen rural populations in minutes, a development accelerating Asia-Pacific volume growth. Pupil metrics also aid diabetic retinopathy risk stratification, merging eye care with chronic disease management.
Integration into AI-Enabled Ophthalmic Diagnostics
Machine-learning models now detect subtle relative afferent pupillary defects with clinician-level accuracy. EHR-linked dashboards chart month-on-month NPi shifts, helping neurologists adjust therapy in real time. Virtual-reality headsets embed eye-tracking sensors that perform covert pupillometry during cognitive tests, blending neurology and mental-health evaluation. Multi-modal platforms combine optical coherence tomography, visual-field data, and pupil metrics, generating 360-degree ocular-neuro profiles that support precision medicine.
Restraints Impact Analysis*
| Restraint | (~) % Impact on CAGR Forecast | Geographic Relevance | Impact Timeline |
|---|---|---|---|
| High acquisition cost & limited reimbursements | -1.2% | Global, particularly affecting emerging markets | Short term (≤ 2 years) |
| Shortage of clinicians trained in neuro-ophthalmic interpretation | -0.8% | Global, with rural areas most affected | Long term (≥ 4 years) |
| Regulatory uncertainty for software-as-medical-device algorithms | -0.6% | North America & EU, expanding to APAC | Medium term (2-4 years) |
| Data-privacy concerns over cloud-based pupil recordings | -0.4% | Global, with EU GDPR compliance most stringent | Short term (≤ 2 years) |
| Source: Mordor Intelligence | |||
High Acquisition Cost & Limited Reimbursements
Capital-intensive units price above USD 20,000, deterring smaller clinics where billing codes remain ambiguous [1]F. Gupta, “Clinical Codes Lacking for Pupillometry,” Aetna Clinical Policy Bulletin, aetna.com. Absence of a dedicated CPT code forces bundling under general eye exams, cutting cost recovery by up to 40%. Service contracts, software licenses, and staff training push total cost of ownership higher. Emerging smartphone alternatives come in below USD 1,000 and threaten to erode premium hardware margins while broadening the pupillometer market footprint among cost-conscious providers.
Shortage of Clinicians Trained in Neuro-Ophthalmic Interpretation
Global neuro-ophthalmology fellowships number fewer than 50 annually, constraining expertise pipelines. Complex pupil physiology demands multidisciplinary knowledge that generalists often lack. Rural hospitals therefore under-utilize installed devices, lowering return on investment. Cloud-based AI analytics that supply auto-generated interpretations will be pivotal to scaling usage beyond tertiary centers.
*Our forecasts treat driver/restraint impacts as directional, not additive. The impact forecasts reflect baseline growth, mix effects, and variable interactions.
Segment Analysis
By Modality: Portability Catalyzes Hand-Held Uptake
Hand-held devices are moving the pupillometer market forward with a 7.72% CAGR as emergency departments and athletic programs favor lightweight designs that run an entire shift on a single charge. Table-top systems still secure 54.12% of 2025 revenue by integrating seamlessly into ICU monitoring arrays, offering multi-parameter analytics alongside vital signs.
Advances in lithium-ion batteries and miniaturized optics are shrinking unit weight below 300 grams, allowing first responders to capture pupillary metrics mid-transport. Table-top platforms increasingly bundle AI dashboards that push alerts to neurologists’ smartphones, retaining relevance despite their stationary footprint. Market entrants leveraging smartphone chassis bypass proprietary hardware costs, signaling a future where mobility defines competitive edge.


By Type: Video Leads, Infrared Accelerates
Video units accounted for 51.62% pupillometer market share in 2025, reflecting widespread hospital protocols that require high-frame-rate recordings for medico-legal documentation. Digital infrared devices are gaining at an 7.89% CAGR as sensor fidelity now compensates for iris pigmentation variance.
High-resolution video streams allow frame-by-frame review of constriction dynamics, benefitting teaching hospitals that archive de-identified clips for AI model training. Infrared units excel under ambient-light fluctuations, supporting rural outreach vans where dark room conditions are hard to maintain. Hybrid products combining video and infrared tracking are slated for launch in 2026, aiming to unify best-in-class features while expanding the pupillometer market size across both acute and ambulatory settings.
By Application: Neurology Outpaces Ophthalmology
Ophthalmology sustained 59.74% of 2025 revenue, yet neurology is climbing fastest at 8.19% CAGR as TBI screening protocols standardize objective pupil checks. The pupillometer market size for neurology-specific usage is projected to reach USD 193.6 million by 2031, underpinned by sports-concussion mandates.
Cardiac ICUs are embedding NPi alerts into code-blue dashboards, letting intensivists track recovery trajectories post-resuscitation. Ophthalmology continues leveraging pupil metrics for glaucoma detection, but integrated AI decision support now shortens chair time by 15%, freeing capacity for higher-margin surgical consults. Cross-disciplinary adoption underscores the expanding clinical canvas for quantitative pupillometry.
By End User: Vision Centers Close the Gap
Hospitals led spending with 58.56% in 2025; however, eye clinics and vision centers are adding units at an 8.33% CAGR. Their share of the pupillometer market size is forecast to climb to USD 228.4 million by 2031 as LASIK volumes rebound.
Retail optical chains pilot kiosk-based pupil exams that funnel glaucoma suspects into affiliated ophthalmology practices, demonstrating new retail–clinical synergies. Teaching hospitals deploy multi-unit fleets covering neuro-trauma, anesthesia, and stroke units, ensuring round-the-clock availability. Meanwhile, military clinics integrate ruggedized models into battlefield telehealth kits, highlighting the technology’s versatility across end-user segments.
Geography Analysis
North America retained 42.75% of global revenue in 2025 as FDA Class I classification minimizes regulatory overhead, accelerating hospital procurement cycles . Multi-center trials funded by the National Institutes of Health continue to validate new AI algorithms, reinforcing payer confidence. Collegiate athletics increasingly require baseline pupil scans, creating incremental device placements outside traditional hospital settings.
Asia-Pacific is set to register the swiftest trajectory at an 8.53% CAGR through 2031. High myopia prevalence and growing neurologic disease burden are compelling governments to subsidize early-detection technologies. Private ophthalmology chains in India and China are bundling pupil analytics with cataract and refractive packages to differentiate service offerings. Domestic startups are also entering the pupillometer market with low-cost smartphone adaptors, intensifying price competition.
Europe continues to capitalize on cohesive regulatory pathways under the Medical Device Regulation, facilitating faster rollouts of digital infrared innovations. Aging demographics drive elevated glaucoma incidence, sustaining device demand across public hospitals and private clinics. Cross-border telemedicine initiatives linking rural Baltic clinics with neuro-ophthalmology hubs in Germany exemplify collaborative deployment models that extend diagnostic reach.

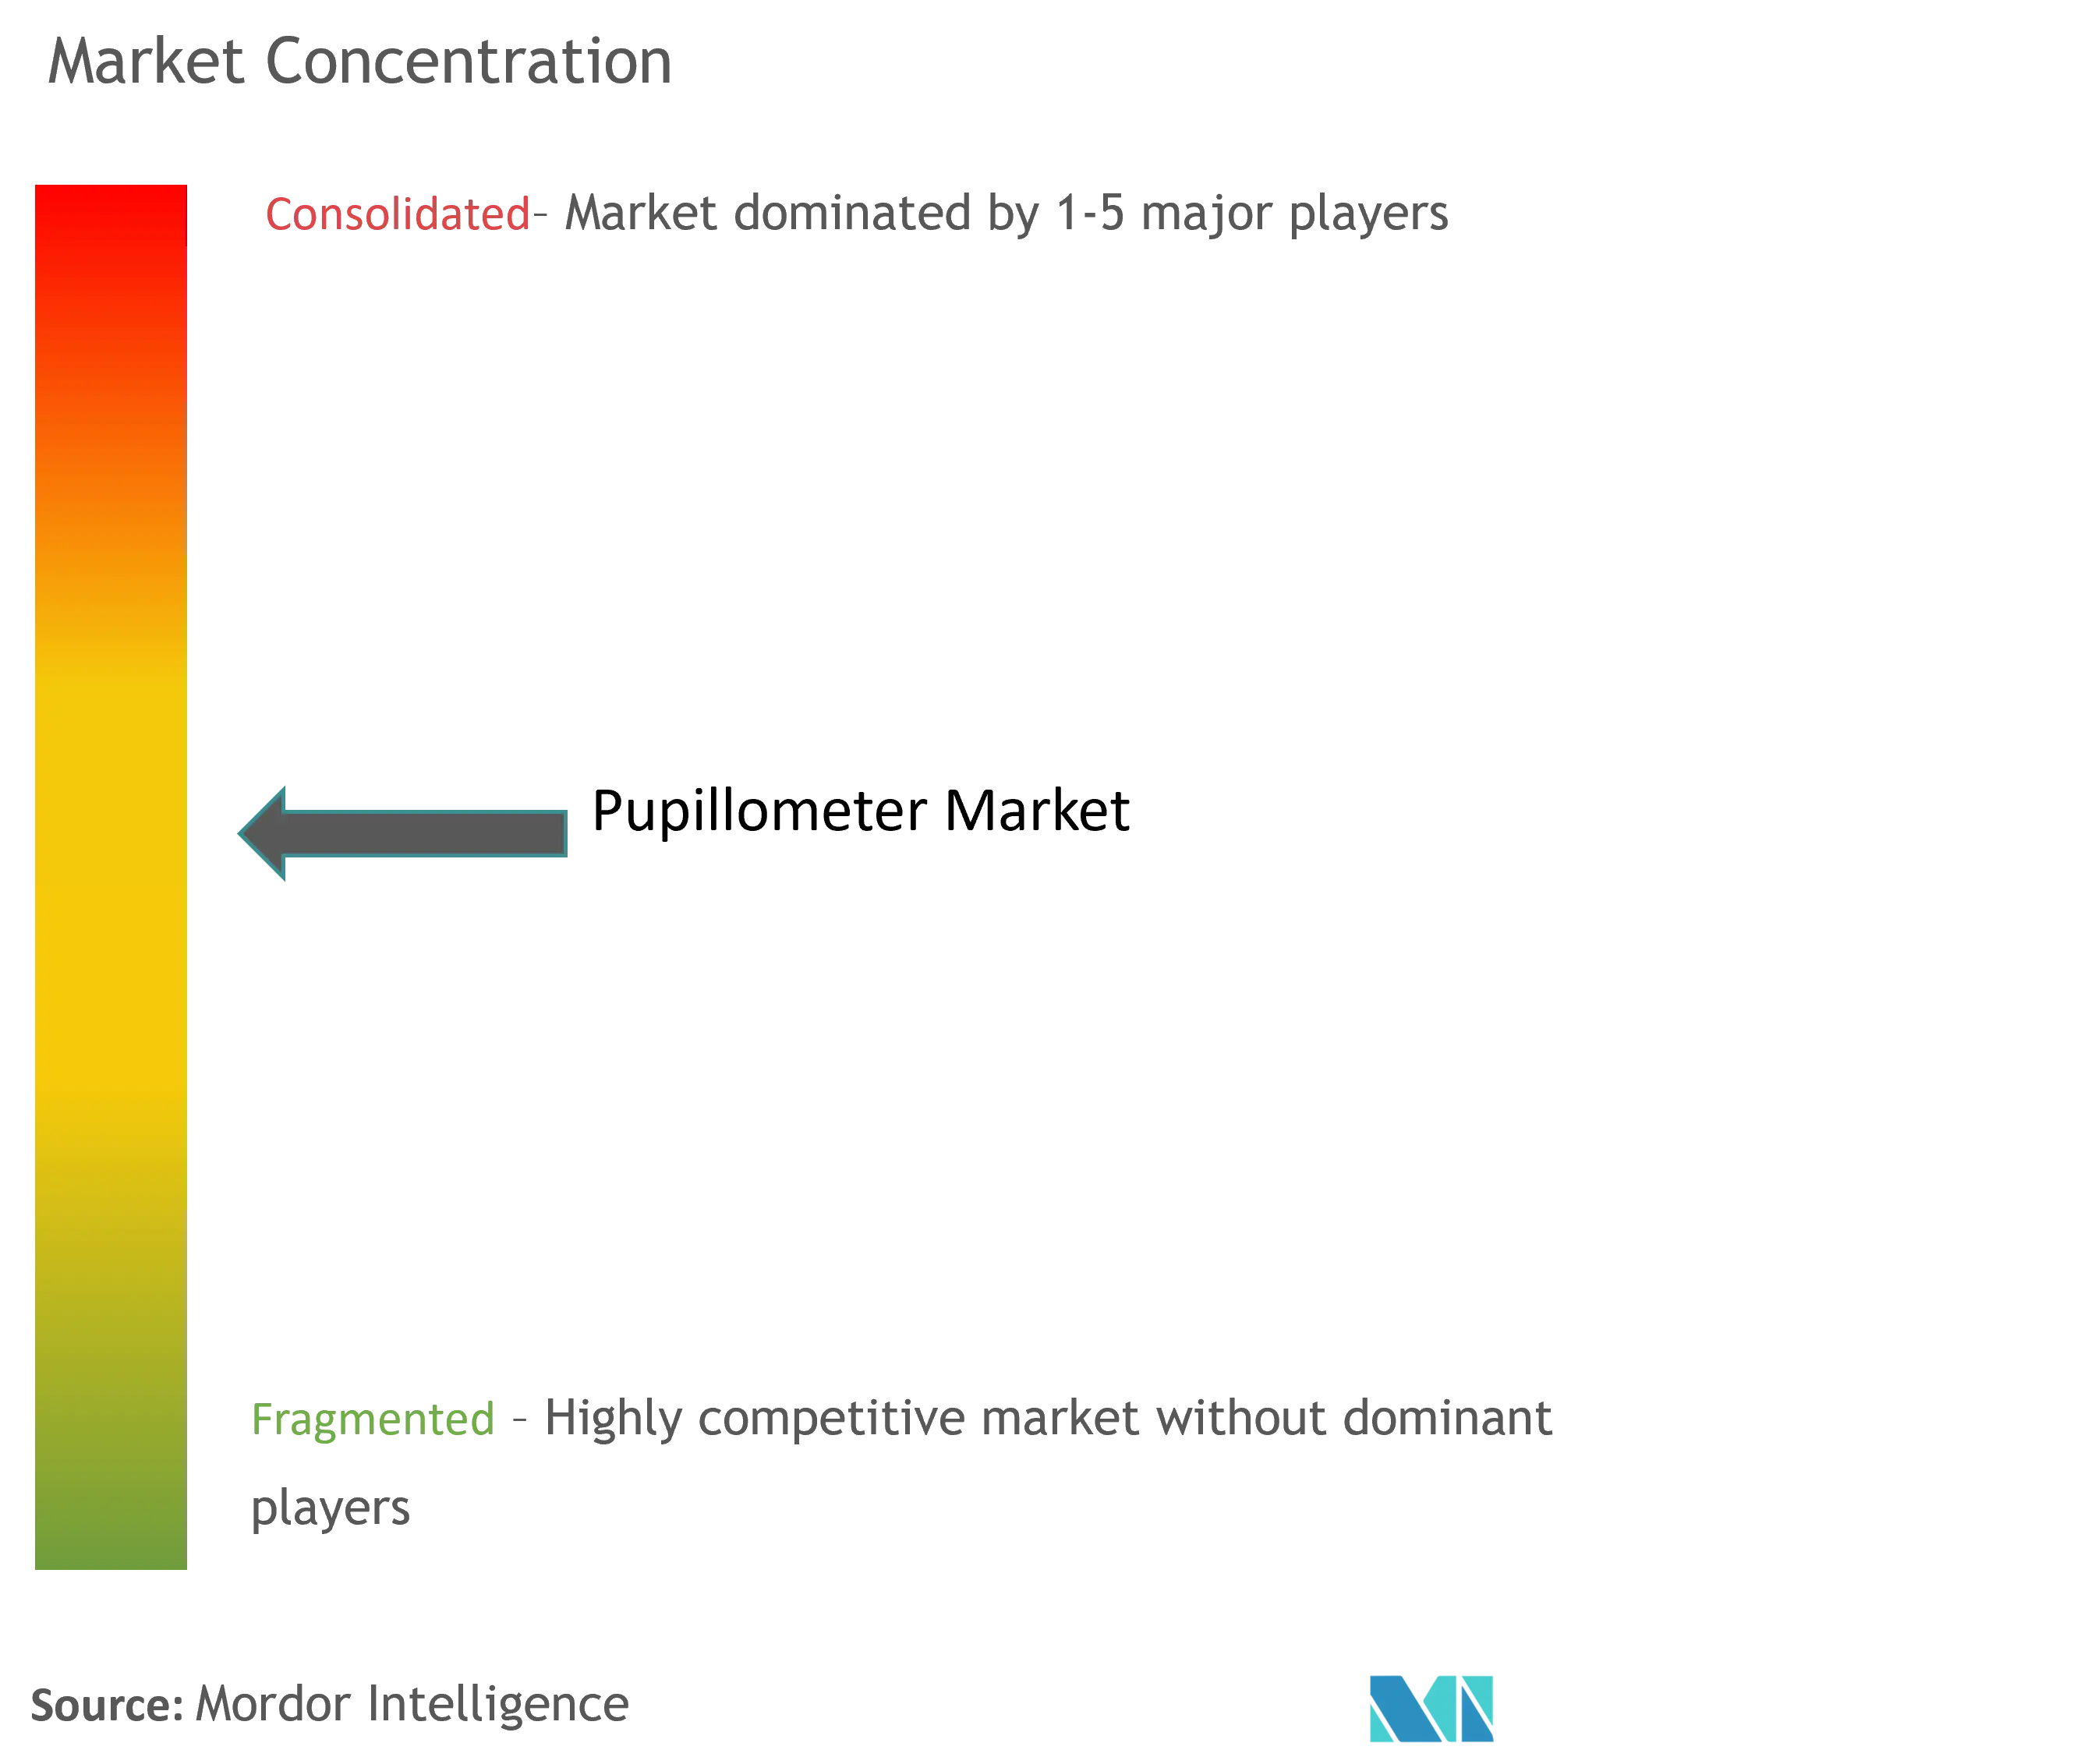
Competitive Landscape
The pupillometer market is moderately fragmented. NeurOptics, Essilor Instruments, and NIDEK anchor the premium tier through validated algorithms and broad distribution. NeurOptics extended its NPi-300 rollout to 15 countries in 2024, reinforcing clinical brand equity [3]NeurOptics Inc., “NPi-300 Global Launch Press Release,” neuroptics.com . Essilor Instruments leverages its spectacle-lens network to cross-sell digital infrared units into retail optometry. NIDEK bundles pupillometry with auto-ref keratometers, targeting high-volume Asian clinics.
Smartphone-centric entrants are disrupting incumbents by slashing capital outlay to sub-USD 1,000 and offering pay-per-use analytics subscriptions. A leading app developer recently partnered with an EHR vendor to auto-populate NPi scores into patient charts, shortening documentation time by 30%. OEMs respond by unveiling hybrid software-hardware solutions and pursuing CE-marked AI modules that deliver clinician-grade analysis on consumer devices.
Partnerships dominate strategic activity. In 2025, a US hospital network inked a deal with a cloud-AI specialist to link bedside pupillometers to a centralized neuro-dashboard, pooling data from 50 ICUs. Simultaneously, a European defense agency ordered ruggedized units capable of withstanding −20 °C field conditions, underscoring niche-application potential. Patent filings center on gaze-independent pupil tracking and machine-vision algorithms, signaling a pivot toward software-defined differentiation.
Pupillometer Industry Leaders
NeurOptics Inc.
Essilor Group (Essilor Instruments)
NIDEK SA
Reichert Inc.
Konan Medical USA Inc.
- *Disclaimer: Major Players sorted in no particular order

Recent Industry Developments
- May 2023: Acep Direct introduced the Digital Pupillometer to help protect opticians and eyeglass wearers while taking in-store measurements.
- May 2022: NeurOptics Inc. launched the NPi-300 pupillometer across 15 countries, including the United Kingdom, Germany, Australia, and New Zealand.


Research Methodology Framework and Report Scope
Market Definitions and Key Coverage
Our study defines the pupillometer market as all regulated, purpose-built devices, table-top, hand-held, and smartphone-integrated systems that use light stimuli and optical sensors to record pupil size or reflex for clinical decision-making across ophthalmology, neurology, critical care, and select field settings.
Scope Exclusion: Disposable PD rulers and consumer mobile apps that lack medical-device clearance are not counted.
Segmentation Overview
- By Modality
- Hand-held Pupillometer
- Table-top Pupillometer
- Smartphone-based Pupillometer
- By Type
- Digital (Infrared) Pupillometer
- Video Pupillometer
- Photorefractor-based Pupillometer
- By Application
- Ophthalmology
- Neurology
- Other Clinical Applications
- By End User
- Hospitals
- Eye Clinics & Vision Centers
- Others
- By Geography
- North America
- United States
- Canada
- Mexico
- Europe
- Germany
- United Kingdom
- France
- Italy
- Spain
- Rest of Europe
- Asia-Pacific
- China
- Japan
- India
- Australia
- South Korea
- Rest of Asia-Pacific
- Middle East & Africa
- GCC
- South Africa
- Rest of Middle East & Africa
- South America
- Brazil
- Argentina
- Rest of South America
- North America
Detailed Research Methodology and Data Validation
Primary Research
Interviews with neuro-ICU nurses, ophthalmologists, biomedical engineers, and procurement heads across North America, Europe, and Asia provided live insights on unit utilization, upgrade cycles, and regional reimbursement quirks. Short web surveys with device distributors helped validate average selling prices and spot emerging demand pockets.
Desk Research
We started with open datasets from agencies such as the World Health Organization, the CDC's National Hospital Discharge Survey, and the Brain Trauma Foundation, which reveal incidence trends for cataract surgery and traumatic brain injury.
Trade statistics from UN Comtrade and U.S. customs logs clarify the global flow of infrared optics, while FDA 510(k) filings and European CE registries map the active installed base.
Company 10-Ks, academic journals indexed on PubMed, and news archives on Dow Jones Factiva round out price and adoption cues (D&B Hoovers supplements firm-level revenues).
The sources named here illustrate the range; many additional materials were reviewed to cross-check figures and interpretations.
Market-Sizing & Forecasting
A blended top-down and bottom-up model underpins our numbers.
We reconstruct global demand by linking neurological ICU beds, annual cataract procedure counts, and optometry clinic density to typical device penetration rates; these totals are then tested against supplier shipment roll-ups and sample ASP × volume checks before final adjustment.
Key variables like traumatic brain injury admissions, glaucoma prevalence, hospital capital-budget trends, device replacement interval, and ASP erosion feed a multivariate regression that drives the 2025-2030 forecast.
Scenario analysis gauges upside from AI-enabled upgrades and downside from reimbursement delays, filling data gaps where bottom-up inputs are thin.
Data Validation & Update Cycle
Outputs pass a three-layer review: statistical anomaly screens, senior analyst variance checks, and re-contact with select experts when deviations exceed preset bands.
Mordor Intelligence refreshes every twelve months, issuing interim updates if regulatory or recall events materially shift assumptions.
A final pre-publication sweep ensures clients receive the most current view.
Why Mordor's Pupillometer Market Baseline Earns Deep Trust
Published estimates differ because each firm picks its own device mix, price curve, and refresh rhythm.
Some count basic PD gauges, others roll forward legacy ASPs, and many update only when a press release surfaces.
Key gap drivers include scope creep into non-regulated apps, treating price declines as linear despite tiered discounts, and infrequent verification of installed-base attrition, which our analysts revisit annually through active end-user polling.
Benchmark comparison
| Market Size | Anonymized source | Primary gap driver |
|---|---|---|
| USD 453.69 M (2025) | Mordor Intelligence | - |
| USD 464.6 M (2024) | Global Consultancy A | Includes consumer PD tools and applies constant ASP |
| USD 406.5 M (2024) | Trade Journal B | Excludes smartphone-linked units sold post-pandemic |
| USD 480.91 M (2025) | Industry Insights C | Uses optimistic ICU penetration without device attrition factor |
The comparison shows that when scope, price decay, and installed-base churn are aligned, figures converge toward Mordor's balanced baseline.
Our disciplined data checks give decision-makers a figure they can trace, question, and confidently use.


Key Questions Answered in the Report
How big is the Pupillometer Market?
The Pupillometer Market size is expected to reach USD 486.25 million in 2026 and grow at a CAGR of 7.18% to reach USD 687.1 million by 2031.
Which modality is growing fastest?
Hand-held devices post the highest growth at a 7.72% CAGR as emergency medicine, sports clinics, and military units favor portable diagnostics.
Who are the key players in Pupillometer Market?
NeurOptics Inc., Essilor Group (Essilor Instruments), NIDEK SA, Reichert Inc. and Konan Medical USA Inc. are the major companies operating in the Pupillometer Market.
Why is Asia-Pacific the fastest-growing region?
Expanding healthcare infrastructure, high myopia prevalence, and rising neurological disease incidence are propelling an 8.53% CAGR in Asia-Pacific.
Which region has the biggest share in Pupillometer Market?
In 2025, the North America accounts for the largest market share in Pupillometer Market.
What barriers limit wider adoption?
High capital cost, inconsistent reimbursement, and a shortage of clinicians trained in neuro-ophthalmic interpretation remain key obstacles.
Page last updated on:


