
Prosthetics and Orthotics Market Size and Share
Market Overview
| Study Period | 2020 - 2031 |
|---|---|
| Market Size (2026) | USD 7.68 Billion |
| Market Size (2031) | USD 9.88 Billion |
| Growth Rate (2026 - 2031) | 5.15 % |
| Fastest Growing Market | Asia-Pacific |
| Largest Market | North America |
| Market Concentration | Medium |
Major Players *Disclaimer: Major Players sorted in no particular order Image © Mordor Intelligence. Reuse requires attribution under CC BY 4.0. | |
Prosthetics and Orthotics Market Analysis by Mordor Intelligence
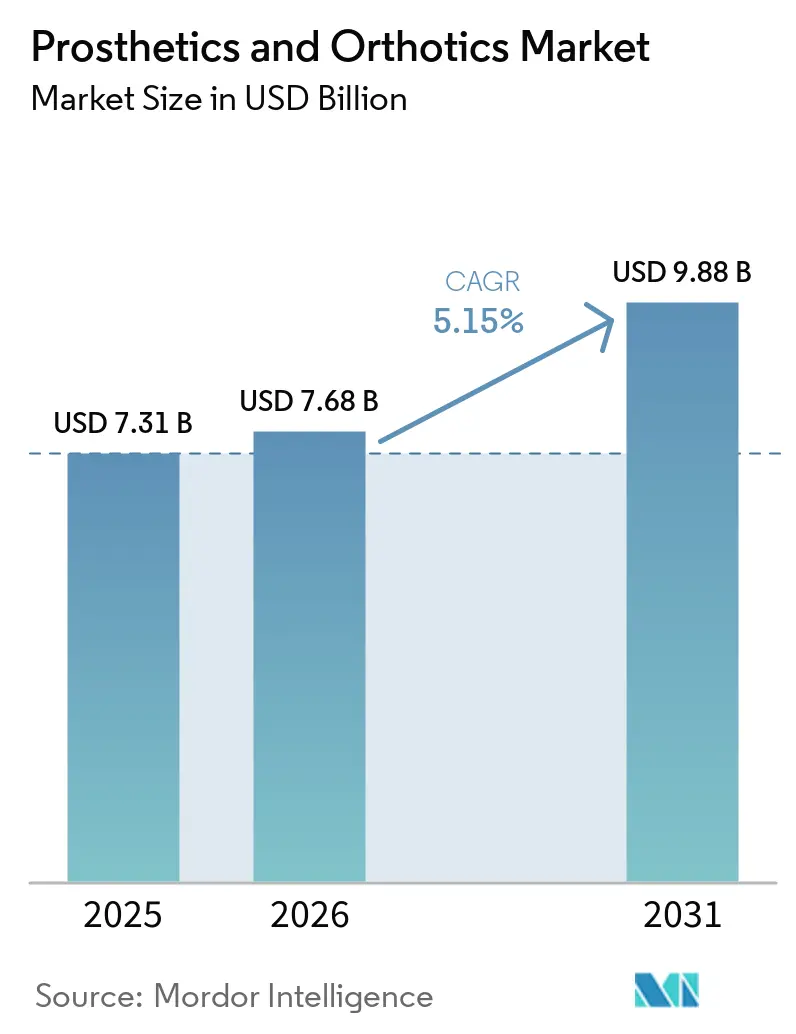
The Prosthetics And Orthotics Market size is expected to grow from USD 7.31 billion in 2025 to USD 7.68 billion in 2026 and is forecast to reach USD 9.88 billion by 2031 at 5.15% CAGR over 2026-2031.
Rising diabetes-related amputations, an aging global population, and rapid advances in microprocessor-controlled devices jointly sustain demand. Providers increasingly integrate digital gait-analytics platforms that enable remote follow-up, while payers broaden coverage for premium components that cut fall-related readmissions. Private-equity interest in specialized clinic chains intensifies competitive dynamics, and 3D-printing compresses socket-fabrication lead times, improving patient experience. At the same time, military R&D pipelines accelerate commercial innovation, yielding powered joints and neural interfaces that redefine functional benchmarks.
Key Report Takeaways
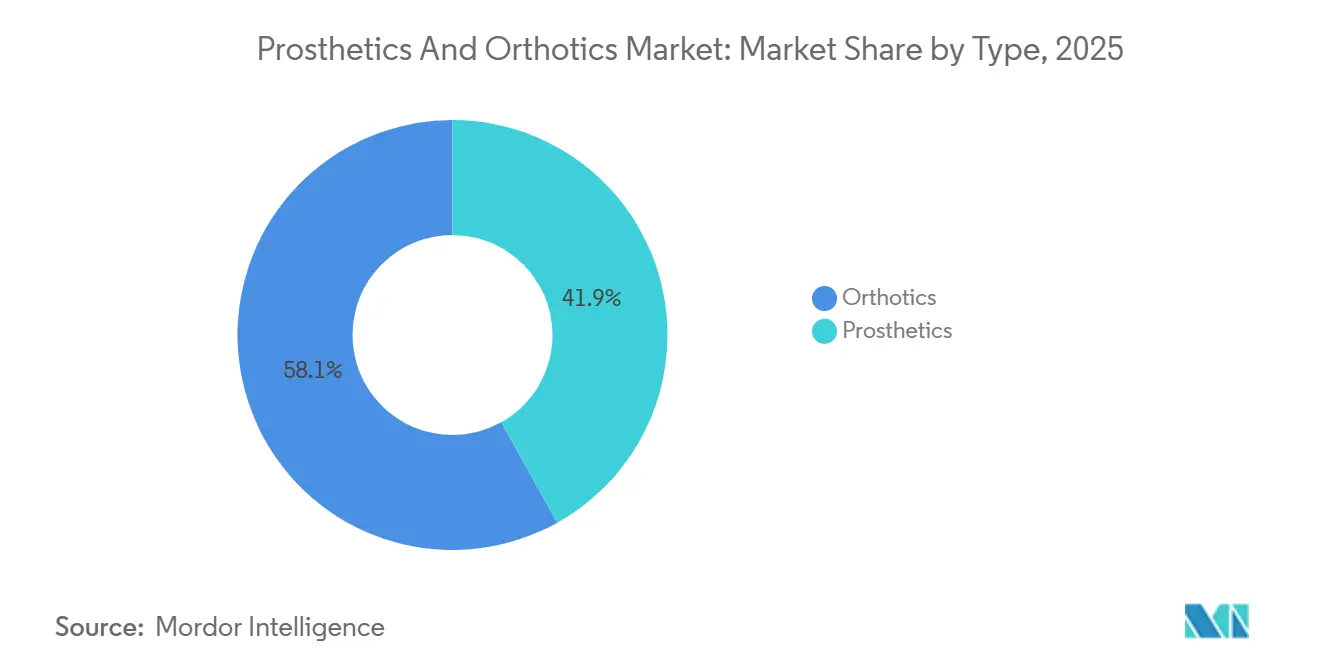
- By type, orthotics led with 58.1% of the Prosthetics and Orthotics market share in 2025, whereas prosthetics are on track to post a 6.22% CAGR to 2031.
- By technology, conventional body-powered systems held 45.11% of the prosthetics and Orthotics market size in 2025, while microprocessor-controlled systems are advancing at a 6.11% CAGR through 2031.
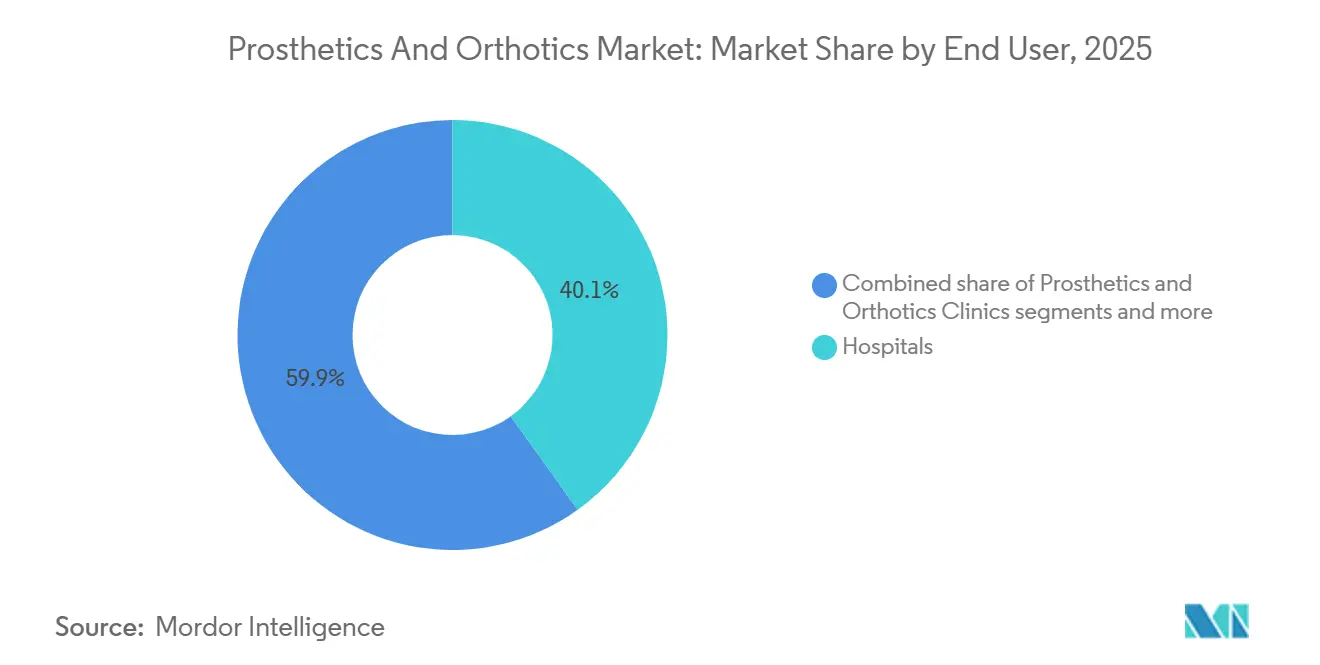
- By end user, hospitals accounted for 40.1% of revenue in 2025, yet dedicated prosthetics-and-orthotics clinics are forecast to expand at a 7.43% CAGR through 2031.
- North America accounted for 43.3% of the prosthetics and orthotics market share in 2025, whereas Asia-Pacific is set to grow at a 7.91% CAGR between 2026 and 2031.
Note: Market size and forecast figures in this report are generated using Mordor Intelligence’s proprietary estimation framework, updated with the latest available data and insights as of 2026.
Market Trends and Insights
Drivers Impact Analysis of Prosthetics and Orthotics Market*
| Driver | (~) % Impact on CAGR Forecast | Geographic Relevance | Impact Timeline |
|---|---|---|---|
| Rapid Rise in Diabetes-Related Amputations | +1.2% | Global, acute in North America, Middle East, South Asia | Medium term (2-4 years) |
| Ageing Population & Osteoarthritis Burden | +1.0% | North America, Europe, Japan | Long term (≥ 4 years) |
| Advances in Micro-Processor & Myoelectric Technologies | +0.9% | North America, Europe, APAC | Medium term (2-4 years) |
| Expanding Reimbursement in Developed Markets | +0.8% | North America, Western Europe | Short term (≤ 2 years) |
| AI-Driven Predictive Gait-Analytics Adoption | +0.6% | North America, Europe pilots; APAC emerging | Medium term (2-4 years) |
| Military R&D Spill-Over Into Civilian Devices | +0.5% | United States, NATO allies, Israel | Long term (≥ 4 years) |
| Source: Mordor Intelligence | |||


Rapid Rise in Diabetes-Related Amputations
Diabetes-linked lower-extremity amputations anchor baseline unit demand for prosthetic limbs, but they also catalyze reimbursement advocacy that ties advanced devices to limb-salvage outcomes. The International Diabetes Federation counted 588.7 million people with diabetes in 2024 and projects 852.5 million by 2050 [1]International Diabetes Federation, “IDF Diabetes Atlas, 10th Edition,” diabetesatlas.org. In the United States, roughly 165,000 amputation hospitalizations occur each year, with Black Americans experiencing a significantly higher incidence. Canada logged 7,720 diabetes-related amputations in its latest reporting cycle, underscoring pressures within single-payer systems. Manufacturers that embed residual-limb health sensors position themselves as partners in value-based care, moving revenue from episodic sales to recurring analytics subscriptions.
Ageing Population & Osteoarthritis Burden
The World Health Organization forecasts 2.1 billion people aged 60+ by 2050, up from 1.4 billion in 2024 [2]World Health Organization, “Ageing and Health,” who.int. Knee osteoarthritis alone affects 365 million patients, fueling orthotic brace prescriptions that delay total-joint replacement. Japan, where 29% of residents are 65 years or older, incubates ultralight carbon-fiber ankle-foot orthoses now diffusing into Western markets. Vendors that pair braces with telerehabilitation platforms capture adherence data prized by payers seeking outcome-based payments.
Advances in Microprocessor & Myoelectric Technologies
Medicare’s 2024 policy extends microprocessor-knee coverage to K2 ambulators, unlocking tens of thousands of additional candidates annually. Ottobock’s C-Leg 4 and Össur’s POWER KNEE feature machine-learning algorithms that cut stair-fall risk. A Nature Medicine study validated the Agonist-Antagonist Myoneural Interface, which let amputees walk 41% faster and generate 187% greater peak power than traditional methods. Companies that invest in surgeon education on AMI techniques stand to dominate the premium limb-loss segment.
Expanding Reimbursement in Developed Markets
North American and European payers widen coverage for advanced components after evidence of lower fall-related admissions. U.S. private insurers, such as Health Care Service Corporation, updated their policies following Medicare’s lead. Germany’s sickness funds reimburse medically necessary devices yet demand direct price negotiation, trimming margins. In the U.K., National Health Service waitlist bottlenecks have given rise to an out-of-pocket fast-track market.
Restraints Impact Analysis of Prosthetics and Orthotics Market*
| Restraint | (~) % Impact on CAGR Forecast | Geographic Relevance | Impact Timeline |
|---|---|---|---|
| High Device Cost & Uneven Reimbursement | -0.7% | Global, acute in low- and middle-income countries; U.S. underinsurance pockets | Short term (≤ 2 years) |
| Shortage of Certified O&P Clinicians | -0.5% | United States, Canada, Western Europe; emerging APAC | Medium term (2-4 years) |
| Carbon-Fiber Supply-Chain Volatility | -0.3% | Global, concentrated among aerospace-grade composite users | Short term (≤ 2 years) |
| Pay-For-Outcome Reimbursement Risk | -0.2% | United States pilots; limited European uptake | Long term (≥ 4 years) |
| Source: Mordor Intelligence | |||
High Device Cost & Uneven Reimbursement
Microprocessor knees list between USD 18,000-100,000, placing Ottobock’s C-Leg near USD 50,000-70,000 [3]Johns Hopkins Medicine, “Prosthetic Limb Costs and Insurance Coverage,” hopkinsmedicine.org. Medicaid caps and state variability still block many U.S. patients, while out-of-pocket costs in low-income nations surpass annual incomes. Tiered portfolios with upgrade paths remain scarce, leaving a gap for new entrants.
Shortage of Certified O&P Clinicians
Roughly 10,000 certified orthotists and prosthetists practice in the United States, an aging talent pool that cannot match accelerating demand. Rural users travel long distances for fittings, undermining compliance. Automation tools that pre-design sockets can lighten the clinician workload, but regulations still require licensed sign-off.
*Our forecasts treat driver/restraint impacts as directional, not additive. The impact forecasts reflect baseline growth, mix effects, and variable interactions.
Prosthetics and Orthotics Market Segment Analysis
By Type:
Orthotics Dominate, Prosthetics AccelerateOrthotics captured 58.1% of the Prosthetics and Orthotics market share in 2025, led by lower-limb bracing for 365 million knee-osteoarthritis patients. Spinal and upper-limb supports add stable revenue, benefiting from prefabricated SKUs ordered via e-commerce. Conversely, prosthetics contributed a smaller base yet will post a 6.22% CAGR, propelled by microprocessor-controlled knees that enable variable cadence. 3D-printed prosthetics include customized prosthetic sockets. Consumables such as liners and suspension sleeves provide sticky recurring sales that anchor the Prosthetics and Orthotics market size growth across replacement cycles.
ISO 22523 and ISO 8549 compliance streamlines CE-marking and FDA 510(k) pathways. Orthotic commoditization risk rises as 3D-printing lowers entry barriers, whereas proprietary control algorithms protect prosthetic margins. Vendors bundling digital physiotherapy content with braces further differentiate in a crowded field.

By Technology:
Microprocessor Systems Gain GroundConventional body-powered devices retained 45.11% of the prosthetics and Orthotics market size in 2025, thanks to affordability and low maintenance. Yet microprocessor knees and ankles are gaining at 6.11% CAGR, buoyed by 2024 reimbursement expansion. Electric myoelectric hands target users who demand precision grip for office tasks, while hybrid systems offer battery-free backup valued by military users.
Additive-manufactured sockets slash fabrication time to 48 hours, though fatigue limitations curb adoption for definitive limbs. Robotic rehab exoskeletons generate per-session revenue at therapy centers, and sensory-feedback prototypes such as Integrum’s OPRA pave the path to intuitive limb control. The technology mix thus tilts toward smart, service-enabled hardware that maintains high average selling prices.
By End User:
Clinics Capture Specialized FittingHospitals and clinics accounted for 40.1% of 2025 revenue, bundling acute care, rehab, and first-fit devices. Specialized prosthetics-and-orthotics clinics, however, are set to post a 7.43% CAGR as private-equity funding fuels roll-ups offering same-day digital scanning. Home-care channels expand via off-the-shelf braces delivered with tele-coaching, while Veterans Affairs centers sustain predictable device cycles at negotiated prices.
Nascent direct-to-consumer portals sell cosmetic covers and activity feet, capturing accessory share without violating fitting regulations. An omnichannel model—acute fitting in hospitals, complex cases at specialty clinics, consumables online—best aligns with evolving user preferences.

Geography Analysis
North America Prosthetics and Orthotics Market
North America held 43.3% of Prosthetics and Orthotics market share in 2025 on the strength of VA funding and Medicare reforms. Canada’s single-payer model reimburses clinically necessary devices, yet long queues spur a parallel cash-pay segment. Mexico relies on charitable and medical-tourism flows, limiting premium uptake.
Europe Prosthetics and Orthotics Market
Europe ranks second by value; Germany’s statutory system funds devices yet caps tariffs below full cost, driving volume but squeezing profitability. The European Union Medical Device Regulation stretches notified-body capacity, delaying product launches and dampening short-term Prosthetics and Orthotics market size addition.
APAC, MEA and South America Prosthetics and Orthotics Market
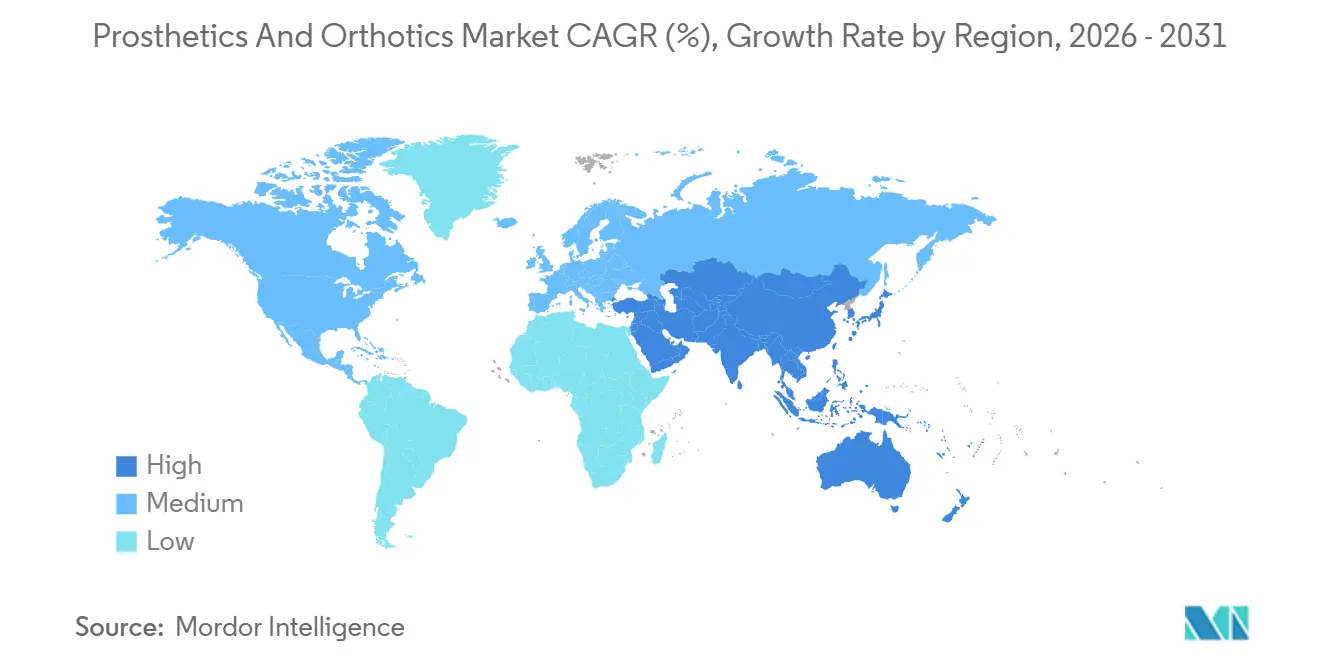
Asia-Pacific is forecast for a 7.91% CAGR through 2031, fueled by India’s Assistance to Disabled Persons subsidy, China’s wider urban insurance coverage, and Japan’s super-aged demographic looking for lightweight orthoses. South Korea and Australia exhibit high per-capita adoption within universal schemes. Southeast Asia remains cost-sensitive and favors low-cost mechanical limbs. The Middle East bifurcates between GCC states that reimburse premium devices and sub-Saharan Africa, where NGO donations dominate. South America’s growth is tempered by fiscal constraints in Brazil and Argentina.

Regulatory Landscape
In the United States, many prosthetic and orthotic devices fall under FDA regulation in 21 CFR Part 890, Subpart D (Physical Medicine Prosthetic Devices), where a meaningful share are Class I under general controls and can be exempt from premarket notification depending on the product code and claims. This framework reduces time-to-market for commodity braces and componentry, but manufacturers still manage labeling, adverse-event reporting, and, where applicable, quality system obligations tied to device classification and distribution models.
In Europe, Regulation (EU) 2017/745 (EU MDR) drives a life-cycle compliance approach built around clinical evaluation and post-market clinical follow-up (PMCF), with additional requirements around traceability via UDI and the EUDAMED architecture. Custom-made devices are addressed through specific provisions (Annex XIII), which raises compliance expectations for bespoke orthoses and sockets even when they are outside standard CE-marking routes. Globally, standards activity through ISO/TC 168, including ISO 22523:2006, supports performance and safety test alignment, helping multinational vendors manage multi-market submissions and component interchangeability requirements.
Competitive Landscape
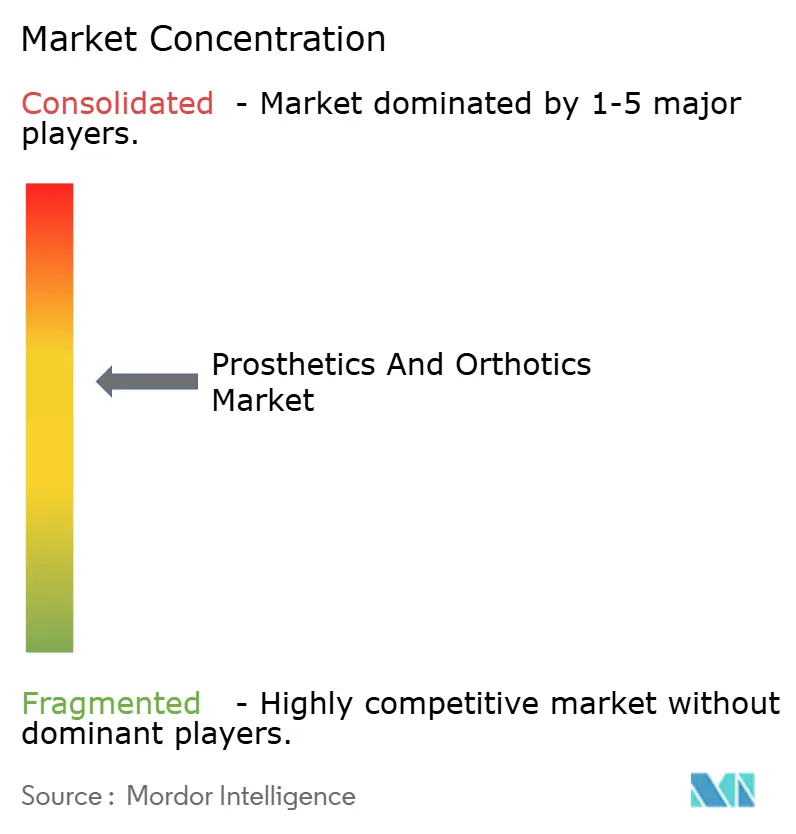
Ottobock, Össur, and Hanger Inc. collectively account for a significant portion of global revenue, leaving a fragmented tail of regional specialists and contract manufacturers. Hanger’s USD 1.2 billion buyout by Patient Square Capital illustrates rising private-equity appetite for cash-flow-stable clinic chains. Incumbents differentiate via proprietary microprocessor algorithms, vertically integrated clinics, and component ecosystems that discourage cross-brand mixing.
Emerging challengers apply 3D-printing to deliver custom sockets at discounts, though regulatory oversight checks rapid scaling. Integrum’s osseointegrated implants and sensory-feedback pathway create a premium niche shielded by surgical complexity. Patent filings now center on software, Össur’s 2024 machine-learning socket-fit algorithm being one example, signaling that competitive advantage pivots toward data as much as hardware.
Robotic exoskeleton suppliers such as Ekso Bionics and Cyberdyne monetize per-therapy-session models, sidestepping direct competition with personal prosthetics. Overall, mid-level concentration and technology segmentation together define a market where scale, digital infrastructure, and clinician partnerships outweigh pure manufacturing capacity.
Prosthetics and Orthotics Industry Leaders
Össur
Ottobock
Bauerfeind AG
Blatchford Limited
Hanger Inc
- *Disclaimer: Major Players sorted in no particular order
Prosthetics and Orthotics Market Companies Covered in this Report
- Bauerfeind
- Blatchford Group
- College Park Industries
- Cyberdyne
- Ekso Bionics
- Enovis
- Fillauer
- Hanger Inc.
- Integrum AB
- Johnson & Johnson
- Ortho Europe
- Ossur
- Ottobock
- Proteor
- Smiths Group
- Spinal Technology Inc.
- Steeper Group
- Stryker
- Thuasne
- Trulife
- WillowWood Global
- Zimmer Biomet

Market Opportunities and Future Outlook
Active neuro-orthotics and neuromodulation-linked solutions form a practical whitespace where orthoses shift from passive support to therapy-enabling function. In July 2026, Ottobock announced the acquisition of Fesia Technology to add functional electrical stimulation (FES) capabilities for neuro-orthotics, underscoring how incumbent portfolios are broadening toward paralysis and neuromuscular impairment use cases adjacent to traditional O&P fitting workflows. Publicly discussed product roadmaps at OTWorld 2026, including Ottobock's C-Brace Interim concept for early rehabilitation, also point to demand for clinic-ready devices that can be deployed earlier in the care pathway.
Digitized fabrication and scalable socket production are further easing capacity constraints created by clinician shortages and long lead times. In June 2026, VYTRUVE reported surpassing 13,000 3D-printed prosthetic sockets produced via its digital platform since 2020, indicating additive manufacturing has moved into recurring throughput within clinical operations. At the premium end, microprocessor knees remain a key differentiation battleground, with PROTEOR launching the QUATTRO 2 microprocessor knee in the United States in July 2026 and scheduling broader global availability for September 2026, expanding options for providers and payers focused on fall-risk reduction and gait-adaptive performance.
Recent Industry Developments in Prosthetics and Orthotics Market
- July 2026: Ottobock announced the acquisition of Fesia Technology, S.L., expanding into functional electrical stimulation (FES) for neuro-orthotics. The acquisition strengthens Ottobock's presence in active orthotic systems that address neuromuscular conditions, broadening the addressable segment beyond traditional mechanical bracing and component sales.
- October 2025: Motorica launched a digital-first workflow for upper-limb prosthetics using smartphone-based 3D scanning and cloud-hosted modeling. The approach reduces reliance on physical molds and supports remote, faster iteration in device design, adding competitive pressure on conventional fabrication and clinic workflows.
- April 2025: Ossur introduced the Pro-Flex Terra foot prosthesis, co-developed with BASF and using Cellasto micro-cellular material to adapt to walking conditions without mechanical adjustments. The launch highlights continued materials innovation in energy-return feet, reinforcing differentiation through comfort and terrain response in lower-extremity prosthetics.


Prosthetics and Orthotics Market Report Scope and Research Methodology
Market Definition and Coverage
This market covers revenue generated from prosthetic and orthotic devices used to restore or support mobility and function across clinical and institutional care settings. It includes the main device systems and related components that are routinely supplied for fitting and follow-up use.
Scope exclusions: We exclude surgical orthopedic implants, general rehabilitation equipment, and routine physical therapy services that are not part of prosthetic or orthotic device delivery.
Segments Covered in This Report
- By Type
- Orthotics
- Lower-Limb Orthotics
- Ankle-Foot Orthoses (AFO)
- Knee Orthoses
- Hip Orthoses
- Upper-Limb Orthotics
- Spinal Orthotics
- Lower-Limb Orthotics
- Prosthetics
- Lower-Extremity Prosthetics
- Micro-processor Knees
- Powered Ankles/Feet
- Upper-Extremity Prosthetics
- Liners, Sockets & Modular Components
- Lower-Extremity Prosthetics
- Orthotics
- By Technology
- Conventional / Body-Powered
- Electric-Powered / Myoelectric
- Micro-processor Controlled
- Hybrid
- 3D-Printed / Additive Manufactured
- Robotic / Powered Exoskeletal
- Sensory-Feedback Enabled
- By End User
- Hospitals
- Prosthetics & Orthotics Clinics
- Rehabilitation Centers
- Home-Care Settings
- Other End Users
- By Geography
- North America
- United States
- Canada
- Mexico
- Europe
- Germany
- United Kingdom
- France
- Italy
- Spain
- Rest of Europe
- Asia-Pacific
- China
- India
- Japan
- South Korea
- Australia
- Rest of Asia-Pacific
- Middle East and Africa
- GCC
- South Africa
- Rest of Middle East and Africa
- South America
- Brazil
- Argentina
- Rest of South America
- North America
Data Sources, Market Sizing, and Validation
Desk Research
For the desk phase, we map the care pathway and device flow so the market scope stays practical and measurable. Public sources anchor the demand pool and medical context, such as CDC and WHO disability and injury indicators, OECD health statistics for spending and access, and CMS/Medicare references for coding and reimbursement direction (where applicable). We also use peer-reviewed clinical journals to understand typical replacement cycles and the adoption of microprocessor knees and other powered solutions, and to see how patient outcomes shape prescribing.
To turn this context into sizing inputs, we review company annual reports, investor presentations, earnings commentary, and reputable press coverage on product launches and capacity expansions. We also use paid databases for company financials and intelligence, and patent databases to track innovation intensity by device type. The desk source list is illustrative only, and additional public documents and datasets were used for cross-checking, validation, and clarification.
Primary Interviews and Surveys
Primary work stress-tested what we built from public information, especially where pricing, replacement behavior, and channel mix vary by country. We spoke with prosthetists and orthotists, rehabilitation clinicians, distributors, and manufacturing and product managers, and the inputs were checked across major regions so local reimbursement patterns and tender behavior did not skew the final numbers.
Distribution of primary research fieldwork respondents
| Company type | Respondent position | Region |
|---|---|---|
| Top tier: 38% | CXOs: 15% | APAC: 39% |
| Mid tier: 45% | Functional/Unit leaders: 36% | EMEA: 35% |
| Smaller Players: 17% | Managers: 49% | Americas: 26% |
Market-Sizing & Forecasting
Sizing started with a top-down build where epidemiology and treated-patient assumptions, filtered through access to care and reimbursement intensity, were translated into an annual device demand pool. That demand pool was then expressed in value using typical device mix and average selling price (ASP) ranges by category and region, with assumptions adjusted when interview feedback indicated different replacement timing or upgrade rates.
Key inputs used in the model include incidence of diabetes-related amputations and trauma, aging-linked mobility conditions, and the share of fittings routed through hospitals versus specialized P&O clinics. We model replacement and refitting cycles for major braces and limb systems, and the adoption pace of microprocessor and electric-powered devices. Forecasting uses scenario analysis tied to reimbursement outlook, clinical adoption patterns, and affordability constraints. To avoid artificial step changes, the growth path is smoothed using time-series logic so sudden jumps are flagged and rechecked. As a practical cross-check, we build selective bottom-up approximations using sampled ASP times estimated annual unit volumes from channel checks and supplier revenue splits, and we handle data gaps by applying conservative penetration ranges when country-level information is thin.
Data Validation & Update Cycle
Model outputs were validated through triangulation across independent signals, including reported company revenue direction, procedure and disability indicators, and the implied per-patient spend produced by the model. Outliers are reviewed in steps, first by checking currency timing and inflation assumptions, then by revisiting device mix and replacement cycles, and finally by re-contacting select experts if the variance remains unexplained. Before sign-off, another analyst reviews the full chain of assumptions so the logic can be followed from demand drivers to final value.
Reports are refreshed annually, and interim updates are made when material events occur, such as reimbursement changes, large acquisitions, or major product-class shifts. Right before delivery, we run a final refresh pass so clients receive the most current view supported by repeatable checks.
Mordor Intelligence's Prosthetics and Orthotics Market Estimate Compared With Other Published Estimates
Published market numbers for prosthetics and orthotics often spread out because each publisher defines the market box differently, then applies their own pricing and growth assumptions. The biggest differences typically show up around whether adjacent rehab items are counted, how ASP is carried forward over time, and how frequently assumptions are revisited after policy or tender changes.
Some published estimates fold in broader mobility and rehabilitation equipment or blend in service revenue from long-term care pathways. In Mordor Intelligence, the total is restricted to prosthetic and orthotic devices and their core components, and the 2025 to 2026 step is checked against adoption of microprocessor and electric-powered systems and realistic replacement cycles by region.
Benchmark comparison
| Source | Market Size | Gaps in Research Methodology |
|---|---|---|
| Mordor Intelligence | USD 7.31 B (2025) | |
| Industry Research Publisher A | USD 7.84 B (2025) | Uses a broader device framing that can capture additional rehab-oriented products, and it often applies a more uniform global ASP progression that is less sensitive to reimbursement-driven price ceilings. |
| Trade Association B | USD 2.40 B (2021) | Reflects a North America only view and is tied to a payer and provider context, so it is not directly comparable to a global device market value for the same year. |
Taken together, the spread is mainly explained by geography coverage and what gets counted inside the product scope, and then by how pricing is carried forward in the forecast. By keeping the demand pool tied to treated patients, replacement behavior, and region-specific channel reality, the resulting market value stays traceable to inputs that a reader can follow and recheck.


Key Questions Answered in the Report
What is the forecast value of the Prosthetics and Orthotics market by 2031?
It is projected to reach USD 9.88 billion by 2031.
Which technology segment is growing fastest within the Prosthetics and Orthotics market?
Microprocessor-controlled technology leads with a 6.11% CAGR forecast for 2026-2031.
Why is Asia-Pacific considered the most attractive growth region?
Policy subsidies in India, Japan’s super-aged population, and broader insurance in China drive a 7.91% CAGR outlook.
How did Medicare influence U.S. demand in 2024?
By extending microprocessor-knee coverage to K2 ambulators, adding tens of thousands of eligible beneficiaries.
Page last updated on:




