Printed Thin Film Battery Market Size and Share
Market Overview
| Study Period | 2019 - 2030 |
|---|---|
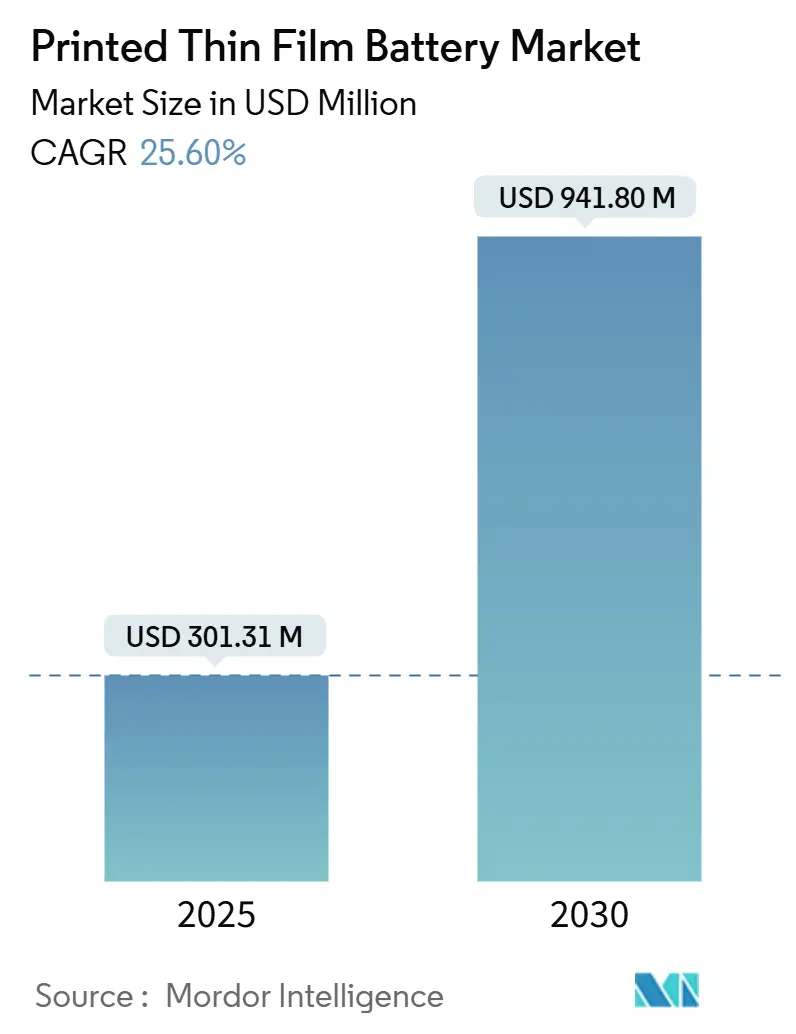
| Market Size (2025) | USD 301.31 Million |
| Market Size (2030) | USD 941.80 Million |
| Growth Rate (2025 - 2030) | 25.60% CAGR |
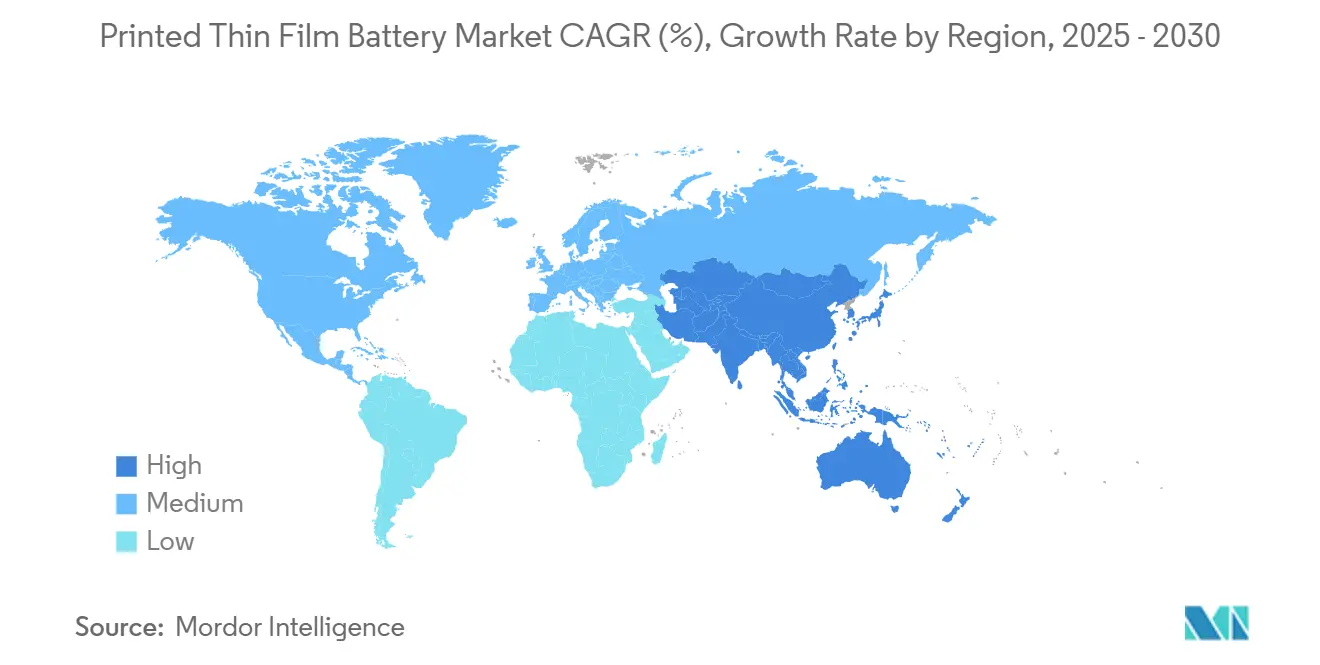
| Fastest Growing Market | Asia Pacific |
| Largest Market | Asia Pacific |
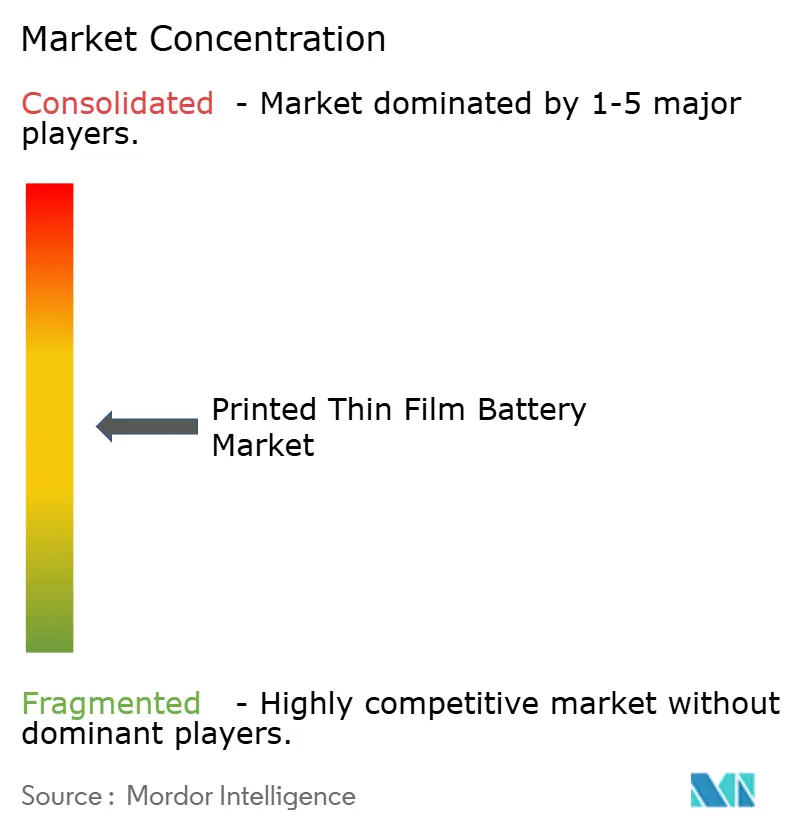
| Market Concentration | Medium |
Major Players *Disclaimer: Major Players sorted in no particular order Image © Mordor Intelligence. Reuse requires attribution under CC BY 4.0. | |
Printed Thin Film Battery Market Analysis by Mordor Intelligence
The Printed Thin Film Battery market size stands at USD 301.31 million in 2025 and is projected to reach USD 941.80 million by 2030, translating into a 25.6% CAGR over the forecast horizon. This triple-digit value expansion mirrors the technology’s rise from niche prototypes to mainstream power sources across miniature electronics and smart packaging ecosystems. Growth catalysts include the surge of connected wearables, accelerating smart-label mandates, and rapid gains in solid-state energy density that collectively widen the total addressable opportunity. Competitive intensity is moderate because process know-how, specialized printing lines, and supply certainty for solid-electrolyte precursors create barriers that deter rapid new-entrant scale-ups. Opportunities cluster around integrated energy harvesting, high-voltage industrial sensors, and pharmaceutical cold-chain tracing, whereas challenges stem from capital-heavy production upgrades and fragmented global testing standards. Asia-Pacific manufacturing dominance, stringent Western regulations, and cross-border traceability rules shape the geography of both demand pull and supply push over the next five years.
Key Report Takeaways
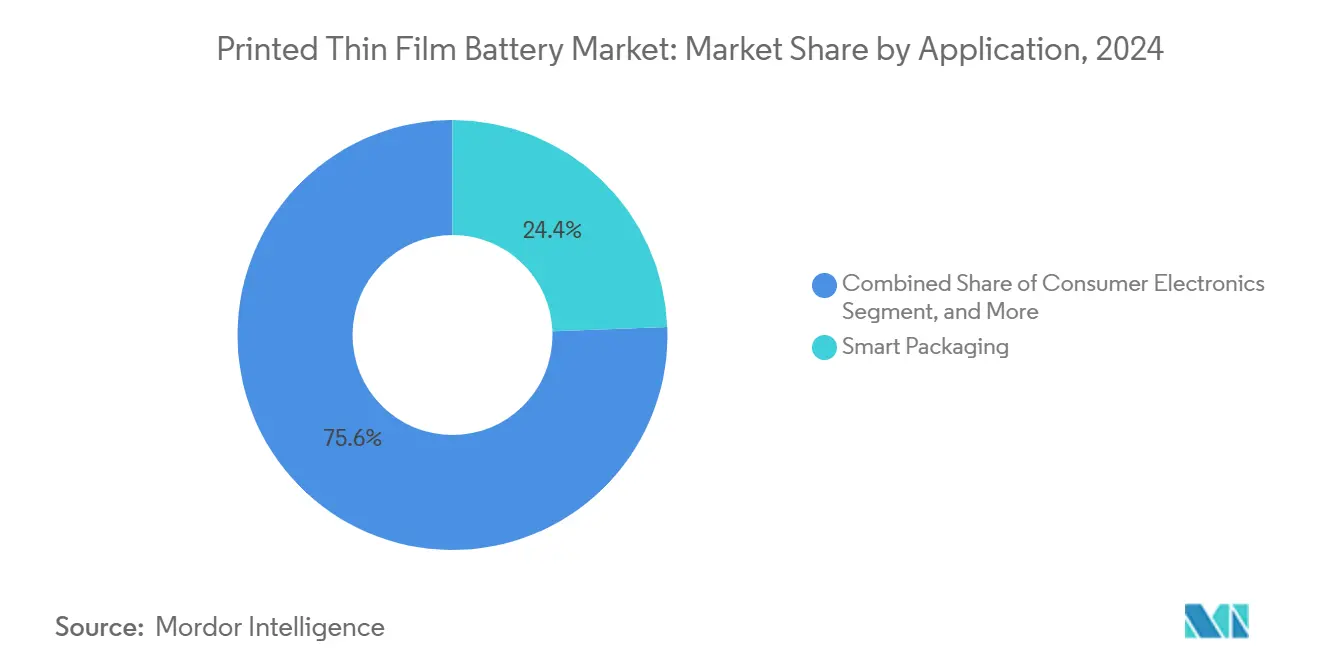
- By application, smart packaging led with 24.4% of the Printed Thin Film Battery market share in 2024, while energy-harvesting use cases are forecast to accelerate at a 28.1% CAGR through 2030.
- By chargeability, non-rechargeable variants held a 69.8% share of the Printed Thin Film Battery market size in 2024, yet rechargeable solutions are advancing at a 27.9% CAGR through 2030.
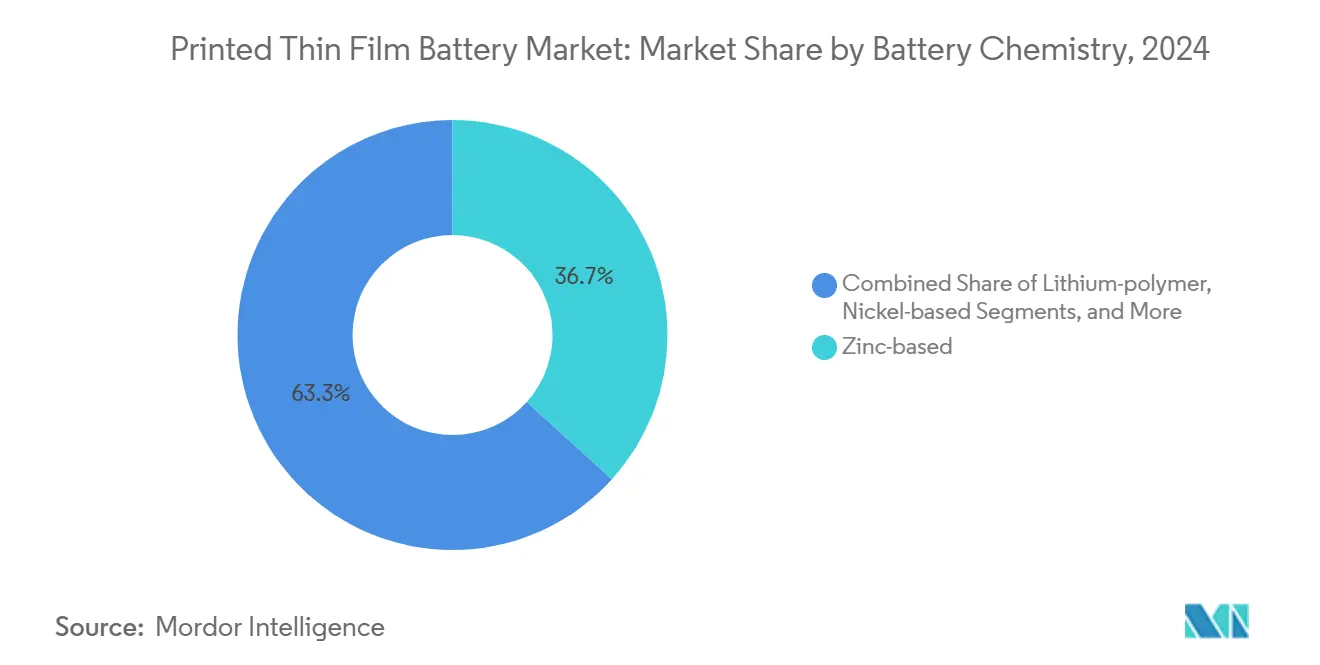
- By chemistry, zinc-based systems commanded 36.7% share of the Printed Thin Film Battery market size in 2024, whereas solid-state lithium configurations exhibit the fastest 28.3% CAGR to 2030.
- By voltage, 1.5–3 V platforms occupied 42.6% of the Printed Thin Film Battery market share in 2024, and above-5 V architectures are expanding at 27.7% CAGR through 2030.
- By geography, Asia-Pacific captured 35.2% of the Printed Thin Film Battery market size in 2024, and the region sustains the highest 26.4% CAGR toward 2030.
Global Printed Thin Film Battery Market Trends and Insights
Drivers Impact Analysis*
| Driver | (~) % Impact on CAGR Forecast | Geographic Relevance | Impact Timeline |
|---|---|---|---|
| Wearable and hearable device boom | +4.2% | North America, Asia-Pacific | Medium term (2-4 years) |
| Smart packaging and IoT label uptake | +3.8% | Europe, North America | Short term (≤ 2 years) |
| Point-of-care medical diagnostics surge | +3.1% | North America, Europe, spill-over to APAC | Medium term (2-4 years) |
| Miniaturization in consumer electronics | +2.9% | Asia-Pacific, global spread | Long term (≥ 4 years) |
| Flexible PV energy-harvesting integration | +2.7% | Europe, North America | Long term (≥ 4 years) |
| Pharma e-traceability and cold-chain rules | +2.4% | Europe, North America | Short term (≤ 2 years) |
| Source: Mordor Intelligence | |||
Growing Demand for Wearable and Hearable Devices
Printed Thin Film Battery market adoption in micro-wearables intensifies as hearables and health-tracking patches demand sub-millimeter power sources that withstand continuous flexing without capacity fade. Global hearable shipments crossed 1.2 billion units in 2024, elevating demand for batteries delivering 54 mAh cm² energy density and 72-hour endurance under varying ambient temperatures.[1]“Flexible Battery Technologies for Wearable Electronics,” IEEE Transactions on Electron Devices, ieee.org Compliance with IEC 62133 safety norms drives vendors to favor solid-electrolyte printed cells that eliminate leakage risks, reinforcing technology fit for mass-market consumer products.
Rising Adoption in Smart Packaging and IoT Labels
Serialization mandates under the U.S. Drug Supply Chain Security Act and EU digital battery passport rules make ultra-thin printed batteries indispensable for tamper-evident, temperature-logging labels.[2]“Drug Supply Chain Security Act Implementation,” FDA, fda.gov Roll-to-roll cost breakthroughs have trimmed integration expense by 34% since 2024, allowing smart trackers on mid-value pharma shipments instead of only high-end biologics. Performance reliability across –20 °C to +60 °C and moisture-resistant polymer substrates positions printed batteries ahead of coin cells in cold-chain workflows.
Surge in Point-of-Care Medical Diagnostics
Disposable diagnostic strips embedding printed batteries slash bill-of-materials costs by 43% and remove bulky housings, enabling single-use electronic pregnancy tests and rapid antigen devices. ISO 13485 mandates traceable quality checks, and printed energy modules satisfy sterilization cycles without electrolyte seepage. As healthcare shifts toward home-based testing, power-on-paper architectures unlock designs previously limited by battery girth and cost.
Miniaturization Trend in Consumer Electronics
Flagship smartwatches slimmed below 8 mm total thickness in 2025 by substituting conventional pouch cells with flexible zinc-polymer units, shrinking battery cavities by up to 80%. Semiconductor vendors leverage printed batteries to package sensor nodes under 10 mm³ for ubiquitous IoT, opening gateways for skin patches and smart contact lenses. Screen-printing yields >90% on zinc systems, and inks now cost USD 0.15 per device at high volumes, solidifying economic viability.
Restraints Impact Analysis*
| Restraint | (~) % Impact on CAGR Forecast | Geographic Relevance | Impact Timeline |
|---|---|---|---|
| Fragmented global form-factor standards | -2.1% | Global | Medium term (2-4 years) |
| High capex for solid-state lines | -1.8% | Asia-Pacific, Europe | Short term (≤ 2 years) |
| Solid-electrolyte precursor bottlenecks | -1.6% | Lithium-rich regions | Medium term (2-4 years) |
| Uncertain e-waste rules for polymer films | -1.3% | Europe, North America | Long term (≥ 4 years) |
| Source: Mordor Intelligence | |||
Lack of Global Standards for Printed Battery Formats
Absence of finalized IEC 63203 flex-battery protocols extends product qualification by up to 18 months, particularly penalizing multinational smart-packaging rollouts that must reconcile divergent test regimes across borders.[3]“IEEE Standards for Flexible Battery Testing,” IEEE Standards Association, ieee.org Harmonization delays also stall insurance certifications and shipping clearances, slowing time-to-market for high-volume consumer devices.
High Capital Intensity of Solid-State Production Lines
Installing vacuum deposition gear and in-line quality scanners pushes green-field solid-state printed battery plants above USD 50 million, a threshold few mid-tier suppliers can clear.[4]“Advanced Manufacturing Equipment for Solid-State Batteries,” Advanced Materials & Processes, asminternational.org Current yields hover near 75%, eroding margins until scale economies and process tweaks match legacy zinc-based line efficiencies. Government subsidies in South Korea and Japan partially offset start-up risk, but Western players face steeper payback hurdles.
*Our forecasts treat driver/restraint impacts as directional, not additive. The impact forecasts reflect baseline growth, mix effects, and variable interactions.
Segment Analysis
By Application: Smart Packaging Drives Diversification
Smart packaging generated 24.4% of 2024 revenue, underscoring its position as the single largest use case of the Printed Thin Film Battery market. Tight pharmaceutical traceability timelines, new food freshness indicators, and luxury brand anti-counterfeit tags keep volume momentum high. Energy-harvesting hybrids, although smaller today, post a 28.1% CAGR and pull advanced chemistries capable of pairing with organic photovoltaics for 5-year maintenance-free IoT nodes. Wearables remain pivotal, but growth tilts toward diagnostic patches and hearables rather than first-generation fitness bands. Industrial IoT sensors surface as an under-penetrated niche where printed batteries withstand vibration and extreme temperatures, giving OEMs reliable power in hard-to-service environments.
Continued cost downshifts drive penetration beyond premium goods. Printed Thin Film Battery market participants bundle analytics firmware so brands tap live freshness data, proving value beyond simple NFC tags. Pharmaceutical adopters benefit from 2-year shelf stability and full recyclability of zinc-manganese dioxide variants, addressing drug-quality liabilities. For energy-harvesting, co-printed batteries and PV inks reduce assembly steps, aligning with Industry 4.0’s push for in-line printed electronics.


By Chargeability: Rechargeable Momentum Accelerates
Non-rechargeable units still dominate with 69.8% share, reflecting massive single-use label volumes and diagnostics where disposal convenience trumps recharge economics. However, rechargeable formats register 27.9% CAGR through 2030, underpinned by solid-state electrolytes boasting >1,000 cycles and leakage-proof operation. For wearables and medical implants, the environmental plus of reusability pairs with regulatory pushes for product stewardship. Printed Thin Film Battery industry innovators now report cost premiums of only 15-20% over primaries, narrowing the historic gap that once discouraged OEM migration.
Design wins in smart glasses and advanced e-patches favor lithium thin-film chemistry for higher voltage and energy density. To address eco-concerns, vendors tout recyclable polymer substrates and modular design enabling core battery removal at end-of-life, aligning with EU take-back directives. Power-management ASICs tailored for sub-milliwatt trickle charging complement printed super-capacitors, further propelling the rechargeable path.
By Battery Chemistry: Solid-State Lithium Ascends
Zinc-manganese dioxide keeps a 36.7% foothold thanks to cost, benign disposal, and printability. Yet solid-state lithium logs the steepest 28.3% CAGR as it unlocks 400 Wh kg⁻¹ targets required by high data-rate sensors and medical implants. Traditional liquid lithium-polymer niches persist for mid-power gadgets, but safety and form-factor constraints elevate solid-state beyond 2026. Nickel-metal hydride derivatives serve high-temperature industrial nodes, while silver-oxide systems cater to niche ultra-high energy needs despite price premiums.
Chemistry decisions hinge on trade-offs between cost, energy density, flexibility, and environmental compliance. Supply-chain reliability weighs heavily; zinc enjoys diversified miners, whereas lithium-sulfide precursor shortages remain a swing factor that could temper solid-state ramp-ups if not resolved by 2027.
By Voltage Range: High-Voltage Adoption Quickens
Devices operating at 1.5–3 V house mainstream MCU-based IoT boards, explaining this bracket’s 42.6% revenue share. Above-5V printed batteries scale at 27.7% CAGR, meeting industrial LoRa gateways, tire-pressure modules, and autonomous robots needing higher transmission power. The 3–5 V segment underpins advanced medical wearables with onboard analytics. Sub-1.5 V cells remain relegated to ultra-low-power sensors paired with energy harvesters, but standardization may broaden appeal as component vendors roll out chipsets designed for 0.8 V operation.
Voltage dictates stack architecture: multi-layer printed designs achieve higher volts yet introduce lamination complexity and electrolyte interface resistance management. Continual material R&D targets ionic conductivity leaps so thicker stacks maintain flexibility without fracture.
Geography Analysis
Asia-Pacific controlled 35.2% of revenue in 2024 and is projected to expand at a 26.4% CAGR. China furnishes over 60% of global printed electronics output, benefiting from subsidies and a vast supplier basin. South Korea’s USD 2.8 billion stimulus fast-tracks solid-state scale-ups by Samsung SDI and LG Energy Solution, while Japan contributes process metrology and electrode ink innovation. Regional governments bundle tax breaks with R&D grants, ensuring volume leadership remains in the East.
North America, rich in medical device OEMs and defense projects, values domestic supply chains that guarantee IP security. U.S. startups leverage DARPA and ARPA-E grants to prototype flexible batteries for soldier-worn sensors and drone applications. Europe plots growth around sustainability: the EU Battery Regulation 2023/1542 enforces digital passports, recycling quotas, and carbon footprint disclosures that reward eco-optimized zinc chemistries. Germany’s Industrie 4.0 roll-out and France’s luxury-goods counterfeiting concerns sustain demand spikes in smart packaging.
Emerging markets in the Middle East, Africa, and South America pivot on agricultural digitalization. Brazilian exporters add temperature-tracking labels to mango and beef shipments, while Gulf smart-city blueprints embed printed batteries in structural health sensors. African health ministries pilot disposable printed-battery test kits to improve disease surveillance in remote clinics.

Competitive Landscape
Competition remains moderate. No single vendor surpasses 15% share, leading to a market concentration score of 5. Top incumbents include Samsung SDI, LG Energy Solution, Panasonic, and VARTA, each pairing scale with proprietary chemistries. Specialist players, Ilika, BrightVolt, Enfucell, Blue Spark, and Imprint Energy, differentiate via niche formulations and application-specific modules. Partnerships prevail: Bosch teamed with VARTA for automotive sensors, STMicroelectronics joined Printed Energy on PV-battery hybrids, and NEC collaborates with Murata to co-design high-frequency RFID power cells.
Strategic themes center on vertical integration, yield-boosting process automation, and IP fortification. Leading firms invest in roll-to-roll coaters with in-line X-ray inspection to push defect rates below 50 ppm. Others acquire solid-electrolyte startups to secure precursor pipelines and hedge material shortages. Software add-ons such as battery-health analytics increasingly accompany hardware, locking end-customers into ecosystem contracts that raise switching costs.
Technology adoption patterns reveal zinc chemistry as a volume anchor while solid-state lithium positions for premium margin slices. Asian conglomerates accelerate gigafactory blueprints, whereas Western peers emphasize specialty lines serving regulated niches. Supply diversification into sodium-based precursors garners R&D attention to mitigate lithium volatility, although commercial impact remains post-2030.
Printed Thin Film Battery Industry Leaders
STMicroelectronics N.V.
Panasonic Holdings Corp.
Murata Manufacturing Co., Ltd.
Ilika plc
Blue Spark Technologies, Inc.
- *Disclaimer: Major Players sorted in no particular order

Recent Industry Developments
- March 2025: Ilika closed a USD 15 million Series D to scale Stereax solid-state lines toward 10 million units per year capacity.
- February 2025: Samsung SDI opened a printed battery R&D center in Suwon after committing USD 50 million for solid-state lithium prototyping.
- January 2025: VARTA and Bosch formed a partnership to integrate printed batteries in automotive sensor nodes, targeting tire-pressure and cabin air monitors.
- December 2024: Enfucell tripled SoftBattery throughput by commissioning new roll-to-roll assets in Finland.


Global Printed Thin Film Battery Market Report Scope
Printed thin-film batteries are batteries holding the property of flexibility. Flexibility is achieved by fabricating the conducting additives on a flexible substrate by using printing or chemical deposition techniques. Current collectors in flexible batteries are in the form of ink or thin metal foil.
| Consumer Electronics |
| Wearable Technology |
| Energy Harvesting |
| Smart Packaging |
| Pharmaceutical and Medical Devices |
| Smart Cards |
| Industrial IoT Sensors |
| Others |
| Rechargeable |
| Non-rechargeable |
| Lithium-ion |
| Lithium-polymer |
| Solid-state lithium |
| Zinc-based (Zn/MnO?, Zn/Ag) |
| Nickel-based |
| Other chemistries |
| Below 1.5 V |
| 1.5 - 3 V |
| 3 - 5 V |
| Above 5 V |
| North America | United States |
| Canada | |
| Mexico | |
| South America | Brazil |
| Argentina | |
| Rest of South America | |
| Europe | Germany |
| United Kingdom | |
| France | |
| Italy | |
| Rest of Europe | |
| Asia-Pacific | China |
| Japan | |
| South Korea | |
| India | |
| Rest of Asia-Pacific | |
| Middle East | Saudi Arabia |
| United Arab Emirates | |
| Rest of Middle East | |
| Africa | South Africa |
| Rest of Africa |
| By Application | Consumer Electronics | |
| Wearable Technology | ||
| Energy Harvesting | ||
| Smart Packaging | ||
| Pharmaceutical and Medical Devices | ||
| Smart Cards | ||
| Industrial IoT Sensors | ||
| Others | ||
| By Chargeability | Rechargeable | |
| Non-rechargeable | ||
| By Battery Chemistry | Lithium-ion | |
| Lithium-polymer | ||
| Solid-state lithium | ||
| Zinc-based (Zn/MnO?, Zn/Ag) | ||
| Nickel-based | ||
| Other chemistries | ||
| By Voltage Range | Below 1.5 V | |
| 1.5 - 3 V | ||
| 3 - 5 V | ||
| Above 5 V | ||
| By Geography | North America | United States |
| Canada | ||
| Mexico | ||
| South America | Brazil | |
| Argentina | ||
| Rest of South America | ||
| Europe | Germany | |
| United Kingdom | ||
| France | ||
| Italy | ||
| Rest of Europe | ||
| Asia-Pacific | China | |
| Japan | ||
| South Korea | ||
| India | ||
| Rest of Asia-Pacific | ||
| Middle East | Saudi Arabia | |
| United Arab Emirates | ||
| Rest of Middle East | ||
| Africa | South Africa | |
| Rest of Africa | ||


Key Questions Answered in the Report
What is the current value of the Printed Thin Film Battery market?
The market is worth USD 301.31 million in 2025 and is forecast to hit USD 941.80 million by 2030.
Which segment shows the fastest growth through 2030?
Energy-harvesting applications lead with a 28.1% CAGR, reflecting demand for hybrid PV-battery IoT nodes.
Why is Asia-Pacific the largest regional base?
China’s 60% share of global printed electronics capacity, plus South Korea’s USD 2.8 billion solid-state stimulus, anchor regional dominance.
How do printed batteries benefit smart packaging?
They power embedded sensors without adding bulk, delivering 2-year shelf life and operating across 20 °C to +60 °C ranges.
What is the main hurdle for solid-state printed battery scaling?
Capital outlays exceeding USD 50 million per line and current yield rates below 75% slow widespread commercialization.
Page last updated on:


