
Teleradiology Market Size and Share
Market Overview
| Study Period | 2020 - 2031 |
|---|---|
| Market Size (2026) | USD 7.6 Billion |
| Market Size (2031) | USD 14.67 Billion |
| Growth Rate (2026 - 2031) | 14.08 % |
| Fastest Growing Market | Asia-Pacific |
| Largest Market | North America |
| Market Concentration | Medium |
Major Players *Disclaimer: Major Players sorted in no particular order Image © Mordor Intelligence. Reuse requires attribution under CC BY 4.0. | |
Teleradiology Market Analysis by Mordor Intelligence
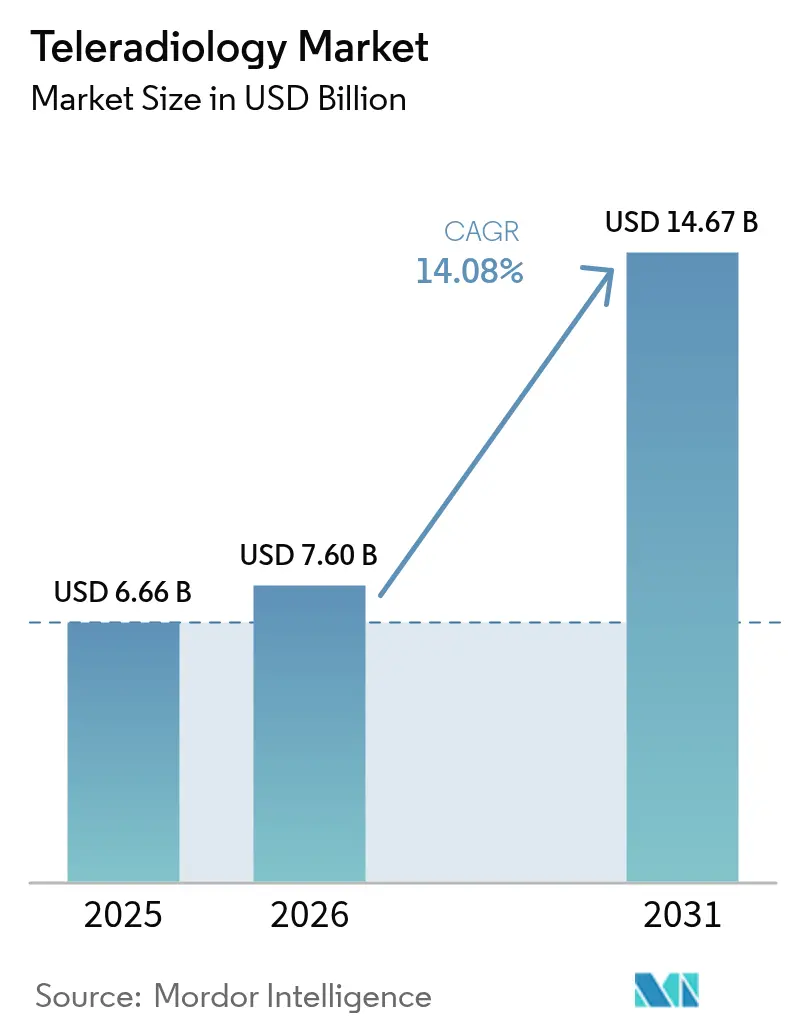
Teleradiology market size in 2026 is estimated at USD 7.6 billion, growing from 2025 value of USD 6.66 billion with 2031 projections showing USD 14.67 billion, growing at 14.08% CAGR over 2026-2031. The surge aligns with widening radiologist shortages, rapid broadband expansion, and cloud-first imaging platforms that convert once-optional remote reading into a core clinical utility. Workforce gaps—expected to leave the United Kingdom 40% short of radiologists by 2028—mirror similar deficits across OECD members and keep remote diagnostics in permanent demand. At the same time, radiology volumes continue to climb as aging populations require more cross-sectional imaging, driving health systems toward outsourced overnight coverage and subspecialty reads. AI-enabled triage and zero-footprint viewers reduce turnaround time and capital outlays, attracting providers seeking flexible growth.[1]Source: American College of Radiology, “Teleradiology,” acr.org Consolidation is accelerating: ONRAD’s January 2025 purchase of Direct Radiology created a scaled platform serving 550 sites and signalled to investors that teleradiology has moved from a fragmented service to a strategic infrastructure layer.
Key Report Takeaways
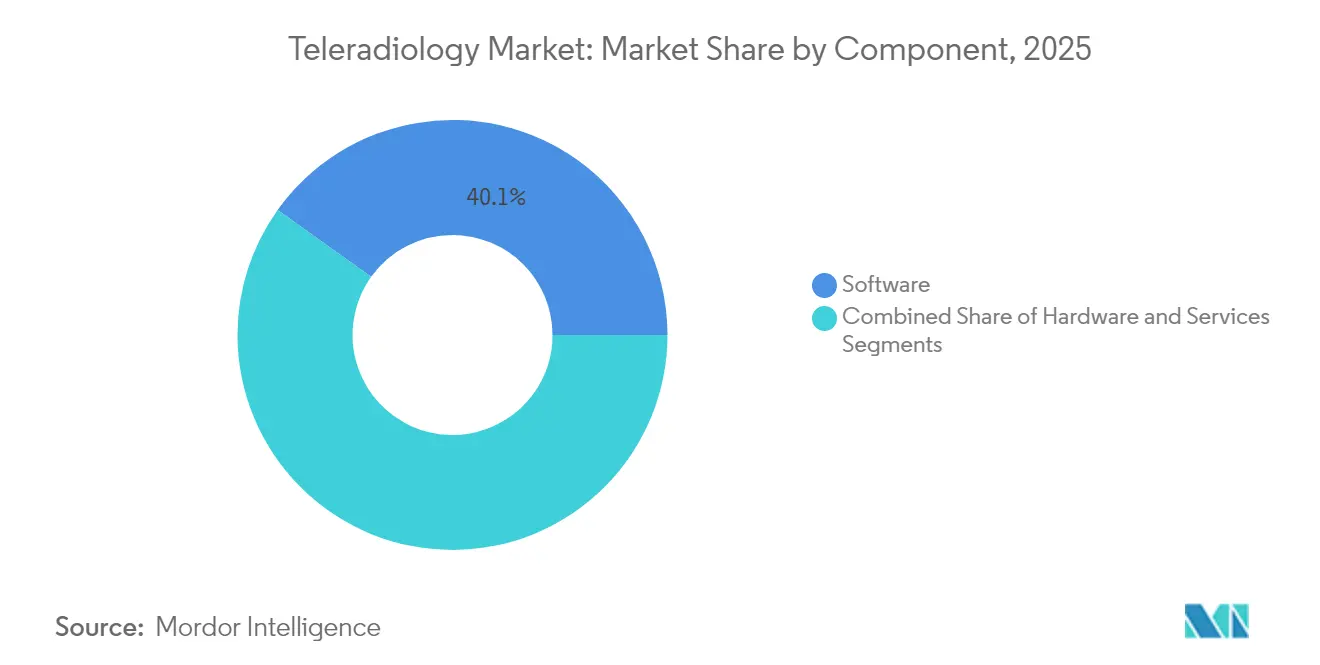
- By component, software held 40.12% of 2025 revenue; hardware is on track for the fastest 14.85% CAGR through 2031.
- By imaging technique, CT led with 32.35% teleradiology market share in 2025, while MRI is forecast to post a 14.62% CAGR to 2031.
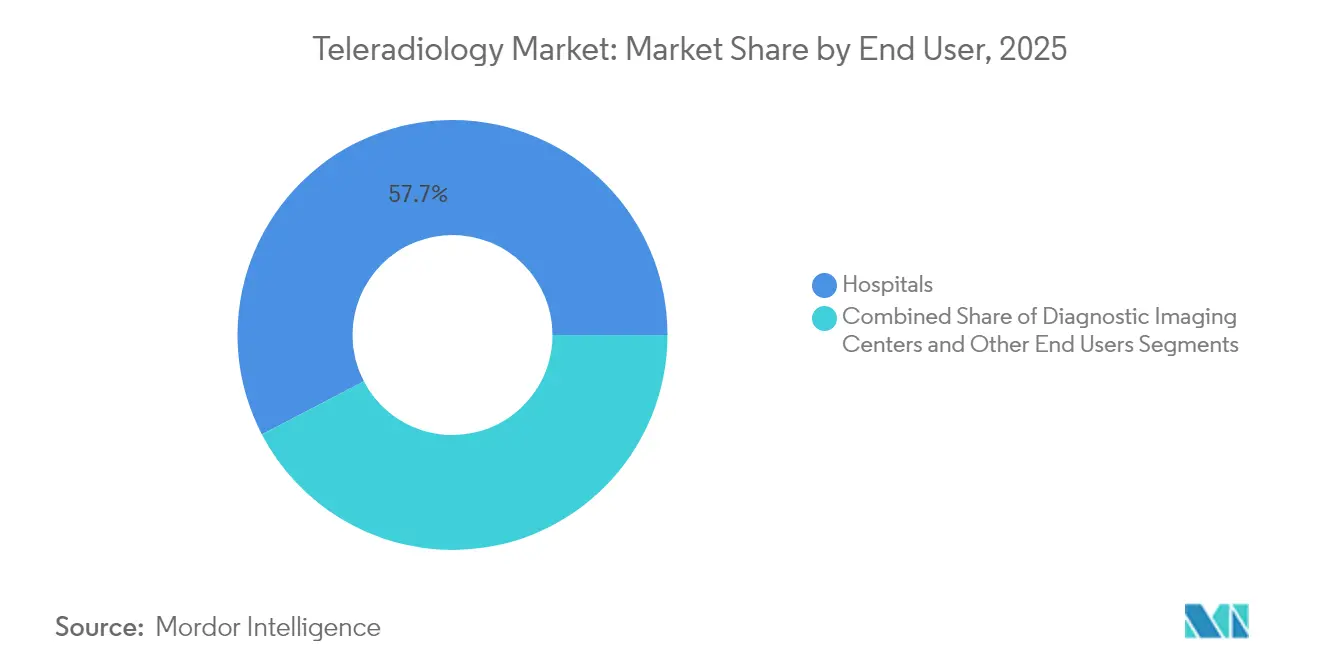
- By end user, hospitals accounted for 57.65% of 2025 revenue; diagnostic imaging centers are set to expand at a 15.21% CAGR through 2031.
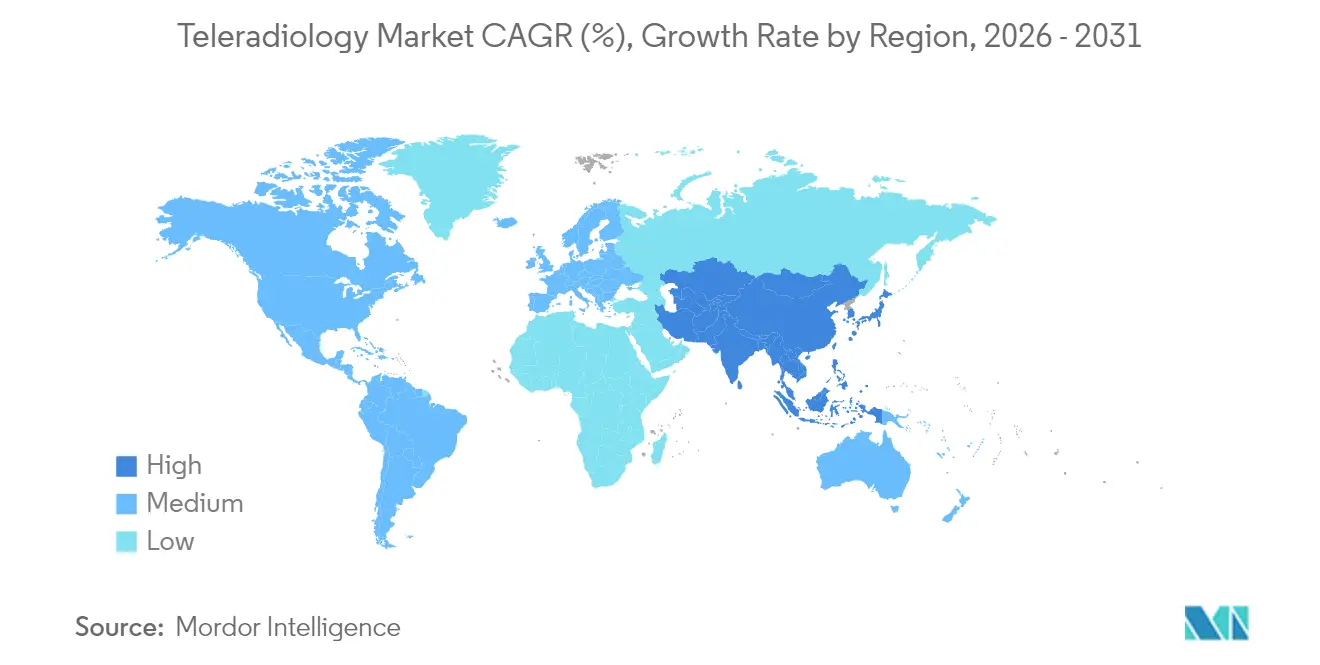
- By geography, North America dominated with 38.41% revenue in 2025; Asia-Pacific is projected to register the quickest 15.78% CAGR to 2031.
Note: Market size and forecast figures in this report are generated using Mordor Intelligence’s proprietary estimation framework, updated with the latest available data and insights as of 2026.
Market Trends and Insights
Drivers Impact Analysis of Teleradiology Market*
| Driver | (~) % Impact on CAGR Forecast | Geographic Relevance | Impact Timeline |
|---|---|---|---|
| Shortage of Radiologists in OECD Countries | +3.2% | North America & Europe, spillover to APAC | Long term (≥ 4 years) |
| Rising Global Diagnostic-Imaging Volumes | +2.8% | Global | Medium term (2-4 years) |
| Expansion of 5G & Satellite Broadband Connectivity | +2.1% | Global, with early gains in North America, Europe, APAC | Medium term (2-4 years) |
| AI-Enabled Work-List Triage Boosting Reading Capacity | +1.9% | Global | Short term (≤ 2 years) |
| Overnight "Follow-The-Sun" Service Outsourcing | +1.7% | Global | Short term (≤ 2 years) |
| Cloud-Native Zero-Footprint Viewers Reducing CAPEX | +1.5% | Global | Short term (≤ 2 years) |
| Source: Mordor Intelligence | |||
Shortage of Radiologists in OECD Countries
Demand for imaging is climbing 27% over three decades, yet radiologist headcount growth is flat, leaving hospitals without round-the-clock coverage, especially in neurology, musculoskeletal, and cardiothoracic subspecialties. Remote reading fills both geographic and temporal gaps, supports emergency departments, and appeals to younger physicians who prioritize flexible schedules. Rural and underserved regions, in particular, rely on remote diagnostics because running an in-house radiology department is cost-prohibitive. The structural nature of the shortage ensures long-term demand for teleradiology services.
Rising Global Diagnostic-Imaging Volumes
Projected 2055 modality growth—CT 25.1%, nuclear medicine 26.9%, X-ray 17.8%, ultrasound 17.3%, MRI 16.9%—adds pressure on health systems already grappling with staffing constraints. Chronic diseases, aging demographics, and expanded screening initiatives drive the volume uptick. Teleradiology allows facilities to absorb workload spikes without proportional payroll growth and ensures subspecialists interpret complex cases without patients travelling to tertiary centers.
Expansion of 5G & Satellite Broadband Connectivity
Low-earth-orbit constellations now deliver 50-56 Mbps to remote sites, shrinking latency and allowing live image transfer from previously disconnected clinics.[2]Source: Lifetrack Medical Systems, “Starlink’s Potential Impact on Remote Radiology,” lifetrackmed.com Coupled with 5G, the infrastructure lets teleradiology providers enter emerging markets quickly, support trauma and stroke imaging, and widen service portfolios to include real-time consultations. These connectivity improvements enable teleradiology expansion into markets where infrastructure limitations previously prevented service delivery, creating new revenue opportunities for established providers while improving healthcare access in underserved regions. The reduced latency particularly benefits time-sensitive applications like stroke imaging and trauma cases where diagnostic delays directly impact patient outcomes.
AI-Enabled Work-List Triage Boosting Reading Capacity
Generative AI can suppress 53% of cases requiring manual review, shrinking report turnaround and halving error rates through automated quality checks. Vendors claim 90% fewer dictated words for routine reports, freeing specialists to focus on complex pathology. These gains translate into faster service levels, elevating provider competitiveness and reinforcing AI as a central purchase criterion. This technology adoption creates competitive advantages for teleradiology providers that can offer faster turnaround times and enhanced diagnostic accuracy compared to traditional radiology practices.
Restraints Impact Analysis of Teleradiology Market*
| Restraint | (~) % Impact on CAGR Forecast | Geographic Relevance | Impact Timeline |
|---|---|---|---|
| Cyber-Security & Data-Sovereignty Concerns | -2.3% | Global, particularly Europe and Asia-Pacific | Medium term (2-4 years) |
| Multi-State Licensure and Credentialing Hurdles | -1.8% | North America, with spillover effects globally | Long term (≥ 4 years) |
| Satellite-Link Latency in Remote Areas | -1.2% | Global, particularly rural and developing regions | Short term (≤ 2 years) |
| Organized Radiologist-Union Pushback in Europe | -0.9% | Europe | Medium term (2-4 years) |
| Source: Mordor Intelligence | |||
Cyber-Security & Data-Sovereignty Concerns
In 2024, 88% of healthcare entities reported a breach, affecting 106 million Americans. Legacy PACS lack modern safeguards, and ransomware has caused downtimes exceeding a month and losses above USD 63 million. Strict frameworks such as GDPR elevate compliance costs for cross-border reads, prompting buyers to vet vendor security posture rigorously and favor partners offering cyber-insurance and sovereign-cloud deployment options.
Multi-State Licensure and Credentialing Hurdles
U.S. radiologists must hold a license in both the imaging site’s state and their reading location, adding administrative overhead, renewal fees, and months-long credentialing queues. International guidelines are equally stringent, limiting cross-border teleradiology even when technology is ready. Smaller providers struggle with compliance costs, tilting competitive advantage toward large networks with dedicated legal teams.
*Our forecasts treat driver/restraint impacts as directional, not additive. The impact forecasts reflect baseline growth, mix effects, and variable interactions.
Teleradiology Market Segment Analysis
By Component:
Software Dominance Drives Cloud MigrationSoftware solutions generated 40.12% of 2025 revenue, a position underpinned by subscription models that cut capital outlays and provide automatic upgrades. These cloud platforms integrate AI modules, zero-footprint viewers, and vendor-neutral archives that clinicians can reach on any device. GE HealthCare’s Genesis portfolio exemplifies this move toward elastic infrastructure that synchronizes multisite workflows. Hardware, representing on-premise servers, high-resolution workstations, and network equipment, is set to post the briskest 14.85% CAGR as 5G gateways and edge devices proliferate and as rural hospitals add satellite receivers to link with metropolitan reading hubs. Service contracts keep expanding as outsourcing becomes mainstream, but the teleradiology market size for services scales steadily rather than explosively because buyers blend vendor assistance with in-house IT teams.
The software wave creates cost savings near 30% by eliminating data-center maintenance and unlocking pay-as-you-go scalability. Vendors differentiate by embedding AI orchestration that routes studies based on priority and subspecialty, reducing idle time and failed handoffs. Hybrid cloud-edge designs ensure image pre-processing happens locally, then the study transfers securely to public clouds for AI inference, an architecture that satisfies privacy obligations while preserving bandwidth. As a result, facilities across mid-income countries can spin up full-featured imaging solutions without multimillion-dollar infrastructure, widening the addressable teleradiology market.



By Imaging Technique:
CT Leadership Meets MRI InnovationComputed tomography accounted for 32.35% revenue in 2025, reflecting its indispensability across trauma, oncology staging, and lung screening. Standardized protocols allow streamlined remote reading, supporting emergency departments that need sub-30-minute turnaround. The modality’s entrenched reimbursement codes and ubiquitous scanner base shield it from disruptive swings. The teleradiology market size for CT continues to benefit from algorithmic noise-reduction techniques that cut radiation dose, thereby expanding usage windows into pediatrics and serial follow-up.
Magnetic resonance imaging is projected to climb at a 14.62% CAGR, the fastest among modalities. AI-enhanced segmentation and automated quantification shorten scan times and simplify interpretation, letting rural facilities capture complex neuro and ortho studies and forward them to subspecialist radiologists. Helium-free compact systems reduce siting costs, unlocking new buyer cohorts. Ultrasound’s point-of-care surge and AI-driven lesion characterization keep it relevant, while X-ray remains foundational for primary care and urgent clinics. Nuclear imaging, though niche, commands high margins in oncology where tracer specificity demands expert reads seldom available on site.
By End User:
Hospital Consolidation Drives Imaging Center GrowthHospitals controlled 57.65% of 2025 revenue, the largest teleradiology market share, because they use remote reads for overnight coverage, subspecialty consultations, and multi-site coordination that keeps quality consistent across the network. Their mature purchasing teams, integrated IT systems, and established reimbursement pathways let them embed cloud viewers and AI triage tools without disrupting clinical workflows. Many large systems now run core daytime reading internally but lean on teleradiology to handle peaks and rare subspecialties, preserving staff productivity and patient safety standards. Teaching hospitals also rely on remote reads to expose residents to a wider mix of cases and expert feedback, strengthening academic programs. These factors keep hospitals at the center of the enterprise imaging ecosystem even as financial pressures push them to optimize every scan’s cost.
Diagnostic imaging centers are expanding fastest, with a 15.21% CAGR to 2031, as they tap teleradiology partnerships for subspecialist reads while avoiding the payroll burden of full-time radiologists. Outpatient imaging volumes are expected to rise 13% a year, especially for CT and PET, which lifts the teleradiology market size for these centers without forcing major capital outlays. Private equity has recognized the model’s scalability, evident in Affinity Equity Partners’ USD 658 million buyout of Lumus Imaging in Australia, signalling confidence in distributed diagnostic networks. Urgent-care chains and specialty clinics are following suit; Experity’s FDA-cleared AI fracture-detection tool shows how targeted software can plug into remote reading workflows and open new revenue streams.
Geography Analysis
North America Teleradiology Market
North America led with 38.41% revenue in 2025 on the back of Medicare coverage, robust fiber networks, and established malpractice frameworks that reassure buyers. However, looming 3-4% Medicare fee cuts in 2025 pressure hospital margins, prompting administrators to accelerate cost-saving remote reads. Private equity remains active: RadNet’s USD 103 million iCAD acquisition augmented its AI breast-imaging toolkit, reinforcing scale advantages. Canada and Mexico adopt cross-border teleradiology for night coverage, leveraging bilingual radiologists to smooth regional workflow.
APAC Teleradiology Market
Asia-Pacific is forecast for a 15.78% CAGR, the highest worldwide. Government programs in China and India subsidize PACS rollouts and broadband to primary health centers, while middle-class growth fuels demand for high-resolution MRI and CT. Investments in AI for MedTech are projected to hit USD 250 million by 2028, and companies such as RamSoft have planted regional hubs to serve multilingual clients. Australia’s I-Med Radiology Network, valued near USD 2 billion, showcases investor appetite for regional consolidation.
Europe Teleradiology Market
Europe maintains steady momentum as 84% of EU members already employ teleradiology in some form. Yet data-sovereignty rules and union resistance temper velocity. The United Kingdom’s Hexarad—backed by EUR 13 million in growth funding—adds over 200 radiologists to its roster, illustrating how platform plays can thrive even in regulated environments. Germany’s outpatient clinics show positive attitudes, with 79.2% of referring physicians rating remote reading favorably, pointing to unmet demand in rural districts.
Mordor Intelligence provides coverage of the teleradiology market across other key regional markets. Detailed country-level analysis extends to India incorporating local coverage and market participation, as required.

Regulatory Landscape
Teleradiology sits across medical-practice rules, reimbursement policy, privacy requirements, and medical-device software oversight. In the United States, payer and enrollment mechanics shape contracting models, including the CMS-855I process in PECOS that supports electronic reassignment of billing rights for contracted physicians, while multi-jurisdiction practice is constrained by state licensure requirements. The Interstate Medical Licensure Compact provides a streamlined pathway across participating U.S. jurisdictions (29 states, the District of Columbia, and Guam), but credentialing and renewals still add time and cost for multi-state coverage networks.
In Europe, cross-border delivery is governed by national establishment rules alongside evolving EU data frameworks. The Court of Justice of the European Union decision in Case C-115/24 emphasized that cross-border telemedicine services must comply with the legislation of the Member State where the provider is established, increasing the need for localized legal monitoring for pan-European reading groups. At the same time, the European Health Data Space under Regulation (EU) 2025/327 sets a formal framework for cross-border health data use and exchange, tied to MyHealth@EU, which elevates the importance of interoperable image exchange and compliance-ready data governance in EU teleradiology workflows.
Competitive Landscape
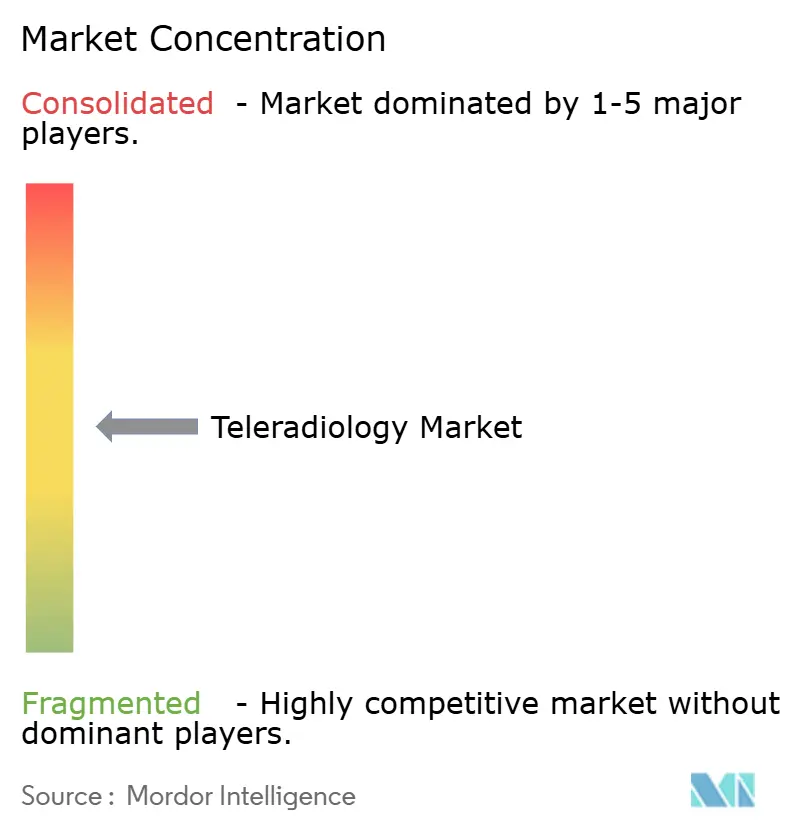
Teleradiology remains moderately fragmented. The top five providers control substantial portion of global invoice value, leaving room for regional specialists focused on trauma, pediatrics, or night-hawk services. Consolidation accelerated in 2025 when ONRAD merged Direct Radiology into its network, stretching coverage to 550 sites and signalling a race toward scale economics. Rad AI’s USD 60 million raise at a USD 525 million valuation underscores how AI performance now differentiates vendors by reducing fatigue and tightening report quality.
Technology partnerships multiply: GE HealthCare collaborates with AWS on generative AI and with NVIDIA on autonomous imaging, combining hyperscale cloud with specialized hardware to slash inference latency. Siemens Healthineers and Sectra sealed a radiology data-sharing partnership in February 2025, signalling incumbent equipment makers’ urgency to offer end-to-end remote reading stacks.
Barriers to entry rise as hospital systems pivot to multiyear platform contracts covering AI, cloud PACS, cybersecurity, and subspecialty staffing, limiting opportunities for ad-hoc night-hawk boutiques. Yet niche players prosper by targeting urgent care centers, orthopedic clinics, and mobile mammography fleets that value specialized workflows. Advanced vendors wrap cybersecurity guarantees, sovereign-cloud hosting, and credentialing support into single-fee packages, appealing to compliance-conscious buyers in Europe and Asia.
Teleradiology Industry Leaders
Agfa-Gevaert Group
Everlight Radiology
RamSoft Inc.
Nanox Imaging LTD (USARAD.COM)
GE HealthCare
- *Disclaimer: Major Players sorted in no particular order
Teleradiology Market Companies Covered in this Report
- GE Healthcare
- Koninklijke Philips
- Siemens Healthineers
- Agfa-Gevaert
- FUJIFILM
- Everlight Radiology
- Virtual Radiologic (vRad / Mednax)
- ONRAD Inc.
- Teleradiology Solutions
- Nanox Imaging (USARAD)
- 4ways Healthcare
- Ram Soft
- Carestream Health
- StatRad (NucleusHealth)
- Telemedicine Clinic (Unilabs)
- Vision Radiology
- Doctor-Net Inc.
- Ambra Health
- Sectra
- RadNet Inc.

Market Opportunities and Future Outlook
Platform consolidation and coverage expansion create room for integrated, multi-site service models that bundle subspecialty reads with workflow orchestration and enterprise imaging connectivity. In 2026, Premier Radiology Services expanded through acquisitions of NRAD (January 2026) and Global Imaging Solutions (April 2026), pointing to continued buyer demand for scaled provider groups that can support outpatient, orthopedic, and multi-modality interpretation needs under unified operations. Similar scale dynamics show up in ONRAD Inc. acquiring Direct Radiology in January 2026, reinforcing the shift toward larger networks that can manage credentialing overhead, standardize service levels, and negotiate multiyear platform-style relationships.
AI-enabled reporting and cloud-native image exchange form a second opportunity lane where turnaround time and radiologist capacity are binding constraints. Natoe AI expanded AI-native teleradiology services in July 2026 using AI-drafted pre-read reports, while enterprise imaging vendors are positioning cloud-native orchestration and vendor-neutral image exchange as baseline capabilities for distributed delivery. This combination creates a clear integration path for providers and software vendors to add AI triage or pre-read tooling to existing RIS/PACS and enterprise imaging stacks, align deployments with data-sovereignty requirements (notably in Europe), and document operational improvements for hospitals and fast-growing outpatient imaging centers.
Recent Industry Developments in Teleradiology Market
- May 2026: Sirona Medical announced a five-year global strategic partnership with Everlight Radiology to deploy the cloud-native RadOS platform, supporting around 800 radiologists across 350 hospitals. The agreement formalizes multi-year platform adoption rather than ad-hoc remote reading, reinforcing the shift toward standardized cloud workflows across large, distributed provider networks.
- September 2025: RamSoft partnered with Koios Medical to integrate AI-powered software for breast and thyroid cancer diagnosis into RamSoft RIS/PACS platforms. The integration strengthens the role of embedded clinical AI within remote reading workflows and supports providers looking to add decision-support capabilities without replacing core imaging IT.
- September 2024: Experity integrated FDA-cleared AI for fracture detection into its urgent-care teleradiology over-read services. This expanded AI-assisted triage in high-volume, time-sensitive settings, tightening turnaround expectations for remote interpretation offerings serving urgent care centers.


Teleradiology Market Report Scope and Research Methodology
Market Definition and Coverage
For this study, the teleradiology market is the revenue generated from remote radiology image transfer, reading, and reporting workflows that allow interpretation to be delivered off-site for clinical decision making.
Scope exclusions: This sizing does not count on-site radiology department staffing costs and local facility overheads that are not directly tied to remote reading and reporting activity.
Segments Covered in This Report
- By Component
- Hardware
- Software
- Services
- By Imaging Technique
- X-ray
- Computed Tomography (CT)
- Magnetic Resonance Imaging (MRI)
- Ultrasound
- Nuclear Imaging
- Mammography
- Other Techniques
- By End User
- Hospitals
- Diagnostic Imaging Centers
- Other End Users
- By Geography
- North America
- United States
- Canada
- Mexico
- Europe
- Germany
- United Kingdom
- France
- Italy
- Spain
- Rest of Europe
- Asia-Pacific
- China
- Japan
- India
- Australia
- South Korea
- Rest of Asia-Pacific
- Middle East and Africa
- GCC
- South Africa
- Rest of Middle East and Africa
- South America
- Brazil
- Argentina
- Rest of South America
- North America
Data Sources, Market Sizing, and Validation
Desk Research
Desk work started with building a clean view of imaging demand and delivery constraints across regions, and then mapping how much of that workload can move to remote reads. Public sources were used to set grounded ranges, such as Centers for Medicare and Medicaid Services utilization files, OECD Health Statistics, World Health Organization indicators, and publications from radiology societies such as the Radiological Society of North America and the American College of Radiology.
We also reviewed company annual reports, investor presentations, public tender portals, and reputed healthcare press to cross-check service mix changes, turnaround time expectations, and typical contracting models. Where gaps remained, paid subscriptions that aggregate company financials and news, patent databases, and an import and export shipment-level database were used selectively to validate vendor activity signals and technology adoption direction. These desk sources are illustrative, and many other public documents and datasets were also referenced for data collection, validation, and clarification.
Primary Interviews and Surveys
Primary work focused on interviews and short surveys with hospital imaging leaders, diagnostic center administrators, radiologists, and workflow and IT managers who run or procure remote interpretation services. Coverage was balanced across APAC, EMEA, and the Americas so that regional licensing practices, night-coverage demand, and modality mix differences could be checked and then fed back into assumptions.
Distribution of primary research fieldwork respondents
| Company type | Respondent position | Region |
|---|---|---|
| Top tier: 37% | CXOs: 14% | APAC: 45% |
| Mid tier: 49% | Functional/Unit leaders: 35% | EMEA: 34% |
| Smaller Players: 14% | Managers: 51% | Americas: 21% |
Market-Sizing & Forecasting
Sizing was built using a top-down approach where imaging procedure volumes, modality shares (CT, MRI, X-ray, ultrasound, and nuclear imaging), and the addressable remote reading penetration are combined to reconstruct the revenue pool by region, before totals are rolled up to a global value. Since the market also links to delivery capacity, the model uses radiologist availability signals, after-hours coverage needs, and average reporting fees by modality as key inputs that explain why remote interpretation gets adopted.
To keep the numbers practical, the totals were then cross-checked using selective bottom-up approximations, including sampled price per read times estimated read volumes for a set of service types, and channel checks on outsourcing intensity at hospitals and diagnostic centers. Where data was missing for smaller countries, proxy assumptions were applied using neighboring utilization patterns and healthcare spending indicators, and then adjusted after expert feedback. Forecasting relied mainly on scenario analysis tied to the expected pace of remote workflow adoption, regulatory acceptance, and imaging growth, with the final curve moderated using input ranges validated through primary discussions.
Data Validation & Update Cycle
Outputs were validated through triangulation across procedure volumes, modality trends, and the implied spend per interpreted study, which helped surface outliers early. When a region showed an unusual jump, the drivers were re-checked, and respondents were re-contacted if the variance could not be explained by policy shifts, capacity constraints, or pricing changes.
Before sign-off, the model and assumptions go through multi-step analyst review so that arithmetic, unit consistency, and currency conversions are confirmed. The report is refreshed annually, and interim updates are made when material events occur that can change demand or pricing. Right before delivery, a final review pass is completed so clients receive the most current view available.
Mordor Intelligence's Global Teleradiology Market Size Versus Other Published Estimates
Published teleradiology market values can look far apart even when the topic sounds the same, because the counted revenue pool is not always defined in the same way. Differences usually come from what is included as market revenue, the year used as the anchor, and how adoption and pricing are projected across regions.
The table points to a wide spread that is largely explained by scope and what gets counted as teleradiology revenue. Under Mordor Intelligence's scope, the number is built around a global view that is tied to imaging techniques, components (hardware and software), and end users, while some other estimates fold adjacent categories into the same headline number or use aggressive assumptions for price and penetration growth.
Benchmark comparison
| Source | Market Size | Gaps in Research Methodology |
|---|---|---|
| Mordor Intelligence | USD 7.60 B (2026) | |
| Industry Publisher A | USD 6.29 B (2024) | Uses a different base year and may reflect a narrower revenue capture anchored to 2024 conditions, which can understate the uplift expected from after-hours coverage expansion and rising remote read penetration. |
| Industry Publisher B | USD 12.46 B (2024) | Appears to include a broader bundle that can combine services with enabling software and hardware revenue more fully, which tends to inflate the total when compared to service-led interpretations tied back to imaging demand signals. |
Taken together, the spread is best read as a scope and assumption difference rather than a disagreement on direction. By keeping the model traceable to procedure volumes, modality mix, penetration, and realistic pricing ranges, we can explain each input step and keep the total repeatable when the same signals are updated.


Key Questions Answered in the Report
What is the current size of the teleradiology market?
The market is valued at USD 7.6 billion in 2026 and is projected to reach USD 14.67 billion by 2031.
Which component generates the most revenue?
Software leads with 40.12% of 2025 revenue owing to cloud-based platforms and embedded AI.
Which modality grows fastest?
MRI shows the quickest 14.62% CAGR through 2031 as AI shortens scan and interpretation time.
Why is Asia-Pacific the fastest-growing region?
Government digitization, growing middle-class demand, and large-scale broadband programs drive a 15.78% CAGR.
How does AI influence teleradiology?
AI automates triage, reduces dictation time by up to 90%, and cuts report errors, allowing radiologists to focus on complex studies.
What are the main barriers to adoption?
Cybersecurity risks and multi-state licensure requirements remain the top operational challenges for providers expanding across borders.
Page last updated on:





