
Global Pressure Relief Valves Market Size and Share
Market Overview
| Study Period | 2020 - 2031 |
|---|---|
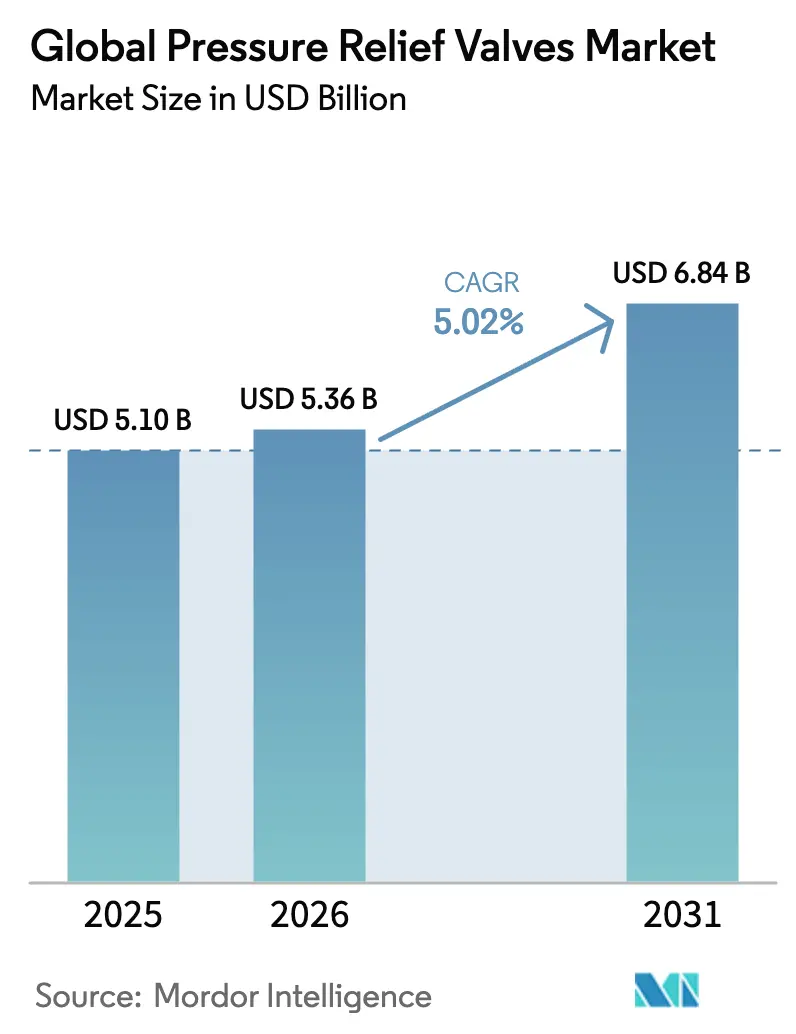
| Market Size (2026) | USD 5.36 Billion |
| Market Size (2031) | USD 6.84 Billion |
| Growth Rate (2026 - 2031) | 5.02 % |
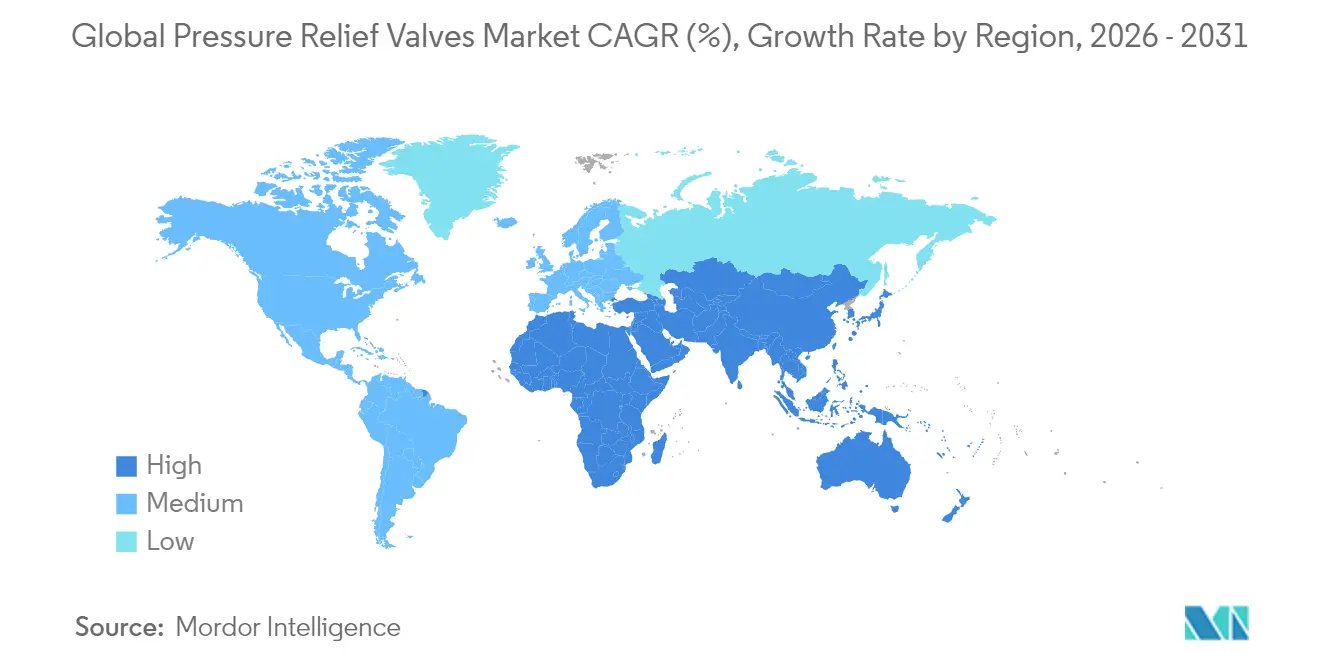
| Fastest Growing Market | Middle East and Africa |
| Largest Market | Asia Pacific |
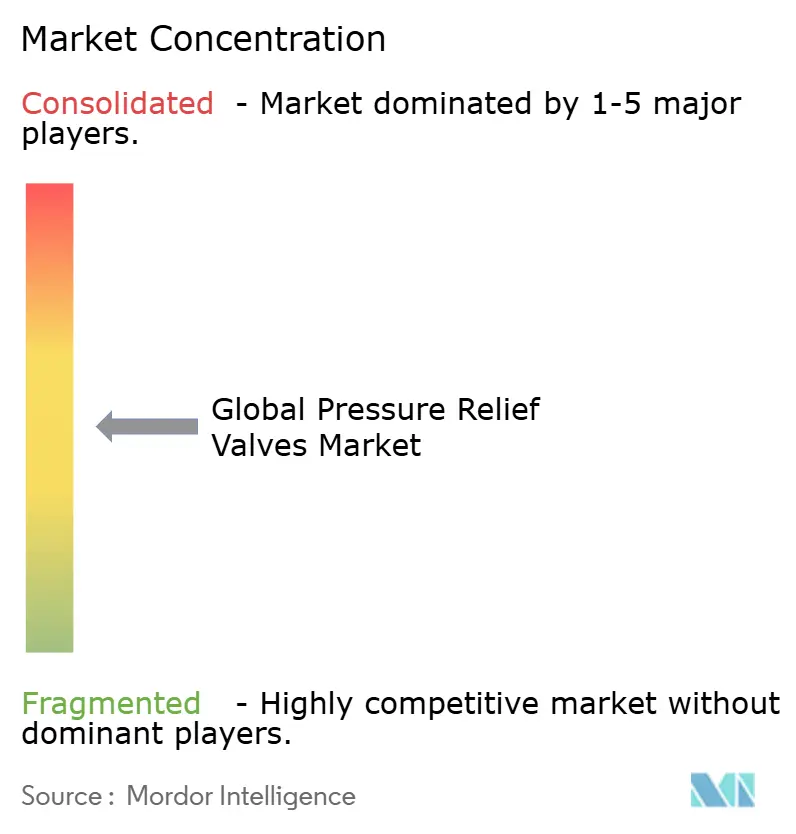
| Market Concentration | Medium |
Major Players *Disclaimer: Major Players sorted in no particular order Image © Mordor Intelligence. Reuse requires attribution under CC BY 4.0. | |
Global Pressure Relief Valves Market Analysis by Mordor Intelligence
The pressure relief valves market size is expected to grow from USD 5.1 billion in 2025 to USD 5.36 billion in 2026 and is forecast to reach USD 6.84 billion by 2031 at 5.02% CAGR over 2026-2031. The outlook reflects compulsory adherence to API 526 and ASME rules in process plants, rapid construction of LNG and hydrogen facilities, and expanding pharmaceutical capacity that requires sanitary-grade over-pressure protection. Intensifying modernization of brownfield refineries in the Middle East, coupled with rising deployment of digital maintenance systems, further underpins demand for smart, HART- or IIoT-enabled devices. Pilot-operated designs post the quickest uptake at 7.8% CAGR given their higher capacity and tighter emissions control, whereas spring-loaded variants continue to supply the broad installed base. Regionally, Asia-Pacific leads on the back of heavy chemical, pharmaceutical, and hydrogen investments, while Middle Eastern projects generate the briskest growth as aging assets undergo full valve replacement cycles.
Key Report Takeaways
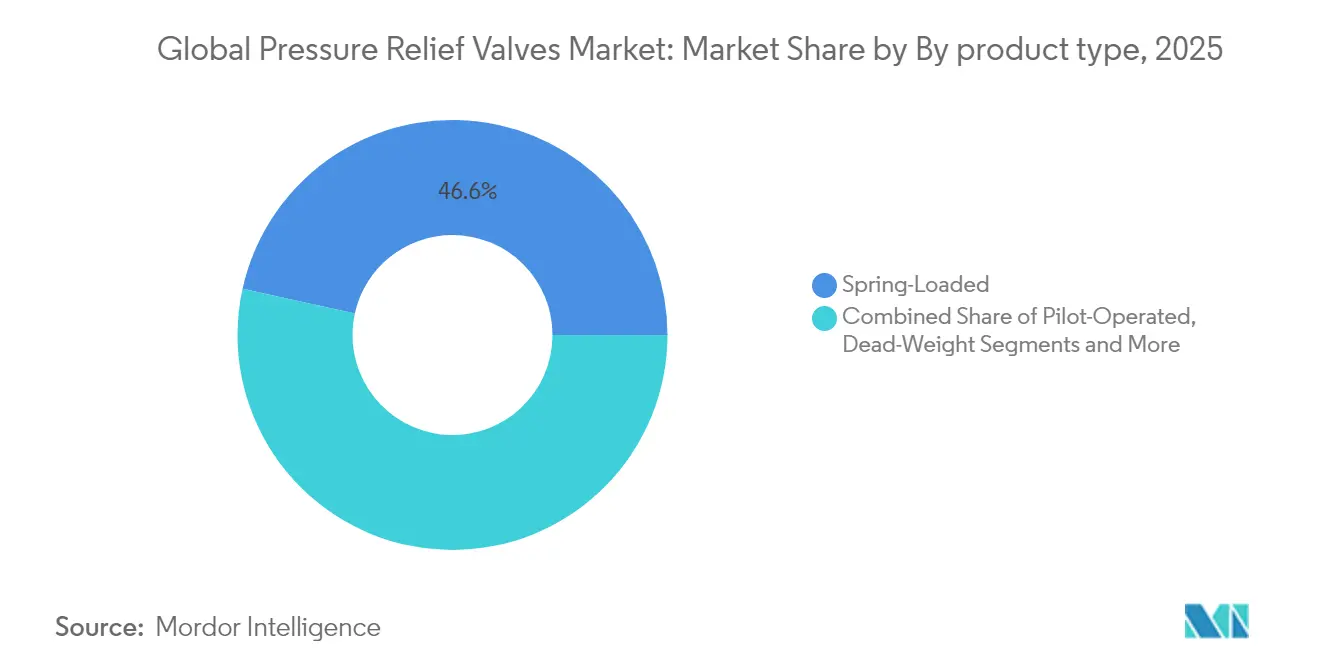
- By product type, spring-loaded units held 46.55% of pressure relief valves market share in 2025; pilot-operated devices are rising at a 7.44% CAGR toward 2031.
- By valve size, the medium (2"-6") category delivered 41.02% revenue share in 2025; large-bore formats above 6" are forecast to expand at an 7.74% CAGR.
- By set pressure, medium-pressure models (150-600 psi) accounted for 41.07% of the pressure relief valves market size in 2025, while high-pressure units above 600 psi show an 7.68% CAGR.
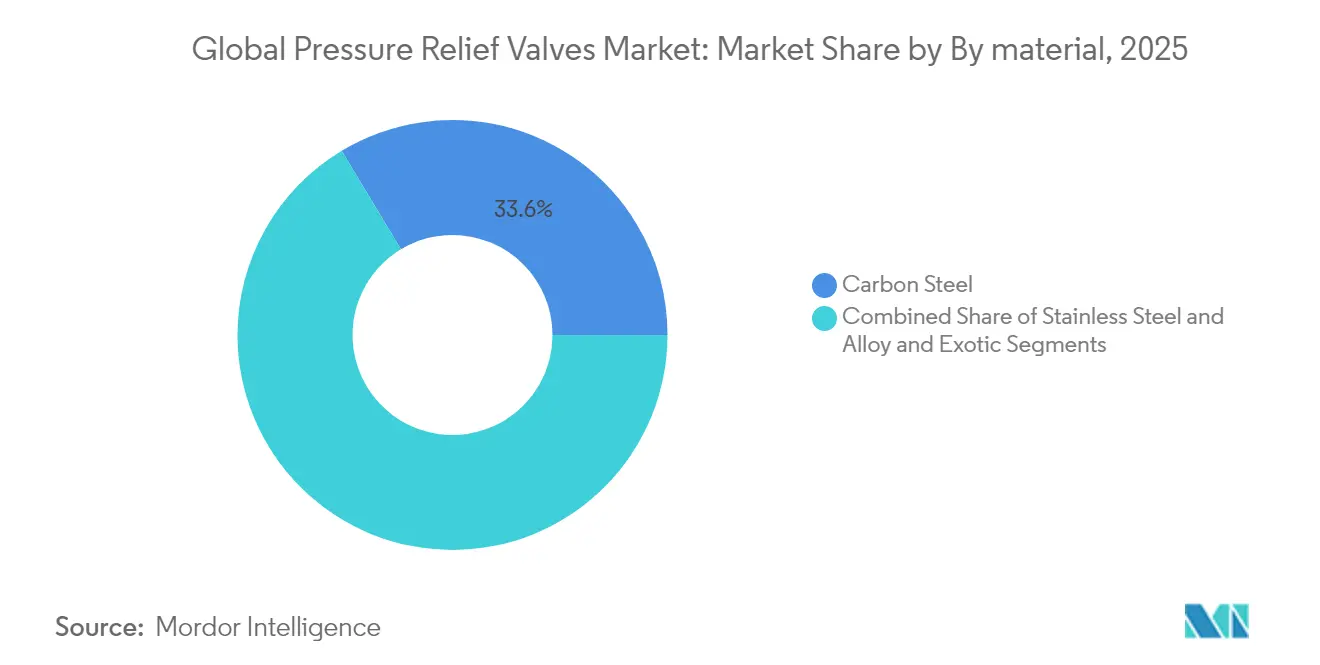
- By material, stainless-steel grades dominate corrosive and high-purity duties with the widest installed base.
- By end user, oil and gas contributed 32.21% revenue in 2025; pharmaceutical and biotech demand is advancing at an 8.35% CAGR.
Note: Market size and forecast figures in this report are generated using Mordor Intelligence’s proprietary estimation framework, updated with the latest available data and insights as of 2026.
Market Trends and Insights
Drivers Impact Analysis of Global Pressure Relief Valves Market*
| DRIVER | (~) % IMPACT ON CAGR FORECAST | GEOGRAPHIC RELEVANCE | IMPACT TIMELINE |
|---|---|---|---|
| Rapid LNG & Hydrogen Infrastructure Expansion Demanding High-Integrity Over-Pressure Protection | +1.8% | Global, with early gains in Asia-Pacific, North America, Middle East | Medium term (2-4 years) |
| Mandatory API 526/ASME Compliance in North America & EU Process Industries | +1.2% | North America & EU core, spill-over to emerging markets | Long term (≥ 4 years) |
| Brownfield Revamps of Ageing Refining Assets Across Middle East Elevating Valve Replacement Cycles | +0.9% | Middle East core, selective applications in Latin America | Short term (≤ 2 years) |
| Growth of Smart Manufacturing Driving Demand for Digital-Enabled Safety Valves (HART, IIoT) | +0.7% | Global, with concentration in developed markets | Medium term (2-4 years) |
| Accelerating Pharmaceutical Capacity Adds in India & China Requiring Sanitary PRVs | +0.6% | Asia-Pacific core, particularly India and China | Short term (≤ 2 years) |
| Nuclear Power Plant Modernization and Safety Upgrades Requiring Advanced Pressure Relief Systems | +0.5% | Global, with focus on North America, Europe, Asia-Pacific | Long term (≥ 4 years) |
| Source: Mordor Intelligence | |||
Rapid LNG & Hydrogen Infrastructure Expansion Demanding High-Integrity Over-Pressure Protection
Massive investment in LNG import terminals and green hydrogen projects is lifting demand for pressure relief devices engineered for cryogenic temperatures to –162 °C and for hydrogen service pressures up to 700 bar. UN Global Technical Regulation 13 obliges thermal pressure relief devices able to survive external fire while preventing tank rupture, pushing suppliers to adopt fire-resistant alloys and fast-acting discharge geometries. European Industrial Gases Association guidance also stresses accurate vent sizing and structural resilience for outdoor hydrogen stacks. Equipment such as Emerson’s TESCOM HV-7000 regulator targets contamination-free operation to extend service life in 700-bar vehicle storage. As a result, the pressure relief valves market gains clear volume and value upside from these emerging energy chains.[1]United Nations, “Global Technical Regulation 13,” unece.org
Mandatory API 526/ASME Compliance in North America & EU Process Industries
The 2025 ASME BPVC removes the two-class vessel system and revises Appendix 47, raising design scrutiny for pressure equipment and reinforcing demand for code-certified valves. API 526 standardizes orifice sizes and center-to-face dimensions, easing retrofit but tightening acceptance criteria. Studies show that up to 85% of valve performance issues link to deviations from prescribed sizing, installation, or maintenance, placing new emphasis on OEM-led training and support. Pressure Equipment Directive 2014/68/EU requires each device above 0.5 bar to pass conformity assessment by notified bodies, leading to longer lead times yet driving preference for suppliers with in-house compliance teams.
Brownfield Revamps of Aging Refining Assets Across Middle East Elevating Valve Replacement Cycles
Many Middle Eastern refineries built during earlier expansion phases now face higher sulfur crudes and tighter emission norms, forcing large-scale safety system upgrades. Kuwait Oil Company’s program covering 14 gathering centers illustrates the complexity of inserting new units without interrupting output, thus favoring modular, quick-install pressure relief packages. Saudi projects awarded to Darvico for Masoneilan Series 84K valves highlight increased demand for high-temperature steam duties. Rotork actuator retrofits at Tupras Izmit used more than 900 intelligent units, confirming the wider adoption of smart control even in replacement work.
Growth of Smart Manufacturing Driving Demand for Digital-Enabled Safety Valves (HART, IIoT)
Industry 4.0 projects integrate pressure relief valves into digital twins that track stroke counts, seat leakage, and spring fatigue in real time. Wireless transmitters such as OleumTech HGPT offer ±0.075% accuracy over 5–6,000 psi, enabling condition-based maintenance strategies that reduce unplanned downtime. Emerson’s Rosemount 3051 deployment base of more than 10 million illustrates rising confidence in digitally connected measurement. As data transparency aligns with corporate ESG and safety targets, digital compatibility becomes a decisive specification factor in the pressure relief valves market.
Restraints Impact Analysis of Global Pressure Relief Valves Market*
| RESTRAINTS | (~) % IMPACT ON CAGR FORECAST | GEOGRAPHIC RELEVANCE | IMPACT TIMELINE |
|---|---|---|---|
| Margin Squeeze from Proliferation of Low-Cost Asian Valve OEMs | -0.8% | Global, with concentration in price-sensitive markets | Medium term (2-4 years) |
| Substitution by Rupture Discs in Single-Use Bioprocessing Skids | -0.6% | Global, particularly in pharmaceutical and biotech sectors | Short term (≤ 2 years) |
| Volatile Nickel & Stainless-Steel Prices Disrupting Cost Structures | -0.5% | Global manufacturing, with regional variations | Short term (≤ 2 years) |
| Extended Certification Lead-Times (PED, CRN) Delaying Project Awards | -0.4% | Europe and North America primarily | Medium term (2-4 years) |
| Source: Mordor Intelligence | |||
Margin Squeeze from Proliferation of Low-Cost Asian Valve OEMs
Asian suppliers now produce API- and ASME-compliant pressure relief valves at lower cost, compressing margins for incumbents. To stay competitive, Western brands emphasize advanced materials, predictive diagnostics, and full life-cycle support that low-price entrants struggle to match. Price pressure is most acute in commodity low-pressure applications, whereas nuclear, aerospace, and severe-service hydrogen duties still reward premium engineering.
Substitution by Rupture Discs in Single-Use Bioprocessing Skids
Single-use bioreactors rise in popularity because disposable liners cut cleaning validation time. Rupture discs provide sterile one-time protection and avoid moving parts, reducing contamination risk. Nonetheless, discs require replacement after activation and cannot reseat, creating higher consumable costs compared with pressure relief valves that reseal, limiting substitution to batch operations.
*Our forecasts treat driver/restraint impacts as directional, not additive. The impact forecasts reflect baseline growth, mix effects, and variable interactions.
Global Pressure Relief Valves Market Segment Analysis
By Product Type:
Reliability of Spring-Loaded Designs Meets Rise of Pilot-Operated TechnologySpring-loaded valves retained the largest position with 46.55% share in 2025, reflecting decades of installed equipment across pressure bands from 4 psig to 6,250 psig and temperatures down to −450 °F. Cost-effective construction, simple maintenance, and high availability keep demand stable across refineries, chemical plants, and power boilers. Pilot-operated units are forecast to grow 7.44% CAGR as operators prioritize tighter leakage control and larger capacity within compact footprints. Feature sets such as remote sense lines and modulating disc action align with digital pressures for lower methane emissions and improved process efficiency, reinforcing their uptake in the pressure relief valves market.
Baker Hughes’ Consolidated Type 2900 platform exemplifies hybrid flexibility, permitting field conversion between modes to suit changing process conditions. Niche devices-dead-weight, buckling pin, and balanced bellows-address custody transfer, tamper-proof calibration, or back-pressure mitigation, yet their aggregate volume remains modest. Suppliers therefore steer R&D toward pilot-operated enhancements and smart actuator integration where incremental performance justifies premium pricing.



By Valve Size:
Large-Bore Valves Capture Infrastructure UpsizingMedium size (2"-6") valves contributed 41.02% revenue in 2025, covering mainstream flow demands in oil, chemical, and power plants. However, the large-bore segment above 6" is projected to rise at 7.74% CAGR to 2031 as LNG terminals, gas pipelines, and mega-scale hydrogen hubs command greater discharge areas for credible relief. Emerson’s Fisher EZR series spans bodies up to NPS 8 with 1,050 psig inlet rating, marrying high capacity with fine pressure control.
Engineering challenges scale rapidly with diameter: weight, nozzle reaction forces, and noise require special attention, and only vendors with extensive foundry and test capacity can compete. Small valves under 2" persist in laboratory, instrumentation, and pharmaceutical skids where space, cleanliness, and accurate low-flow performance overrule volume throughput.
By Set Pressure:
Intensifying Processes Propel High-Pressure GrowthMedium-pressure devices between 150 and 600 psi held 41.07% of pressure relief valves market share in 2025. They remain the workhorse of conventional refining and steam service. High-pressure versions above 600 psi exhibit an 7.68% CAGR owing to hydrogen compression, supercritical CO₂, and advanced ethylene crackers requiring over-pressure protection up to 1,000 bar.
Materials such as Inconel and Hastelloy ensure mechanical strength and resistance to hydrogen embrittlement, though they elevate price. Low-pressure offerings under 150 psi find steady demand in water treatment, HVAC, and food processing. Suppliers optimize disc profiles and spring characteristics to reach fast reseat at narrow blowdown margins, essential for reduced product discharge loss in costly media.
By Material:
Stainless Steel Retains Primacy Amid Specialty Alloy UptakeAustenitic stainless-steel grades SS304/SS316 dominate applications where corrosion resistance, hygiene, and ease of cleaning matter, covering a broad cross-section of chemical, food, and pharma lines. Carbon steel stays relevant for non-corrosive duties because of its lower cost, though new environmental norms drive conversion to coated or clad bodies in many refineries. Exotic alloys such as Monel or duplex stainless support sour-gas, high-chloride, or hydrogen duties, with growth following deeper CO₂ sequestration and green ammonia projects.
Material choice now influences total cost of ownership more than initial capex. Operators weigh downtime, inspection intervals, and cleaning frequency when selecting higher-grade metals, favoring suppliers who offer documented lifecycle data.
By End-User:
Pharmaceutical and Biotech Offer Highest CAGROil and gas maintained leadership at 32.21% revenue in 2025 because of sheer asset base from upstream wells to downstream refineries. Chemical and petrochemical complexes follow closely, while power generation spans traditional steam plants and emerging nuclear small modular reactors. Pharmaceutical lines register the fastest 8.35% CAGR as multi-product biologics facilities proliferate in Asia-Pacific, each needing traceable, clean-in-place relief devices.
Food, beverage, and water utilities round out demand for sanitary and low-pressure offerings. Pulp and paper mills continue to retrofit for tighter fugitive-emission limits, adding incremental replacement orders and sustaining aftermarket revenue for OEMs within the pressure relief valves market.
Geography Analysis
APAC Pressure Relief Valves Market
Asia-Pacific generated 34.18% of global revenue in 2025 and remains the cornerstone of volume growth. Chinese and Indian investments in hydrogen, LNG import, and bulk pharmaceutical production give local assemblers scale while drawing in Western OEM technology under license. Japan and South Korea add demand from advanced chemical and nuclear sectors that require high purity and seismic-qualified safety valves. Local certification schemes converge with API and ASME, easing export of Asia-fabricated devices and expanding the regional pressure relief valves market.
EMEA, North America and LATAM Pressure Relief Valves Market
The Middle East exhibits the quickest 7.22% CAGR through 2031 as brownfield refinery overhauls underpin large, lump-sum valve replacement programs. Saudi-led mega-refining projects and the UAE’s diversification into petrochemicals widen the call for high-capacity, high-temperature safety devices. Regional governments also back green hydrogen export hubs, further expanding high-pressure valve demand. North America maintains steady expansion based on stringent OSHA and EPA compliance, plus shale gas midstream infrastructure upgrades. Europe emphasizes PED conformity and decarbonization, encouraging adoption of valves compatible with hydrogen and carbon-capture media. Latin America delivers episodic project awards in refining and mining, while Africa offers early-stage opportunities tied to LNG export terminals. Across all geographies, digital monitoring and predictive maintenance features increasingly factor into procurement decisions, reinforcing technology differentiation in the pressure relief valves market.

Regulatory Landscape
Pressure relief valve design, sizing, and testing are governed by a layered standards stack that shapes specification discipline across process industries. Core anchors include ASME Boiler and Pressure Vessel Code (BPVC) requirements for overpressure protection, alongside API standards such as API 520/521 for sizing and installation practices, API 526 for standardized orifice and face-to-face dimensions, and API 527 for seat tightness. In Europe, Pressure Equipment Directive 2014/68/EU (PED) conformity assessment for equipment above 0.5 bar pushes buyers toward suppliers with established notified-body pathways and documentation depth.
International alignment continues through the ISO 4126 family, which covers safety devices including pilot-operated configurations, while sector-specific procurement requirements add another layer in oil and gas. The International Association of Oil and Gas Producers (IOGP) update to S-730 in February 2026 is a concrete example of how operator-led technical specifications translate codes into purchase-ready requirements for flanged steel pressure relief valves, reinforcing traceability, quality plans, and inspection/testing expectations across global projects.
Value Chain Analysis
The value chain spans alloy and stainless inputs, including corrosion- and embrittlement-resistant grades used for hydrogen and sour-gas duties, followed by precision machining and casting. Code testing and certification, then project and aftermarket channels, sit between manufacturing and delivery, which makes test capacity, documentation control, and compliance engineering central differentiators alongside physical production.
Downstream, EPCs and plant owners increasingly procure the valve alongside installation support, service qualification, and digital maintenance readiness. OEM service networks and certified repair centers sustain installed-base revenue through recertification and overhaul cycles, while retrofittable monitoring and IIoT add-ons support condition-based maintenance programs that are being built into brownfield modernization work. As severe-service use cases expand, the chain shifts toward higher-spec materials, larger-bore test infrastructure, and tighter integration with instrumentation and plant reliability workflows, including deployments where mechanical relief is complemented by instrumented protection layers such as HIPPS.
Competitive Landscape
Global supply is moderately concentrated around diversified flow-control groups that combine broad product lines with worldwide service. Emerson leads through Crosby and Anderson Greenwood brands, offering conventional to pilot-operated valves alongside wireless acoustic monitors that detect simmer before lift. Baker Hughes leverages Consolidated valves plus a Green Tag Center network for certified repairs, turning aftermarket into a recurring revenue engine.
Flowserve expanded severe-service portfolio by acquiring MOGAS for USD 290 million, reflecting a strategy to dominate niche, high-pressure, slurry, and mining segments. Crane Company agreed to buy Precision Sensors & Instrumentation for USD 1.06 billion to marry measurement and relief technologies, signifying convergence between sensing and safety functions.
Low-cost Chinese and Indian manufacturers challenge incumbents in commodity spring-loaded offerings, yet high regulatory barriers in nuclear, hydrogen, and pharmaceutical applications preserve price premiums for established brands. The capital intensity of casting, machining, and high-pressure test rigs limits new entrants. Suppliers thus differentiate through digital diagnostics, rapid PED/CRN certification support, and field-service footprints that de-risk operator downtime, sustaining competitive equilibrium within the pressure relief valves market.
Global Pressure Relief Valves Industry Leaders
Emerson Electric Co.
Baker Hughes Company
Curtiss-Wright Corp.
LESER GmbH & Co. KG
Flowserve Corporation
- *Disclaimer: Major Players sorted in no particular order
Global Pressure Relief Valves Market Companies Covered in this Report
- Emerson Electric Co.
- Baker Hughes Company
- Curtiss-Wright Corp.
- LESER GmbH and Co. KG
- IMI plc
- Flowserve Corporation
- General Electric (Baker Hughes collaboration)
- Alfa Laval AB
- Watts Water Technologies, Inc.
- Weir Group Plc
- Pentair plc
- Spirax-Sarco Engineering plc
- Robertshaw Industrial Products
- Goetze KG Armaturen
- AGF Manufacturing, Inc.
- ValvTechnologies Inc.
- Mercer Valve Co.
- Mack Valves Pty Ltd
- Mercer Industries (PressureGuard)
- Audco India Ltd (LandT Valves)
- Jiangsu Shuangda Pump and Valve Group

Market Opportunities and Future Outlook
Hydrogen, LNG, and other high-integrity gas duties create room for valves engineered for very high pressures, tight sealing, and material compatibility under embrittlement and contamination risks. A practical proof point is Emerson's launch of the Anderson Greenwood Type 84 pressure relief valve for hydrogen and high-pressure gas applications, which targets demanding set-pressure and seat-sealing requirements and points to how OEM portfolios are being tuned to energy-transition duty cycles.
Power and nuclear end markets also offer an opportunity corridor where qualification, documentation, and lifecycle service capabilities carry as much weight as the valve hardware. Flowserve's closing of the Trillium Flow Technologies Valves Division acquisition on June 30, 2026, provides evidence of capital being deployed to deepen nuclear and broader power valve coverage, which in turn increases requirements for certified service, spare parts availability, and longer-duration support agreements. In parallel, digital monitoring and retrofit-friendly diagnostics are becoming a procurement lever in brownfield plants, favoring OEMs that bundle relief devices with sensing, valve-health monitoring, and field-service programs rather than competing only on commodity spring-loaded replacements.
Recent Industry Developments in Global Pressure Relief Valves Market
- March 2026: Emerson Electric Co. announced the launch of the Anderson Greenwood Type 84 pressure relief valve designed for hydrogen and high-pressure gas applications. The rollout extends Emerson's high-pressure hydrogen valve portfolio to address energy-transition safety needs and strengthens its position in critical gas handling markets.
- March 2026: Emerson Electric Co. announced the launch of the Anderson Greenwood Type 84 pressure relief valve designed for hydrogen and high-pressure gas applications. The introduction broadens the company's product capabilities for hydrogen service and high pressure environments, signaling a strategic emphasis on safety-critical valve solutions.
- June 2025: Baker Hughes Company formed a joint venture with a subsidiary of Cactus, Inc. by contributing its surface pressure control product line. The partnership provides an integrated surface pressure control offering and supports aftermarket scale growth within the broader flow control ecosystem.


Global Pressure Relief Valves Market Report Scope and Research Methodology
Market Definition and Coverage
This market covers revenue generated from pressure relief valves used to protect pressurized equipment and piping by automatically releasing pressure at a set point, across industrial and utility installations worldwide.
Scope exclusions: We exclude rupture disks, flame arresters, pressure regulators, and integrated pressure control packages where the relief valve is not priced as a distinct item.
Segments Covered in This Report
- By Product Type
- Spring-Loaded
- Pilot-Operated
- Dead-Weight
- Buckling Pin
- Balanced Bellows
- By Valve Size (Inch)
- Up to 2 inch
- 2 inch - 6 inch
- Above 6 inch
- By Set Pressure
- Low (less than 150 psi)
- Medium (15 - 600 psi)
- High (greater than 600 psi)
- By Material
- Carbon Steel
- Stainless Steel
- Alloy and Exotic
- By End-User
- Oil and Gas (Upstream, Midstream, Downstream)
- Chemical and Petrochemical
- Power Generation (Thermal, Nuclear, Renewables-Hydrogen)
- Pulp and Paper
- Food and Beverage
- Pharmaceuticals and Biotech
- Water and Waste-Water
- By Geography
- North America
- United States
- Canada
- Mexico
- Europe
- United Kingdom
- Germany
- France
- Italy
- Rest of Europe
- Asia-Pacific
- China
- Japan
- India
- South Korea
- Rest of Asia
- Middle East
- Israel
- Saudi Arabia
- United Arab Emirates
- Turkey
- Rest of Middle East
- Africa
- South Africa
- Egypt
- Rest of Africa
- South America
- Brazil
- Argentina
- Rest of South America
- North America
Data Sources, Market Sizing, and Validation
Desk Research
Desk research starts with mapping the demand base and the inspection and replacement drivers that typically shape specification for pressure relief valves. For valve sizing, set pressure practices, and testing cadence, we used public engineering and safety standards and references such as the ASME Boiler and Pressure Vessel Code and the ASME B31 series, API 520 and API 526, and ISO 4126.
We then connect demand signals to end markets using public datasets and credible reporting, including industrial production series from national statistics agencies, energy and refining indicators from the International Energy Agency and EIA, and trade flows from UN Comtrade as directional checks for valve categories. We reviewed company annual reports, investor decks, and reputable press coverage to confirm plant expansions, shutdowns, and product-mix shifts. A paid subscription for company financials and an import-export shipment-level database were used selectively to sanity check regional activity. These examples are illustrative only, and many other public documents and datasets were also reviewed for data collection, validation, and clarification.
Primary Interviews and Surveys
Fieldwork is used to pressure test model assumptions that desk sources do not fully explain, especially pricing spreads, channel mix, and replacement cycles by end user. We spoke with manufacturers, distributors, EPC-linked stakeholders, plant maintenance teams, and safety and compliance specialists across major consuming regions so gaps on capacity additions, lead times, and project timing could be closed. These discussions clarified what is counted as a PRV sale in practice, covering new build and MRO replacement, and then those definitions were used to triangulate final totals.
Distribution of primary research fieldwork respondents
| Company type | Respondent position | Region |
|---|---|---|
| Top tier: 32% | CXOs: 17% | APAC: 37% |
| Mid tier: 46% | Functional/Unit leaders: 40% | EMEA: 37% |
| Smaller Players: 22% | Managers: 43% | Americas: 26% |
Market-Sizing & Forecasting
Sizing is built using a top-down and bottom-up blend, where end-user demand pools are reconstructed from the installed base and project activity, and then cross-checked with selective supplier and channel roll ups. For example, refinery and chemical additions, power and utility capex, and large process plant construction signals are converted into expected PRV demand using typical valve intensity per asset type and observed replacement intervals.
Key inputs include plant capacity additions and turnarounds, code and inspection-driven replacement cycles, the adoption share of spring-loaded versus pilot-operated designs, average selling price bands by material and pressure class, and regional import dependence that affects realized pricing. Forecasts use scenario analysis, where the base case is anchored to expected industrial capex and energy transition project timing, then adjusted using primary feedback on lead times, pricing passthrough, and maintenance budgets. Where supplier roll ups are incomplete for smaller local makers, gaps are handled by applying region and end-user specific coverage factors derived from channel interviews and trade flow directionality checks.
Data Validation & Update Cycle
Model outputs are triangulated against independent signals such as trade trends for valve categories, published industrial output and energy investment indicators, and the implied spending per operating unit in major end-user industries. Outliers are flagged, reviewed, and corrected through a second analyst pass, and follow-up calls are triggered when pricing, growth rates, or regional splits fall outside what interviews and public indicators can support.
The report is refreshed annually, with interim updates when material events occur. These include major project cancellations, regulatory changes that shift inspection cadence, or sharp commodity-driven price moves in key alloys. Before delivery, an analyst completes a fresh data pass so clients receive the latest updated view aligned to the most recent available information.
Mordor Intelligence's Pressure Relief Valves Market Sizing Compared With Other Published Estimates
Published market values for pressure relief valves often do not match because authors use different product boundaries, different base years, and different approaches to replacement demand in heavy process industries. Currency timing and how regional price differences are handled can also move the total by a noticeable amount.
Some estimates bundle closely related pressure protection devices or treat packaged pressure control systems as part of the same spend. For Mordor Intelligence, the value is counted only when a distinct pressure relief valve is sold, and items like rupture disks and pressure regulators sit outside scope, which changes the total even if the same end markets are discussed.
Benchmark comparison
| Source | Market Size | Gaps in Research Methodology |
|---|---|---|
| Mordor Intelligence | USD 5.36 B (2026) | |
| Trade Journal A | USD 4.70 B (2024) | Uses an earlier base year and a slower replacement-cycle assumption for process plants, and it tends to apply a flatter global ASP progression across materials and pressure classes. |
| Industry Publisher B | USD 4.10 B (2022) | Anchors the series to older-year snapshots and may treat parts of aftermarket demand through services rather than valve revenue, which can understate replacement-heavy regions. |
The spread across the table is mainly explained by timing and what gets counted as valve revenue versus adjacent items or service spend. By keeping scope tied to discrete PRV unit sales and then checking price and replacement inputs through interviews and public activity signals, our output stays traceable to clear drivers and repeatable steps.


Key Questions Answered in the Report
What is driving the current expansion of the pressure relief valves market?
Mandatory API and ASME compliance, LNG and hydrogen infrastructure, and smart manufacturing initiatives collectively lift global demand.
Which product type is growing fastest?
Pilot-operated pressure relief valves record a 7.44% CAGR to 2031 as users target higher capacity and lower fugitive emissions.
Why is Asia-Pacific the largest regional market?
China and India invest heavily in refining, chemicals, and pharmaceuticals, requiring large volumes of code-compliant relief devices.
How do digital technologies influence valve purchasing?
HART- and IIoT-enabled valves provide real-time diagnostics and predictive maintenance, lowering downtime and aligning with Industry 4.0 goals.
What challenges threaten market growth?
Price competition from low-cost Asian OEMs, raw-material volatility, and extended PED or CRN certification cycles can trim profit margins.
Which end-user sector shows the highest growth potential?
Pharma and biotech applications deliver an 8.35% CAGR due to sanitary requirements and rising biologics production capacity.
Page last updated on:


 Your data is secure and never sold or shared.


