Powered Surgical Instrument Market Size and Share
Market Overview
| Study Period | 2020 - 2031 |
|---|---|
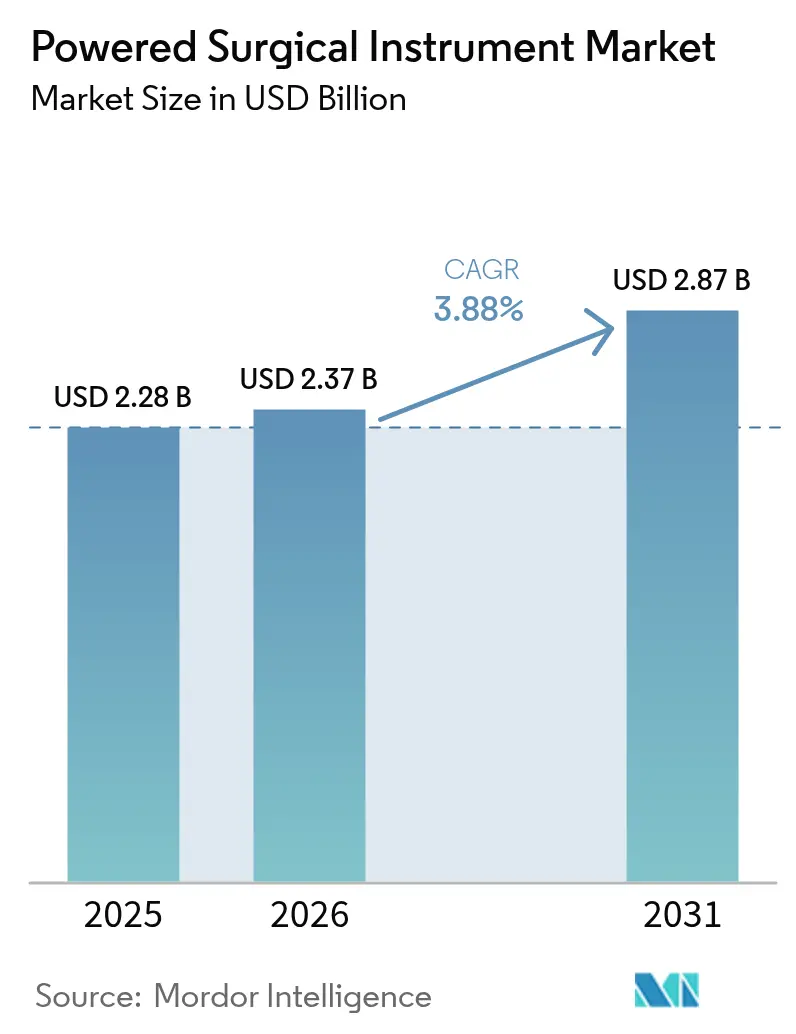
| Market Size (2026) | USD 2.37 Billion |
| Market Size (2031) | USD 2.87 Billion |
| Growth Rate (2026 - 2031) | 3.88% CAGR |
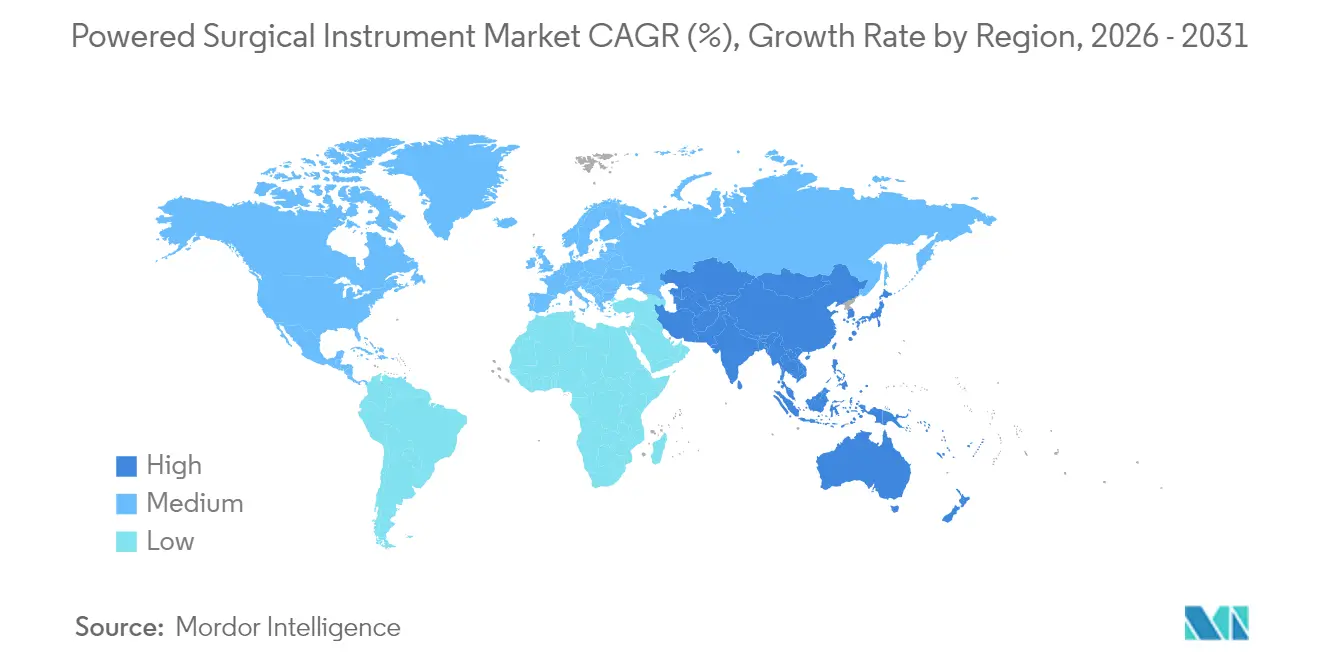
| Fastest Growing Market | Asia Pacific |
| Largest Market | North America |
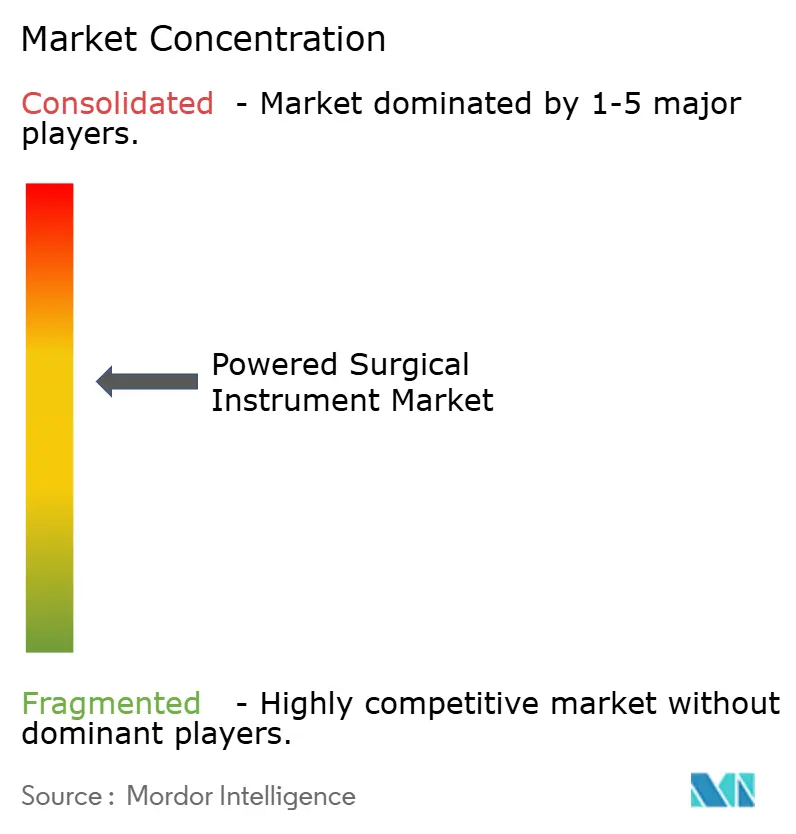
| Market Concentration | Medium |
Major Players *Disclaimer: Major Players sorted in no particular order Image © Mordor Intelligence. Reuse requires attribution under CC BY 4.0. | |
Powered Surgical Instrument Market Analysis by Mordor Intelligence
The powered surgical instruments market size is expected to grow from USD 2.28 billion in 2025 to USD 2.37 billion in 2026 and is forecast to reach USD 2.87 billion by 2031 at 3.88% CAGR over 2026-2031. Aging populations, higher surgical volumes, and incremental technological gains sustain growth after the early‐adoption phase. Demand is reinforced by minimally invasive technique preferences, while regulatory moves toward standardized sterilization favor incumbent suppliers. Hospitals also prioritize integrated instrument platforms to satisfy value-based care metrics, supporting premium pricing. Asia-Pacific’s infrastructure build-out and the rise of specialist day-surgery centers underpin a geographic shift that balances North America’s current revenue leadership within the powered surgical instruments market.
Key Report Takeaways
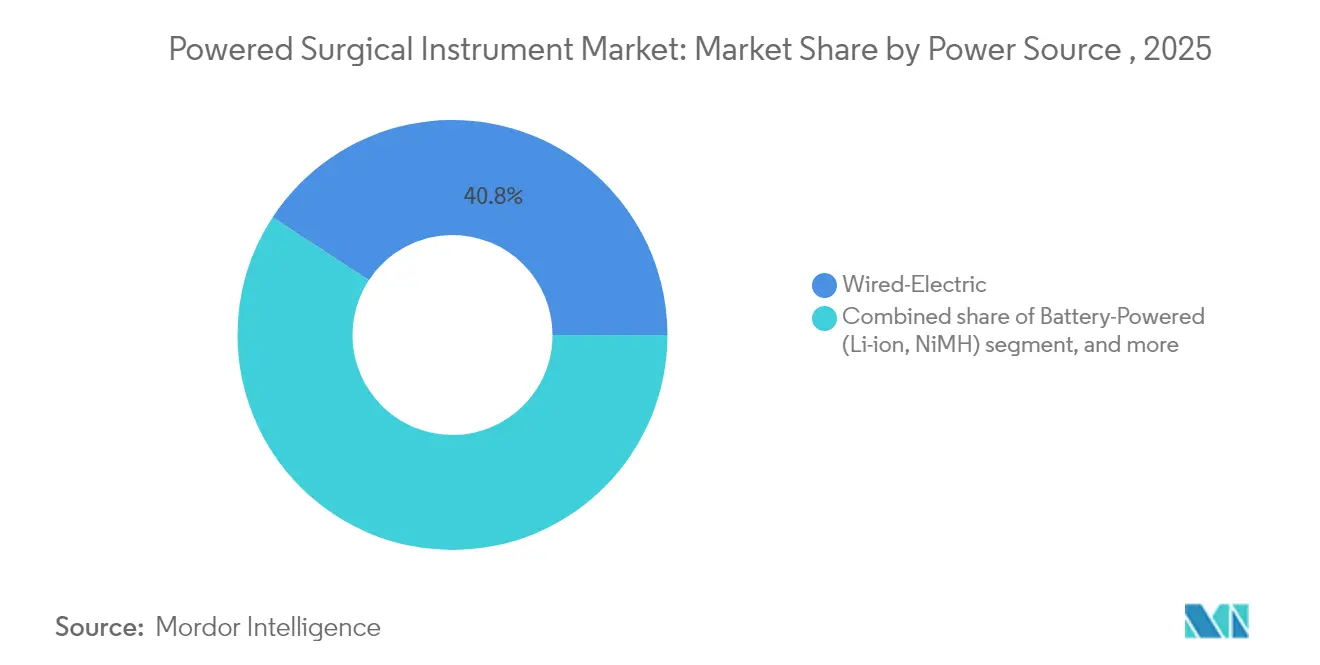
- By power source, wired-electric systems led with 40.78% of powered surgical instruments market share in 2025; battery-powered systems are projected to expand at a 4.72% CAGR through 2031.
- By product type, handpieces accounted for 59.86% share of the powered surgical instruments market size in 2025, while accessories and consumables show the fastest 4.95% CAGR to 2031.
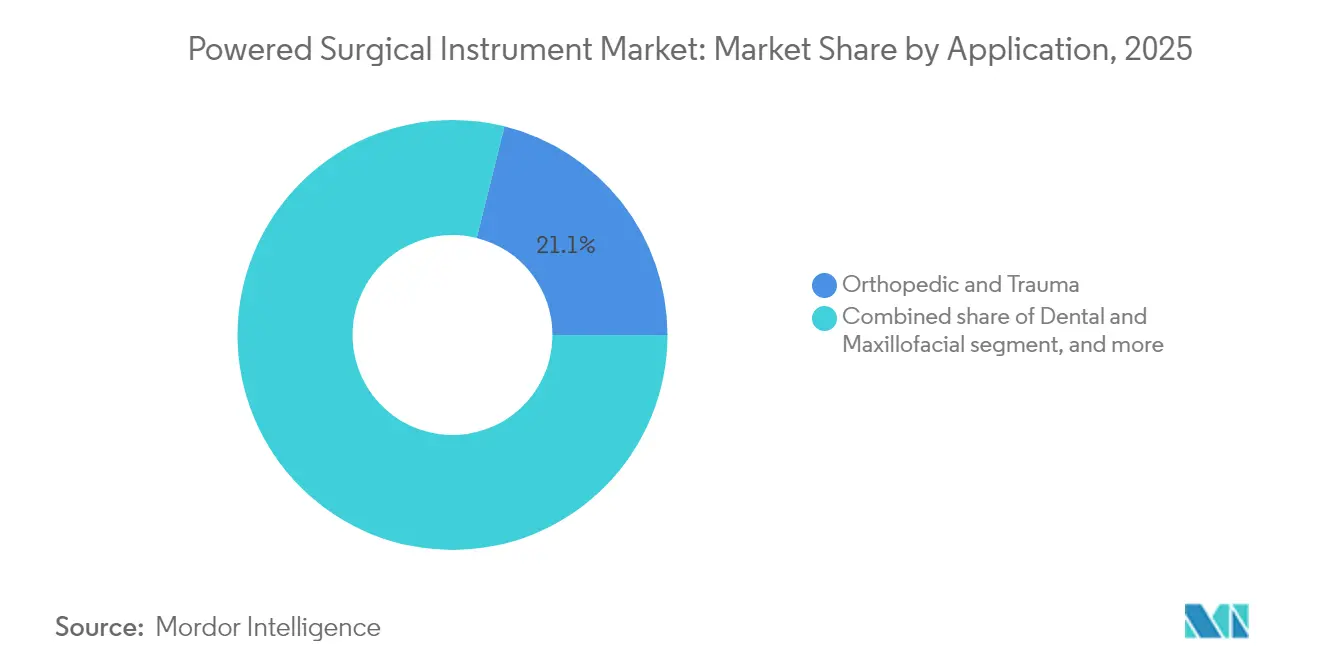
- By application, orthopedic and trauma procedures captured 21.12% share of the powered surgical instruments market size in 2025; plastic and reconstructive surgery is progressing at a 5.96% CAGR.
- By end-user, hospitals held 71.83% of powered surgical instruments market share in 2025, whereas ambulatory surgical centers are set to grow at a 5.63% CAGR.
- By geography, North America commanded 35.02% share of the powered surgical instruments market in 2025, yet Asia-Pacific records the fastest 5.21% CAGR to 2031.
Note: Market size and forecast figures in this report are generated using Mordor Intelligence’s proprietary estimation framework, updated with the latest available data and insights as of 2026.
Global Powered Surgical Instrument Market Trends and Insights
Driver Impact Analysis*
| Driver | % Impact on CAGR Forecast | Geographic Relevance | Impact Timeline |
|---|---|---|---|
| Rising volume of surgical procedures and trauma cases | +1.2% | Global, highest in APAC and MEA | Medium term (2-4 years) |
| Growing geriatric population with degenerative disorders | +0.8% | North America & Europe, expanding to APAC | Long term (≥ 4 years) |
| Continuous technological advancements in powered tools | +0.7% | Global, led by North America & Europe | Short term (≤ 2 years) |
| Increasing adoption of minimally invasive and outpatient surgeries | +0.6% | Global, early uptake in developed markets | Medium term (2-4 years) |
| Expansion of specialist day-surgery centers in emerging markets | +0.5% | APAC core, spill-over to MEA & South America | Long term (≥ 4 years) |
| Transition to value-based care driving OR efficiency investments | +0.4% | North America & EU, expanding globally | Medium term (2-4 years) |
| Source: Mordor Intelligence | |||
Rising Volume of Surgical Procedures and Trauma Cases
Global operating-room activity is rising as insurance coverage broadens in emerging economies and urbanization elevates trauma incidence. Emergency departments rely on power-driven drills and saws to stabilize fractures faster than manual tools, improving outcomes and freeing critical-care beds[1]American College of Surgeons, “Robotic Cholecystectomy Cost Analysis,” facs.org. High-volume centers in Asia-Pacific now integrate hybrid consoles that combine battery and wired modes, shortening turnover time between trauma cases. Traffic accidents and industrial injuries create predictable demand, anchoring the powered surgical instruments market in fast-growing metropolitan regions. Hospitals that treat complex polytrauma increasingly purchase modular handpiece systems to streamline inventory and ensure quick sterilization cycles. Surgeons report shorter operative times, reinforcing administrative support for continued investment in power platforms.
Growing Geriatric Population with Degenerative Disorders
People aged 65 + are the fastest-growing cohort in developed economies, pushing joint-replacement and spinal-fusion volumes upward. These interventions depend on high-torque drills and reamers, securing a long-term revenue base for the powered surgical instruments market. United States reimbursement bundles for hip and knee arthroplasty pressure hospitals to complete procedures efficiently, favoring lightweight battery handpieces that mitigate surgeon fatigue. European day-surgery units now perform same-day hip revisions, leveraging cordless systems to simplify OR setup. Japanese clinics deploy portable consoles to serve rural geriatric patients via mobile surgical teams, widening access. This demographic-linked demand is structural, ensuring a durable sales pipeline for suppliers through 2030 and beyond.
Continuous Technological Advancements in Powered Surgical Tools
Lithium-ion packs now deliver four to six hours of runtime and shed nearly 20% weight versus prior models, improving ergonomics without sacrificing torque. Smart consoles record usage metrics and forecast maintenance needs, enabling predictive service schedules that minimize downtime and extend asset life. Software updates install wirelessly once instruments dock, although hospitals impose cybersecurity protocols to safeguard patient data[2]IEEE, “Future of Surgical Robotics,” ieee.org. Firmware-locked torque settings also aid credentialing by aligning parameters to surgeon preferences. Technology gains allow manufacturers to maintain premium prices, expanding gross margins within the powered surgical instruments market despite procurement scrutiny.
Increasing Adoption of Minimally Invasive and Outpatient Surgeries
Arthroscopic, laparoscopic, and endoscopic approaches shorten recovery and align with payer incentives for shorter stays. Ambulatory surgery centers post mid-single-digit growth as patients choose facilities with shorter check-in to discharge times. Cordless shavers and reciprocating saws designed for 90-minute arthroscopy eliminate tripping hazards in compact ORs. The WALANT technique has popularized office-based hand surgery with power micro-drills that work under local anesthesia, further decentralizing surgical care. Insurers reimburse a growing list of procedures in outpatient settings, feeding demand for portable batteries and sterilizable casings. As a result, suppliers deepen small-footprint console portfolios, reinforcing the powered surgical instruments market in non-hospital environments.
Restraints Impact Analysis*
| Restraints Impact Analysis | (~) % Impact on CAGR Forecast | Geographic Relevance | Impact Timeline |
|---|---|---|---|
| High capital and maintenance costs of powered instruments | –0.9% | Global, highest in emerging markets | Short term (≤ 2 years) |
| Shortage of skilled surgical workforce in low-income regions | –0.6% | APAC emerging markets, MEA, South America | Long term (≥ 4 years) |
| Stringent regulatory and environmental policies on sterilization and battery disposal | –0.5% | North America & Europe, extending to Japan and Australia | Medium term (2-4 years) |
| Data security concerns with network-connected surgical equipment | –0.3% | Global, with heightened focus in the United States and EU | Short term (≤ 2 years) |
| Source: Mordor Intelligence | |||
High Capital and Maintenance Costs of Powered Instruments
Initial purchase prices range from USD 50,000 to USD 200,000, while annual service contracts typically equal 10-15% of the original spend, challenging budgets of smaller facilities. Studies show robotic cholecystectomy disposables can exceed laparoscopic equivalents without superior outcomes, prompting administrators to question ROI on advanced consoles. Emerging-market clinics often delay upgrades, buying pre-owned wired systems to avoid battery replacement expense. Multiyear leasing models are spreading, yet interest-rate volatility raises financing costs and may temper acquisition plans in the near term. Consequently, capital intensity restrains penetration even as clinical teams voice strong preference for powered solutions.
Shortage of Skilled Surgical Workforce in Low-Income Regions
Many low-income countries operate with surgeon-to-population ratios far below WHO recommendations, limiting procedure volumes irrespective of equipment availability. Training on powered systems demands cadaver labs and virtual simulators that most medical schools lack. Rural hospitals face recruitment struggles as advanced instrumentation remains scarce, perpetuating urban-rural disparities. Where staffing gaps persist, distributors see limited sales potential, slowing powered surgical instruments market expansion. International NGOs provide modular toolkits for mission surgeries, yet these episodic interventions do not create sustained commercial demand.
*Our forecasts treat driver/restraint impacts as directional, not additive. The impact forecasts reflect baseline growth, mix effects, and variable interactions.
Segment Analysis
By Power Source: Battery Systems Drive Mobility Trends
Lithium-ion battery platforms have propelled the powered surgical instruments market, with battery systems tracking a 4.72% CAGR through 2031. In 2025 wired-electric devices still held 40.78% share, reflecting legacy installations at high-volume centers that value uninterrupted current. Assemblies featuring swappable battery pods cut turnover time in ambulatory suites and gain traction in orthopedic trauma rooms. Hybrid consoles seamlessly transfer from wall power to battery backup during intraoperative repositioning, ensuring sterility of cable-free drapes. Competition now centers on charge-cycle longevity and real-time battery diagnostics that feed into hospital asset software. Over the forecast period, portability advantages keep battery units at the forefront of new installations, especially across Asia-Pacific’s expanding day-surgery grid.
Surgeons cite reduced cord clutter and lighter handpieces as key ergonomic benefits during arthroplasty that may last beyond two hours. Pneumatic platforms retain niche demand in neurosurgery for their ultra-smooth torque delivery, but they lack the connectivity that hospitals expect from digital OR investments. Suppliers therefore integrate Bluetooth firmware updates into battery handles, pairing them with sterilizable charging docks. Price-sensitive hospitals in Latin America still favor wired rigs refurbished through trade-in programs that lower upfront expense. Balanced purchasing across power types keeps the powered surgical instruments market diversified while underscoring battery innovation as an enduring growth lever.


By Product Type: Consumables Revenue Streams Accelerate
Handpieces dominated 59.86% of revenues in 2025, making them the economic cornerstone of the powered surgical instruments market. Saw systems and high-speed drills lead orthopedic demand, while shavers carve share in ENT and sports medicine suites. Meanwhile, accessories and consumables are expanding at a 4.95% CAGR, with single-use burs, blades, and sleeves offering predictable per-case income to manufacturers. Hospitals accept higher variable costs because disposables eliminate re-sterilization labor and align with infection-control audits.
OEMs bundle service contracts with auto‐shipping of blades based on usage data from smart consoles, creating annuity-like revenue. Consumable expansion also smooths earnings against cyclical capital budgets, positioning suppliers to weather macroeconomic swings. Plastic-surgery clinics adopt micro-burring tips for rhinoplasty refinements, illustrating how procedure-specific consumables widen the customer base. Digital ordering portals tied to inventory sensors further lock in clients, reinforcing the powered surgical instruments market through sticky relationships.
By Application: Plastic Surgery Procedures Accelerate Recovery
Orthopedic and trauma procedures held 21.12% of 2025 revenues, benefiting from rising sports injuries and joint disease in aging societies. Yet plastic and reconstructive surgery is the fastest-moving segment at a 5.96% CAGR as patients resume elective treatments post-pandemic. Power micro-drills and dermal shavers speed cosmetic interventions, supporting outpatient workflows.
Dental and maxillofacial suites leverage slim handpieces to navigate restricted oral fields, while neurosurgery demands torque-controlled micro-saws coupled with navigation sensors. Robotic integrations emerge in cardiothoracic repairs, though uptake is paced by cost. Across all applications the powered surgical instruments market continues to pivot toward cross-specialty platforms that reduce the number of consoles necessary in multi-disciplinary theatres.
By End-User: Ambulatory Centers Capture Growth Premium
Hospitals maintained 71.83% share in 2025, backed by embedded procurement and sterilization capacity. However, ambulatory surgical centers are expanding at 5.63% CAGR thanks to payer incentives and patient convenience. Cordless consoles that fit into compact procedure rooms underpin this shift, while electronic records integration supports rapid scheduling.
Specialty orthopedic clinics deploy high-speed reamers that turn hip revisions into half-day cases, reducing bed needs and readmission risk. Dental surgeries invest in lightweight battery drills to streamline implant workflows. Government trauma units in India pilot battery call-kits that accompany helicopters, illustrating novel field applications. These varied use patterns broaden the powered surgical instruments market across the continuum of care.
Geography Analysis
North America led with 35.02% revenue share in 2025. Medicare bundles stimulate capital spending on instruments that cut theater time, while United States surgeons adopt smart consoles capable of predictive service diagnostics. Canada’s provincial buying groups favor multi-procedure kits to maximize return under universal budgets, and Mexico’s border hospitals tap the powered surgical instruments market to serve medical tourists.
Europe is the second-largest region. Germany, France, and Italy see orthopedic case growth tied to aging citizens, and hospitals adopt value-based contracts that reward shorter length of stay. The United Kingdom aligns purchasing guidelines to NHS cost-per-case thresholds, which puts procurement weight on lifespan analytics from console logs. EU Medical Device Regulation demands robust clinical data that established brands can supply, shielding them against price-led competition while reinforcing patient safety.
Asia-Pacific posts the strongest 5.21% CAGR. China’s county hospitals upgrade tool inventories as national insurance expands orthopedic coverage. India’s urban clusters open high-volume day clinics that prefer batterized kits. Japan’s super-aged society sustains steady hip and spine volumes, while South Korea’s cosmetic tourism imports European micro-drills to satisfy foreign patients. ASEAN harmonization has trimmed approval timelines, yet local-content rules spur partnerships between multinationals and regional OEMs. Combined, these dynamics outline a decisive growth vector for the powered surgical instruments market across emerging Asian economies.

Competitive Landscape
Market concentration is moderate, anchored by Stryker, Medtronic, and Johnson & Johnson’s DePuy Synthes, each wielding broad catalogs and dealer networks. These firms compete on battery runtime, ergonomic design, and console analytics. De Soutter Medical and MicroAire pursue niche cranio-maxillofacial segments, capturing clients with tailored service bundles. Asian entrants leverage cost advantage, but stringent sterilization norms temper rapid escalation.
Strategic pivots emphasize platform ecosystems. Johnson & Johnson MedTech collaborates with surgeons worldwide to harmonize outcome classifications, using its Polyphonic digital hub to integrate instrument data and inform performance dashboards. Stryker’s latest console alerts staff when saw blades reach end-of-life cycles, reducing breakage incidents. Partnerships between tool makers and software vendors embed cybersecurity protocols that fulfill hospital IT mandates.
M&A activity continues. Applied Industrial Technologies acquired IRIS Factory Automation in June 2025, adding robotics know-how that can refine assembly of power handpieces. Suppliers also sign manufacturing alliances in India to meet local-content rules, thus expediting tenders. Overall, competitive focus centers on reducing total-procedure cost while bolstering surgeon ergonomics, ensuring the powered surgical instruments market remains technologically vibrant yet commercially disciplined.
Powered Surgical Instrument Industry Leaders
Stryker Corporation
Medtronic plc
Johnson & Johnson (DePuy Synthes)
Zimmer Biomet
B. Braun (Aesculap)
- *Disclaimer: Major Players sorted in no particular order

Recent Industry Developments
- June 2025: Applied Industrial Technologies acquired IRIS Factory Automation, adding automation capacity to scale powered instrument production lines.
- April 2025: FDA cleared a novel gastrointestinal device developed under an American Gastroenterological Association scholarship, underscoring regulatory backing for surgical innovation.
- December 2024: Johnson & Johnson MedTech began a global program to standardize surgical site outcome classification using its Polyphonic digital ecosystem.
- June 2024: Cadaveric knee-arthroplasty evaluation published on PMC affirmed robotic systems paired with high-speed burrs enhance alignment precision.


Research Methodology Framework and Report Scope
Market Definitions and Key Coverage
Our study defines the powered surgical instruments market as the global sales of factory-built, electrically wired, battery, and pneumatic handpieces, drills, saws, reamers, shavers, staplers, and their matched power consoles, batteries, and single-use burs or blades used across orthopedic, cardiothoracic, neurosurgical, ENT, plastic, and general procedures. According to Mordor Intelligence, these devices are assessed at transaction value, free of service contracts and rental income.
Scope exclusion: manual hand tools, robotic surgery platforms, and standalone electrosurgical generators remain outside the current estimate.
Segmentation Overview
- By Power Source
- Wired-Electric
- Battery-Powered (Li-ion, NiMH)
- Pneumatic / Nitrogen
- Hybrid Smart Consoles
- By Product Type
- Handpieces
- Drill Systems
- Saw Systems
- Reamer Systems
- Staplers
- Shavers & Debriders
- Other Handpieces
- Power Sources & Controls
- Accessories & Consumables
- Handpieces
- By Application
- Orthopedic & Trauma
- Dental & Maxillofacial
- Neurosurgery & Spine
- Cardiothoracic & Cardiovascular
- Plastic & Reconstructive
- Other Applications
- By End-User
- Hospitals
- Ambulatory Surgical Centers
- Specialty Orthopedic & Dental Clinics
- Other End-Users
- Geography
- North America
- United States
- Canada
- Mexico
- Europe
- Germany
- United Kingdom
- France
- Italy
- Spain
- Rest of Europe
- Asia-Pacific
- China
- Japan
- India
- Australia
- South Korea
- Rest of Asia-Pacific
- Middle East & Africa
- GCC
- South Africa
- Rest of Middle East & Africa
- South America
- Brazil
- Argentina
- Rest of South America
- North America
Detailed Research Methodology and Data Validation
Primary Research
Mordor analysts conducted structured interviews with surgeons, sterile-processing managers, and product engineers in North America, Europe, and key Asia-Pacific hubs. These discussions verified typical handpiece replacement cycles, ASP erosion patterns, and battery adoption rates, and they helped us fine-tune geographic mix and gauge latent demand in ambulatory surgical centers.
Desk Research
We began by mapping demand drivers through open datasets such as OECD Health Statistics, UN Population Prospects, and WHO surgical procedure volumes, which give us procedure growth and aging demographics. Trade flows from UN Comtrade and import tariff filings help our team approximate cross-border unit movements, while regulatory filings on the FDA 510(k) and EU MDR databases clarify product classes and market entry timing. Investor filings and annual reports enrich average selling price (ASP) trends. Subscription resources like D&B Hoovers and Dow Jones Factiva supply hard numbers on company revenue splits and recent capacity additions. The sources shown are illustrative; many further publications, national registries, and hospital audits were reviewed to complete the evidence set.
Market-Sizing & Forecasting
We anchor the 2025 baseline with a top-down procedure pool build-up. Global orthopedic, neuro, ENT, and cardio cases are multiplied by tool usage intensity and refresh cycles, then converted to value through region-specific ASP curves. Select bottom-up checks, supplier revenue roll-ups and sampled channel audits, validate totals before minor calibration. Key variables in the model include hip and knee replacement volumes, trauma incidence, Li-ion battery penetration, elective surgery backlog clearance, and hospital capital-budget ratios. A multivariate regression forecasts each driver through 2030, while scenario analysis captures shifts in outpatient migration and pricing pressure. Missing data points are bridged using three-year moving averages aligned to primary research consensus.
Data Validation & Update Cycle
Outputs pass a two-layer analyst review that flags anomalies against independent indicators such as import trends and hospital spend indices. Material variances trigger respondent call-backs before sign-off. We refresh every twelve months, yet an interim update is released whenever recalls, major M&A, or reimbursement changes move the market.
Why Mordor's Powered Surgical Instrument Baseline Commands Reliability
Published figures frequently vary because firms mix electrosurgical consoles, single-use kits, or even robotics into the headline value.
Our disciplined scope selection, annual refresh, and dual-path modeling keep Mordor's estimate tightly focused and current.
Benchmark comparison
| Market Size | Anonymized source | Primary gap driver |
|---|---|---|
| USD 2.28 B (2025) | Mordor Intelligence | - |
| USD 2.61 B (2024) | Global Consultancy A | Includes electrosurgical generators and applies uniform ASP without regional weighting |
| USD 2.36 B (2024) | Industry Journal B | Uses historical exchange rates and excludes outpatient facility uptake |
| USD 2.60 B (2023) | Market Data Provider C | Combines powered tools with manual orthopedic sets and older procedure counts |
In sum, our transparent variable selection, frequent validation, and clear separations between powered and manual tools deliver a balanced, repeatable baseline that decision-makers can rely on with confidence.


Key Questions Answered in the Report
What is the current size of the powered surgical instruments market?
The powered surgical instruments market size stands at USD 2.37 billion in 2026 and is projected to reach USD 2.87 billion by 2031.
Which region is growing fastest in the powered surgical instruments market?
Asia-Pacific is expanding at a 5.21% CAGR through 2031, driven by healthcare infrastructure investment and rising day-surgery centers.
Why are battery-powered systems gaining popularity?
Battery platforms offer cord-free mobility, lighter handpieces, and up to six hours of runtime, meeting ergonomic and efficiency goals in ambulatory settings.
Which product category generates the highest recurring revenue?
Accessories and consumables grow fastest at a 4.95% CAGR because single-use blades and burs provide predictable per-procedure income for suppliers.
How do high capital costs affect adoption?
Prices of USD 50,000–200,000 plus annual service contracts deter smaller facilities, especially in emerging markets, slowing market penetration.
What impact will regulatory changes have on new entrants?
Streamlined FDA user-fee negotiations may shorten approval times for incremental updates, yet stringent clinical evidence under EU MDR maintains high entry barriers.
Page last updated on:


