
Polycystic Ovarian Syndrome Treatment Market Size and Share
Market Overview
| Study Period | 2020 - 2031 |
|---|---|
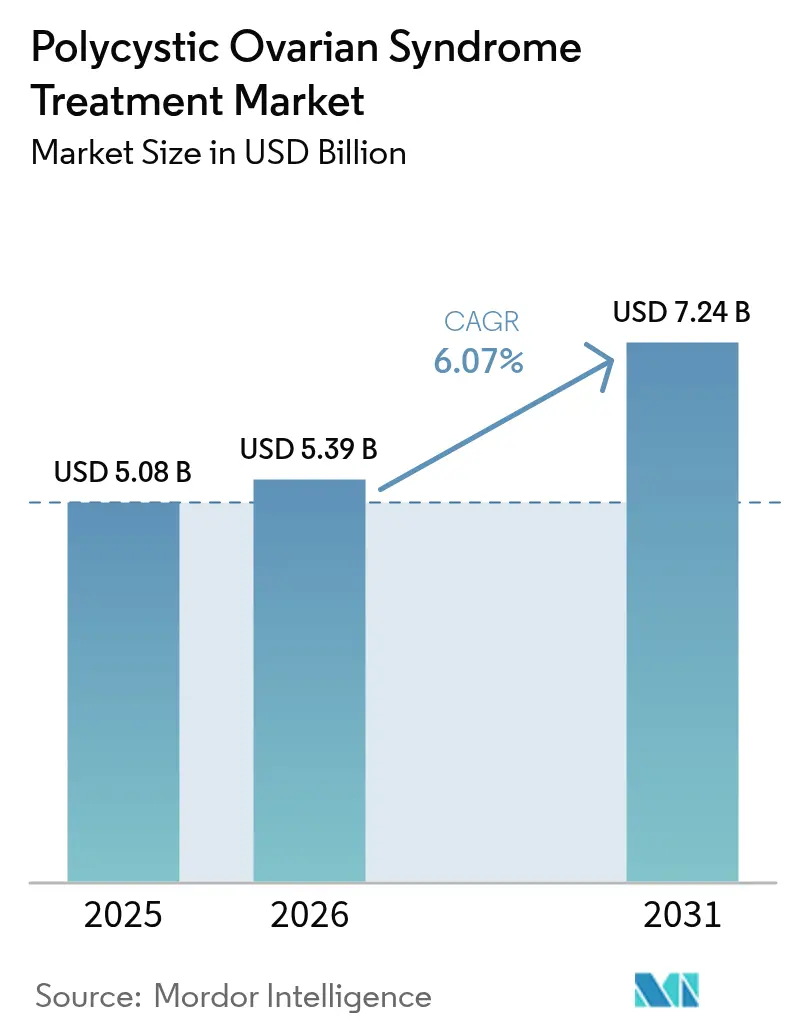
| Market Size (2026) | USD 5.39 Billion |
| Market Size (2031) | USD 7.24 Billion |
| Growth Rate (2026 - 2031) | 6.07 % |
| Fastest Growing Market | Asia Pacific |
| Largest Market | North America |
| Market Concentration | Low |
Major Players *Disclaimer: Major Players sorted in no particular order Image © Mordor Intelligence. Reuse requires attribution under CC BY 4.0. | |
Polycystic Ovarian Syndrome Treatment Market Analysis by Mordor Intelligence
The polycystic ovarian syndrome treatment market size was valued at USD 5.08 billion in 2025 and estimated to grow from USD 5.39 billion in 2026 to reach USD 7.24 billion by 2031, at a CAGR of 6.07% during the forecast period (2026-2031). Uptake of evidence-based therapies that address both endocrine and metabolic aberrations is accelerating, underpinned by wider screening, guideline‐driven care, and payor recognition of long-term cost savings. Clinicians are gradually shifting from symptom suppression toward comprehensive metabolic risk modification, with GLP-1 receptor agonists topping formularies after head-to-head trials showed greater weight, insulin, and androgen reductions than legacy metformin regimens[1]S. Zhang et al., “GLP-1 Receptor Agonists for PCOS: A Double-Blind, Randomized Trial,” Nature Co. Precision dosing, expanding digital follow-up, and stronger patient advocacy are widening access in middle-income settings, while hospital centers integrate multidisciplinary teams that bundle endocrinology, dermatology, and fertility services in one visit. On the supply side, partnerships between large pharma and agile biotechs shorten development timelines for tissue-specific modulators, while real-world registries supply regulators with the safety endpoints required to unlock formal labelling.
Key Report Takeaways
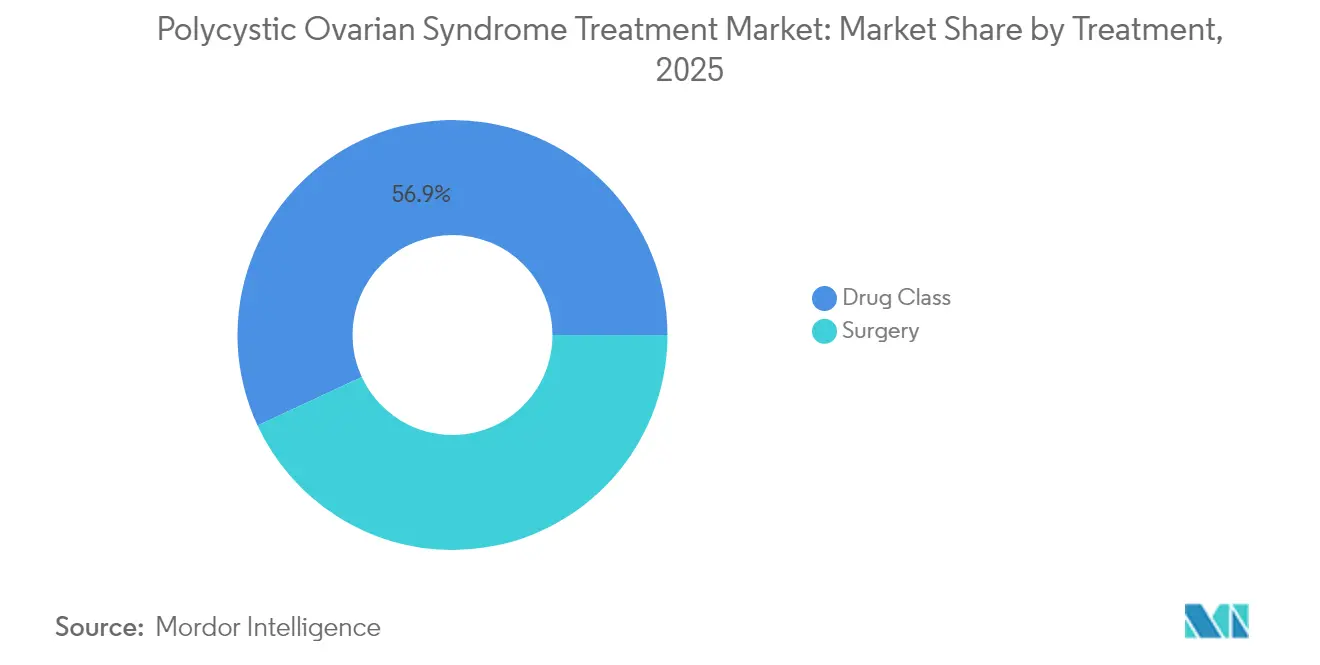
- By treatment modality, drug classes accounted for 56.92% of the Polycystic Ovarian Syndrome Treatment market share in 2025; surgical interventions are projected to record the fastest 8.43% CAGR through 2031.
- By patient need, fertility management commanded 54.88% share of the Polycystic Ovarian Syndrome Treatment market size in 2025, whereas cosmetic and hyperandrogenism relief is expanding at an 8.69% CAGR to 2031.
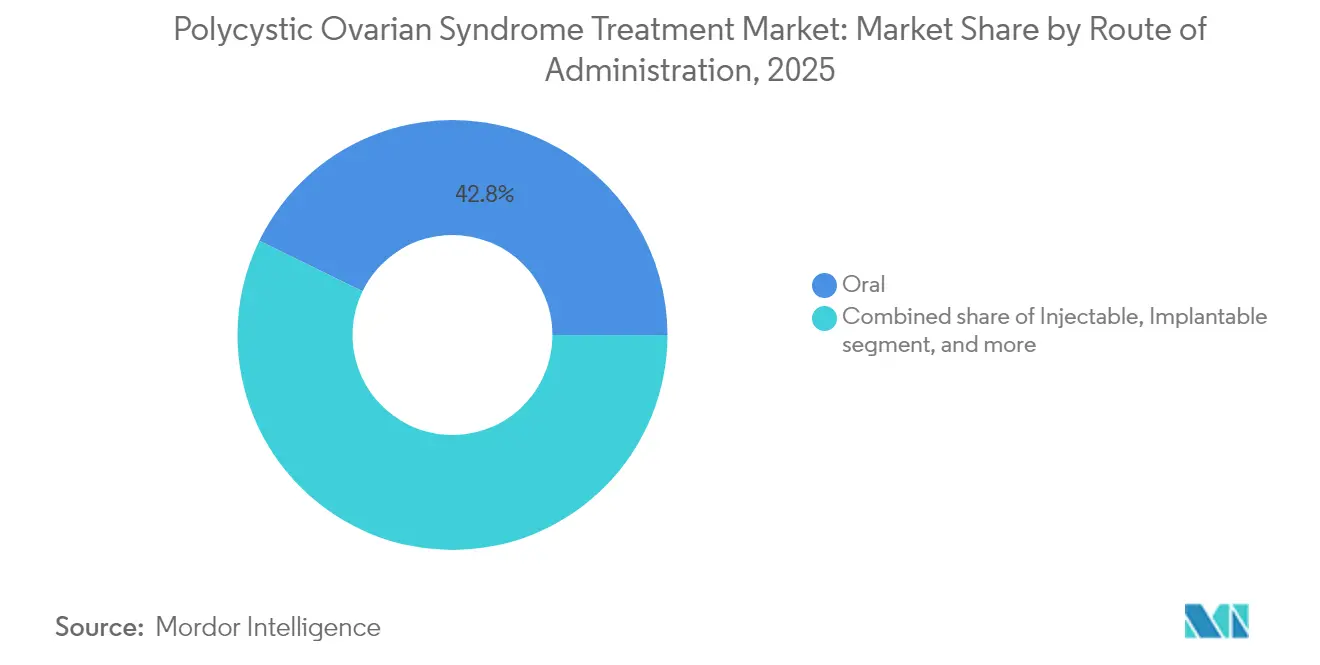
- By route of administration, oral formulations held 42.78% share of the Polycystic Ovarian Syndrome Treatment market size in 2025, while injectables are climbing at a 9.32% CAGR on the back of GLP-1 adoption.
- By distribution channel, hospital pharmacies supplied 49.02% of therapies in 2025; online and direct-to-consumer channels are growing at 9.11% CAGR as virtual women’s clinics scale.
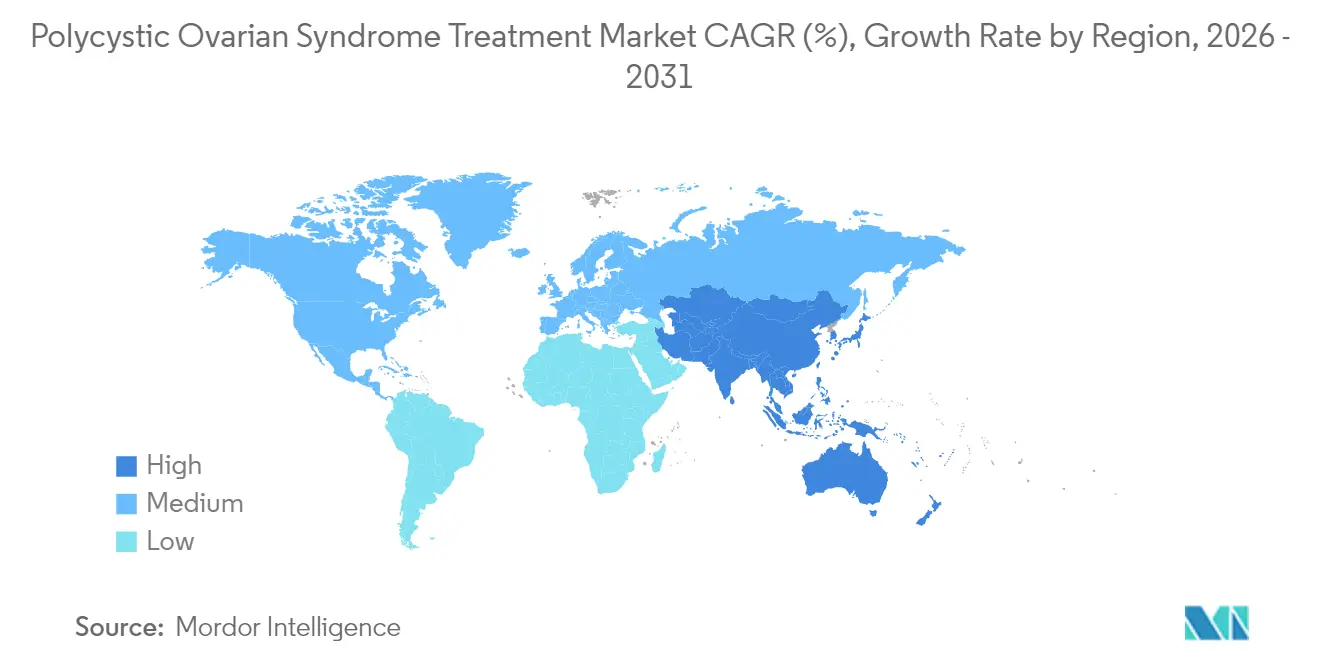
- By geography, North America led with 41.98% market share in 2025, whereas Asia-Pacific is the fastest-growing region at 7.44% CAGR through 2031.
Note: Market size and forecast figures in this report are generated using Mordor Intelligence’s proprietary estimation framework, updated with the latest available data and insights as of 2026.
Global Polycystic Ovarian Syndrome Treatment Market Trends and Insights
Drivers Impact Analysis*
| Driver | % Impact on CAGR Forecast | Geographic Relevance | Impact Timeline |
|---|---|---|---|
| Rising global burden of PCOS | +1.8% | Global; highest in Asia-Pacific & MENA | Long term (≥ 4 years) |
| Increasing adoption of hormonal contraceptives | +1.2% | North America & EU; expanding in emerging markets | Medium term (2-4 years) |
| Growing focus on women’s metabolic health | +1.5% | Global; led by developed markets | Long term (≥ 4 years) |
| Expansion of fertility services & assisted-reproduction clinics | +0.9% | Global; rapid growth in Asia-Pacific | Medium term (2-4 years) |
| Advances in endocrine & metabolic drug development | +1.1% | Concentrated in US, EU, Japan | Long term (≥ 4 years) |
| Government-led awareness & screening programs | +0.7% | Primarily developed markets, expanding globally | Medium term (2-4 years) |
| Source: Mordor Intelligence | |||
Rising Global Burden of Polycystic Ovary Syndrome
New epidemiological surveys report prevalence as high as 17.40% among urban women aged 18-35, far above earlier global estimates of 8-13%. The Global Burden of Disease 2021 update logged an 89% rise in diagnosed cases between 1990 and 2021, with disability-adjusted life years up 87%[2]J. Smith et al., “Metabolic Burden of PCOS 1990-2021,” Frontiers in Public Health, frontiersin.org. Providers now routinely screen adolescents presenting with obesity or irregular cycles, capturing milder phenotypes that once went unrecorded. Economic drag is no longer limited to infertility treatments; downstream diabetes, cardiovascular events, and lost productivity place mounting strain on health budgets. As a result, ministries of health in India, Saudi Arabia, and the Philippines are embedding PCOS modules into national non-communicable disease programs, anchoring long-term demand for integrated solutions.
Growing Focus on Women’s Metabolic Health
Insulin resistance afflicts at least half of all PCOS patients, prompting a pivot from purely reproductive goals to long-run cardiometabolic safeguarding. Semaglutide 2.4 mg produced 12.3% mean weight loss versus 5.7% with metformin in a 48-week head-to-head study, while also curbing free testosterone by 34%. Three-in-one incretin agonists that stimulate GLP-1, GIP, and glucagon pathways are in Phase II, promising additive effects on visceral fat and ovulatory recovery. Payers in Germany and Australia recently classified PCOS as a high-risk pre-diabetes state, green-lighting earlier metabolic pharmacotherapy.
Expansion of Fertility Services and Assisted-Reproduction Clinics
Roughly 80% of anovulatory infertility stems from PCOS, spurring clinic chains to launch PCOS-tailored treatment bundles that combine in-house endocrinology, nutrition coaching, and reproductive technologies. Private equity funds closed more than 20 center acquisitions in 2024, banking on rising demand and recession-resilient cash flows. Artificial-intelligence algorithms that predict ovarian response give clinics a differentiator; Kindbody reports a 14% lift in cumulative live-birth rates after rolling out its PCOS protocol across US locations. These data-rich environments generate anonymized biobanks that drug developers are now mining for genotype–phenotype correlations.
Advances in Endocrine and Metabolic Drug Development
Pipeline activity surged after the FDA published draft guidance outlining surrogate endpoints—such as ovulation rate and HOMA-IR—for accelerated approval. Bayer’s EUR 330 million alliance with Evotec targets folliculogenesis pathways, while AbbVie is moving a selective androgen receptor degrader into Phase I. Venture-backed start-ups are focusing on adiponectin mimetics and kisspeptin modulators that promise multi-system benefits.
Restraints Impact Analysis*
| Restraints Impact Analysis | (~) % Impact on CAGR Forecast | Geographic Relevance | Impact Timeline |
|---|---|---|---|
| Lack of PCOS-specific FDA-approved therapeutics | -1.4% | USA, EU, Japan | Long term (≥ 4 years) |
| Safety concerns with long-term hormonal therapy | -0.8% | Global; most pronounced in high-income countries | Medium term (2-4 years) |
| High out-of-pocket costs for infertility treatments | -1.0% | Emerging & middle-income markets | Medium term (2-4 years) |
| Limited access to specialist care in emerging markets | -0.9% | Asia-Pacific, Africa, Latin America | Long term (≥ 4 years) |
| Source: Mordor Intelligence | |||
Lack of PCOS-Specific FDA-Approved Therapeutics
With no drug formally labelled for PCOS, clinicians lean on diabetes, contraceptive, and weight-loss indications, setting up cumbersome prior-authorization hurdles: 83% of US patients confront at least one rejection before receiving GLP-1 therapy. Trial design is complicated by heterogeneous phenotypes, making agreement on composite endpoints slow. Although recent FDA draft guidance provides clarity, full approvals remain several years away, elongating commercialization cycles and tempering short-term revenue capture.
Safety Concerns With Long-Term Hormonal Therapy
Cardiometabolic risk already runs high in PCOS, so lifetime exposure to estrogen-based contraceptives invites debate about thrombosis and stroke potential. GLP-1 agonists add a layer of vigilance, with thyroid-c-cell hyperplasia flagged in preclinical models MedicalNewsToday. Heightened monitoring inflates care costs and can deter younger women from early initiation, slowing uptake of otherwise effective options.
*Our forecasts treat driver/restraint impacts as directional, not additive. The impact forecasts reflect baseline growth, mix effects, and variable interactions.
Segment Analysis
By Treatment: Drug Classes Maintain Primacy While Devices Gain Speed
Drugs captured 56.92% of the Polycystic Ovarian Syndrome Treatment market in 2025, anchoring revenue through high prescription renewal rates and broad insurance familiarity. Combined oral contraceptives, metformin, and the first wave of GLP-1s dominate formularies, with selective serotonin-reuptake inhibitors addressing comorbid anxiety and depression in 68% of patients. Pipeline diversity is widening as biotechs test androgen receptor degraders and granulosa-cell modulators. Competitive intensity should rise once next-generation incretin tri-agonists, now in Phase II, publish ovulation endpoints.
Surgical and device-based interventions are expanding at an 8.43% CAGR, albeit from a smaller base, driven by minimally invasive ovarian drilling and emerging electrothermal ablation platforms. The REBALANCE study investigates May Health’s catheter-based device, which applies sub-second radiofrequency bursts under ultrasound guidance, potentially reducing adhesion risk versus laparoscopy. Should 12-month ovulation data hold, payors may reposition device therapy ahead of costly repeat pharmacological cycles in clomiphene-resistant cohorts, reshaping reimbursement hierarchies.



By Patient need: Fertility Dominates, Cosmetic Concerns Rise
Fertility management commanded 54.88% of patient expenditure in 2025, reflecting the high share of anovulatory infertility attributable to PCOS and strong demand for ovulation-induction agents and assisted reproduction services. Live-birth rates surpass 60% in women under 35 when individualized stimulation protocols incorporate insulin sensitizers and time-luteal support precisely. Clinics now market bundled packages that weave endocrinology, nutrition, and embryo services, elongating revenue per patient.
Demand for cosmetic and hyperandrogenism relief—covering hirsutism, acne, alopecia—ranks second and will grow fastest at 8.69% CAGR. Patient-reported outcomes reveal sustained distress even in normo-ovulatory phenotypes, spurring uptake of topical anti-androgens, diode-laser hair systems, and dermatology teleconsults. Digital health platforms embed photo-tracking and hormonal dashboards, giving users measurable progress indicators and driving subscription retention beyond fertility-centric windows.
By Route of Administration: Oral Convenience vs. Injectable Potency
Oral formulations retained 42.78% share of the Polycystic Ovarian Syndrome Treatment market size in 2025 on the back of generic metformin, combination estrogen–progestin pills, and emerging inositol blends that posted statistically significant improvements in menstrual regularity during Phase III. Extended-release tablets have reduced gastrointestinal dropout rates, prolonging persistence.
Injectables are the fastest climber at 9.32% CAGR through 2031. Once-weekly semaglutide and tirzepatide offer substantial weight and androgen reductions, while depot formulations stretch dosing to four weeks, tackling compliance hesitations. Research into subdermal implants and micro-needle patches aims to marry oral convenience with parenteral bioavailability, suggesting future pressure on the tablet stronghold.
By Distribution Channel: Digital Paths Widen
Hospital pharmacies distributed 49.02% of therapies in 2025, justified by the condition’s complexity and the need for baseline metabolic testing before initiation AllaraHealth. On-site pharmacists titrate dosages across contraceptives, insulin sensitizers, and psychiatric add-ons, reducing adverse-event calls. Academic centers also host most device-based procedures, reinforcing hospital dominance.
Online pharmacies and direct-to-consumer portals are rising at 9.11% CAGR. Allara Health’s vertically integrated platform bundles teleconsult, labs, and same-day drug shipping; 75% of users reported symptom relief inside 30 days. National chains integrate e-prescriptions into loyalty apps, carving share from retail counters as legislation in states such as Illinois permits pharmacists to furnish contraceptives autonomously.
Geography Analysis
North America led with 41.98% share in 2025, fueled by broad insurance coverage for diagnostic workups, mature fertility infrastructure, and extensive clinical-trial activity. The United States accounted for more than 80% of regional revenue, although prior-authorization hurdles delay GLP-1 starts by a median 37 days. Canada’s recent approval of fezolinetant for vasomotor symptoms signals a regulator receptive to menopausal and metabolic endpoints, setting a precedent for future PCOS-label applications.
Asia-Pacific is the fastest-growing territory at 7.44% CAGR, underpinned by higher urban prevalence, rising disposable income, and large unmet fertility demand. Indian metropolitan studies document 17.40% prevalence in women aged 20-29, spurring federal health centers to adopt universal PCOS screening during antenatal visits. Regulatory harmonization under ASEAN’s Pharmaceutical Product Working Group eases cross-border drug launches, while China’s relaxation of the three-child policy expands reproductive-service enrolments.
Europe delivers steady mid-single-digit gains thanks to universal health coverage and robust specialist networks. National frameworks increasingly reimburse metabolic interventions earlier in the disease course, with Germany’s statutory insurers adding semaglutide to the obesity benefit list for PCOS in 2025. Real-world data from Scandinavian registries feed safety authorities, accelerating label updates for combination therapies.
The Middle East and Africa display sharp prevalence spikes—age-standardized rates rose 37.9% between 1990 and 2019—yet therapeutic uptake remains limited by fragmented reimbursement and specialist scarcity. Pilot tele-endocrinology programs in Saudi Arabia reduce travel times by 60%, indicating digital care may leapfrog facility shortages. South American awareness is climbing: Brazilian cardiovascular societies now classify PCOS as a risk enhancer, prompting lipid-panel reimbursement and metabolic screening.

Regulatory Landscape
Polycystic ovarian syndrome (PCOS) management continues to operate largely within general medicines and device regulatory frameworks rather than indication-specific pathways. As of July 2026, there are no pharmaceutical therapies formally approved specifically for PCOS by either the US FDA or the EMA, keeping prescribing anchored in approved labels for diabetes, obesity, contraception, and related conditions. That absence also raises the importance of payer prior authorization and risk management for real-world access.
Regulators and standard-setting bodies are shaping development through broader reproductive and clinical trial requirements. The FDA clinical trials guidance framework and EMA clinical trial oversight remain the core reference points for study design and evidence expectations, while ESHRE PCOS clinical guidance influences standard of care and endpoint selection in practice. On the safety side, EMA work to update guidance on risk assessment for medicinal products in human reproduction and lactation increases the bar for periconception and pregnancy data packages, a key consideration for metabolic agents and other candidates intended for women of reproductive age.
Competitive Landscape
The polycystic ovarian syndrome treatment market remains highly fragmented, reflecting the absence of disease-specific approvals and the reliance on multi-class off-label prescribing. No manufacturer holds double-digit global share, granting mid-cap innovators space to carve niches with receptor-selective modulators or device-assisted ovulation induction. Bayer’s alliance with Evotec foregrounds big-pharma appetite for validated biology, pairing Evotec’s iPSC platform with Bayer’s commercialization muscle in a EUR 330 million ticket.
Digital-first entrants are reshaping care pathways. Allara Health’s Series B brings cumulative funding to USD 38.5 million, bankrolling nationwide endocrinology-dermatology tele-teams that could eventually negotiate formulary rebates directly with manufacturers. AI-powered diagnostic engines achieve 80-90% accuracy in logistic-regression and CNN models tested on 15,000 ultrasound images, holding promise for streamlined triage in resource-constrained clinics.
Device firms also court attention. May Health’s USD 25 million Series B funds pivotal trials for its ovarian rebalancing catheter, while Provation Life secured US patents for an inositol-based supplement with slow-release chromium intended to enhance insulin sensitivity. Consolidation in fertility services amplifies buyer power; US operator Kindbody leverages its 2.7 million covered lives to negotiate drug discounts, an emerging threat to standalone specialty pharmacies.
Polycystic Ovarian Syndrome Treatment Industry Leaders
Pfizer Inc.
Teva Pharmaceutical Industries Limited
Novartis International AG
Takeda Pharmaceutical Company Limited
Bayer AG
- *Disclaimer: Major Players sorted in no particular order


Market Opportunities and Future Outlook
A clear whitespace sits between high clinical use and limited formal labeling: with no FDA- or EMA-approved PCOS-specific drugs as of July 2026, manufacturers can differentiate through programs that generate PCOS-relevant endpoints, such as ovulation rate and insulin resistance markers, alongside reproductive safety datasets that support label expansion rather than relying on purely off-label adoption. This creates room for life-cycle strategies around established metabolic and endocrine agents, alongside new combinations being evaluated in PCOS research, including multi-agent metabolic regimens explored in academic protocols.
Opportunities are also forming around the metabolic-first care pathway and standardized guidance that can influence reimbursement and care algorithms. In July 2026, NICE published a first draft UK national guidance for polyendocrine metabolic ovarian syndrome (PMOS), recommending off-label use of therapies such as metformin, progestogens, spironolactone, and combined oral contraceptives. This helps normalize pathway-driven treatment selection and increases the role of primary care and virtual clinics in ongoing management. On the innovation side, trial activity supports a shift toward next-generation metabolic regulators, illustrated by a Phase 2 PCOS study initiated in June 2026 at Shanghai Zhongshan Hospital for HEC88473, a GLP-1/FGF21 dual agonist. The program adds competitive pressure around injectables and highlights the need for patient stratification tools that match therapy to heterogeneous PCOS phenotypes.
Recent Industry Developments
- March 2026: Organon discontinued development of a preclinical PCOS drug candidate previously acquired from Forendo, as disclosed via KDventures AB, and wrote off the related book value. The reduction in near-term PCOS-specific R&D activity among large-cap women’s health portfolios reinforces the market’s current dependence on off-label pharmacotherapy and non-drug solutions.
- December 2025: May Health received CE Mark certification under the EU Medical Device Regulation for the Anavi System, an office-based radiofrequency device intended for PCOS-related infertility care. This supports Europe as an early commercialization pathway for procedure-based alternatives to repeated pharmacologic cycles in clomiphene-resistant cohorts.
- October 2024: Provation Life received US patents covering its Inositol Plus formulation aimed at insulin resistance management in PCOS. While nutraceuticals are outside the report’s market sizing scope, the patent activity points to ongoing IP formation around metabolic symptom management that can influence patient behavior and adjacent product positioning.


Research Methodology Framework and Report Scope
Market Definition and Coverage
This market covers revenues from clinically used treatments for polycystic ovarian syndrome, including prescription medicines, fertility-related procedures, and surgical interventions used to manage reproductive, metabolic, endocrine, and cosmetic symptoms in adolescents and women.
Scope exclusions: Excludes nutraceutical supplements and OTC herbal formulations sold without a prescription.
Segmentation Overview
- By Treatment
- Drug Class
- Hormonal Contraceptives
- Insulin-Sensitizing Agents
- Anti-Depressants
- Anti-Obesity Agents
- Other Drug Classes
- Surgery
- Ovarian Wedge Resection
- Laparoscopic Ovarian Drilling
- Other Surgeries
- Drug Class
- By Patient Need
- Fertility Management
- Metabolic / Weight Management
- Cosmetic / Hyper-androgenism Relief
- By Route of Administration
- Oral
- Injectable
- Implantable
- Transdermal
- By Distribution Channel
- Hospital Pharmacies
- Retail Pharmacies
- Online Pharmacies & DTC Platforms
- Geography
- North America
- United States
- Canada
- Mexico
- Europe
- Germany
- United Kingdom
- France
- Italy
- Spain
- Rest of Europe
- Asia-Pacific
- China
- Japan
- India
- Australia
- South Korea
- Rest of Asia-Pacific
- Middle East & Africa
- GCC
- South Africa
- Rest of Middle East & Africa
- South America
- Brazil
- Argentina
- Rest of South America
- North America
Data Sources, Market Sizing, and Validation
Desk Research
Desk work starts with building a consistent view of diagnosed patient pools and treated demand across key regions, and then aligning that with what is reimbursed and routinely prescribed. We rely on public health statistics and clinical guidance, and then we map those signals to therapy use so the model reflects how PCOS is handled in care settings.
Typical sources used include CDC and NIH publications, WHO health statistics, OECD health data, and U.S. FDA drug databases and safety updates. We also review peer-reviewed clinical journals and guidance from professional associations in endocrinology and reproductive medicine, plus company filings, investor presentations, and reputable press coverage for therapy uptake and launches. When needed, we complement this with paid subscriptions for company financials and intelligence, patent databases, and an import or export shipment-level database to sanity-check supply movement. These examples are not exhaustive, and many other public and paid sources were also used for data collection, validation, and clarification.
Primary Interviews and Surveys
Primary discussions were used to test the treated-share assumptions and the typical therapy mix by symptom cluster, with a focus on insulin resistance management, hormonal regulation, and fertility pathway use. We spoke with clinicians, hospital and clinic pharmacy stakeholders, and industry roles tied to product strategy and market access, and we balanced inputs across APAC, EMEA, and the Americas to capture regional prescribing and reimbursement differences.
Distribution of primary research fieldwork respondents
| Company type | Respondent position | Region |
|---|---|---|
| Top tier: 28% | CXOs: 12% | APAC: 43% |
| Mid tier: 58% | Functional/Unit leaders: 39% | EMEA: 33% |
| Smaller Players: 14% | Managers: 49% | Americas: 24% |
Market-Sizing & Forecasting
Sizing is built by using a top-down demand-pool reconstruction, where diagnosed prevalence, care-seeking behavior, and treatment penetration are applied to the eligible female population and then converted to revenue using therapy mix and price levels. To keep the totals grounded, we also run selective bottom-up checks using sampled volume assumptions by therapy category and channel, then we test whether the implied revenues remain realistic using average selling price ranges.
Inputs that matter in this market include diagnosed PCOS prevalence by age band, the share of patients treated for metabolic symptoms versus fertility support, prescription intensity and typical duration of therapy, procedure rates for fertility services and surgical interventions, and price movements driven by payer coverage and generic availability. Where some countries lack clean series, gaps are handled by using proxy markets with similar reimbursement structures and clinical practice, and then re-testing the output with experts until the implied treated population and spend look consistent.
For forecasting, scenario analysis is used so changes in diagnosis rates, obesity and insulin resistance trends, and fertility service utilization can be varied transparently. Assumptions are then tightened using the consensus range from interview feedback, so the forward curve stays practical and explainable.
Data Validation & Update Cycle
Validation is done through multiple checks so the final numbers do not rely on a single data series. We compare outputs against independent signals such as procedure volumes, prescription mix expectations, and country-level healthcare spending patterns, and then investigate any jumps that cannot be explained by a known event.
Before sign-off, the model and assumptions go through step-by-step internal review, and re-contact is triggered when an input materially shifts the results or when an outlier appears at the country level. Reports are refreshed annually, with interim updates for major regulatory, pricing, or access changes, and a final pre-delivery review pass is completed so clients receive the most current view.
Mordor Intelligence's Polycystic Ovarian Syndrome Treatment Market Estimate Compared With Other Published Estimates
Published market sizes for PCOS treatment can vary even when the topic sounds identical, because studies do not always count the same therapy set, patient pool, and pricing basis. Differences also show up when one model mixes symptom-management spending with broader women's health categories, or when procedure revenues are treated inconsistently across sources.
The main gap comes from whether fertility procedures and surgical interventions are included alongside prescription therapy, and Mordor Intelligence counts these only when they are used specifically to manage PCOS-linked outcomes, then prices them in constant 2024 USD. Other gaps are created by the base year used, the way treated prevalence is estimated (diagnosed versus total prevalence), and how price evolution is handled when generics expand or reimbursement tightens.
Benchmark comparison
| Source | Market Size | Gaps in Research Methodology |
|---|---|---|
| Mordor Intelligence | USD 5.39 B (2026) | |
| Global Consultancy A | USD 4.79 B (2024) | Uses a 2024 base year with a therapy-class and channel view that can lean more heavily on prescription drug revenues, and it may not align procedure inclusion and constant-dollar treatment with the same consistency across regions. |
| Industry Publisher B | USD 4.84 B (2024) | Often applies broader symptom-management scope (including lifestyle-led care narratives) and longer-horizon assumptions, which can shift treated-share and pricing curves without the same country-level checks on diagnosis and therapy mix. |
The spread in values is mainly explained by what gets counted as PCOS-specific treatment revenue and how the treated population is built up from prevalence to real utilization. By keeping the inputs tied to diagnosed and treated cohorts, therapy mix, and transparent pricing logic, the estimate remains traceable and can be reproduced when assumptions are updated.


Key Questions Answered in the Report
What is the projected size of the Polycystic Ovarian Syndrome Treatment market by 2031?
The Polycystic Ovarian Syndrome Treatment market is forecast to reach USD 7.24 billion by 2031 at a 6.07% CAGR during 2026-2031.
Which treatment modality currently leads the Polycystic Ovarian Syndrome Treatment market?
Drug classes lead with 56.92% share in 2025, buoyed by hormonal contraceptives, metformin, and growing GLP-1 uptake.
Why are GLP-1 receptor agonists gaining traction in PCOS management?
GLP-1 receptor agonists deliver superior weight and androgen reductions versus metformin, supporting a metabolic-first care model.
Which region is expected to grow fastest, and why?
Asia-Pacific will expand at 7.44% CAGR due to high urban prevalence, increasing disposable income, and expanding access to specialty fertility services.
How fragmented is the competitive landscape?
No firm commands double-digit share; the absence of FDA-approved PCOS-specific drugs keeps the field open for both large-cap collaborations and venture-backed innovators.
Page last updated on:


 Your data is secure and never sold or shared.


