
Gynecology Drugs Market Size and Share
Market Overview
| Study Period | 2020 - 2031 |
|---|---|
| Market Size (2026) | USD 76.43 Billion |
| Market Size (2031) | USD 96.3 Billion |
| Growth Rate (2026 - 2031) | 4.74 % |
| Fastest Growing Market | Asia Pacific |
| Largest Market | North America |
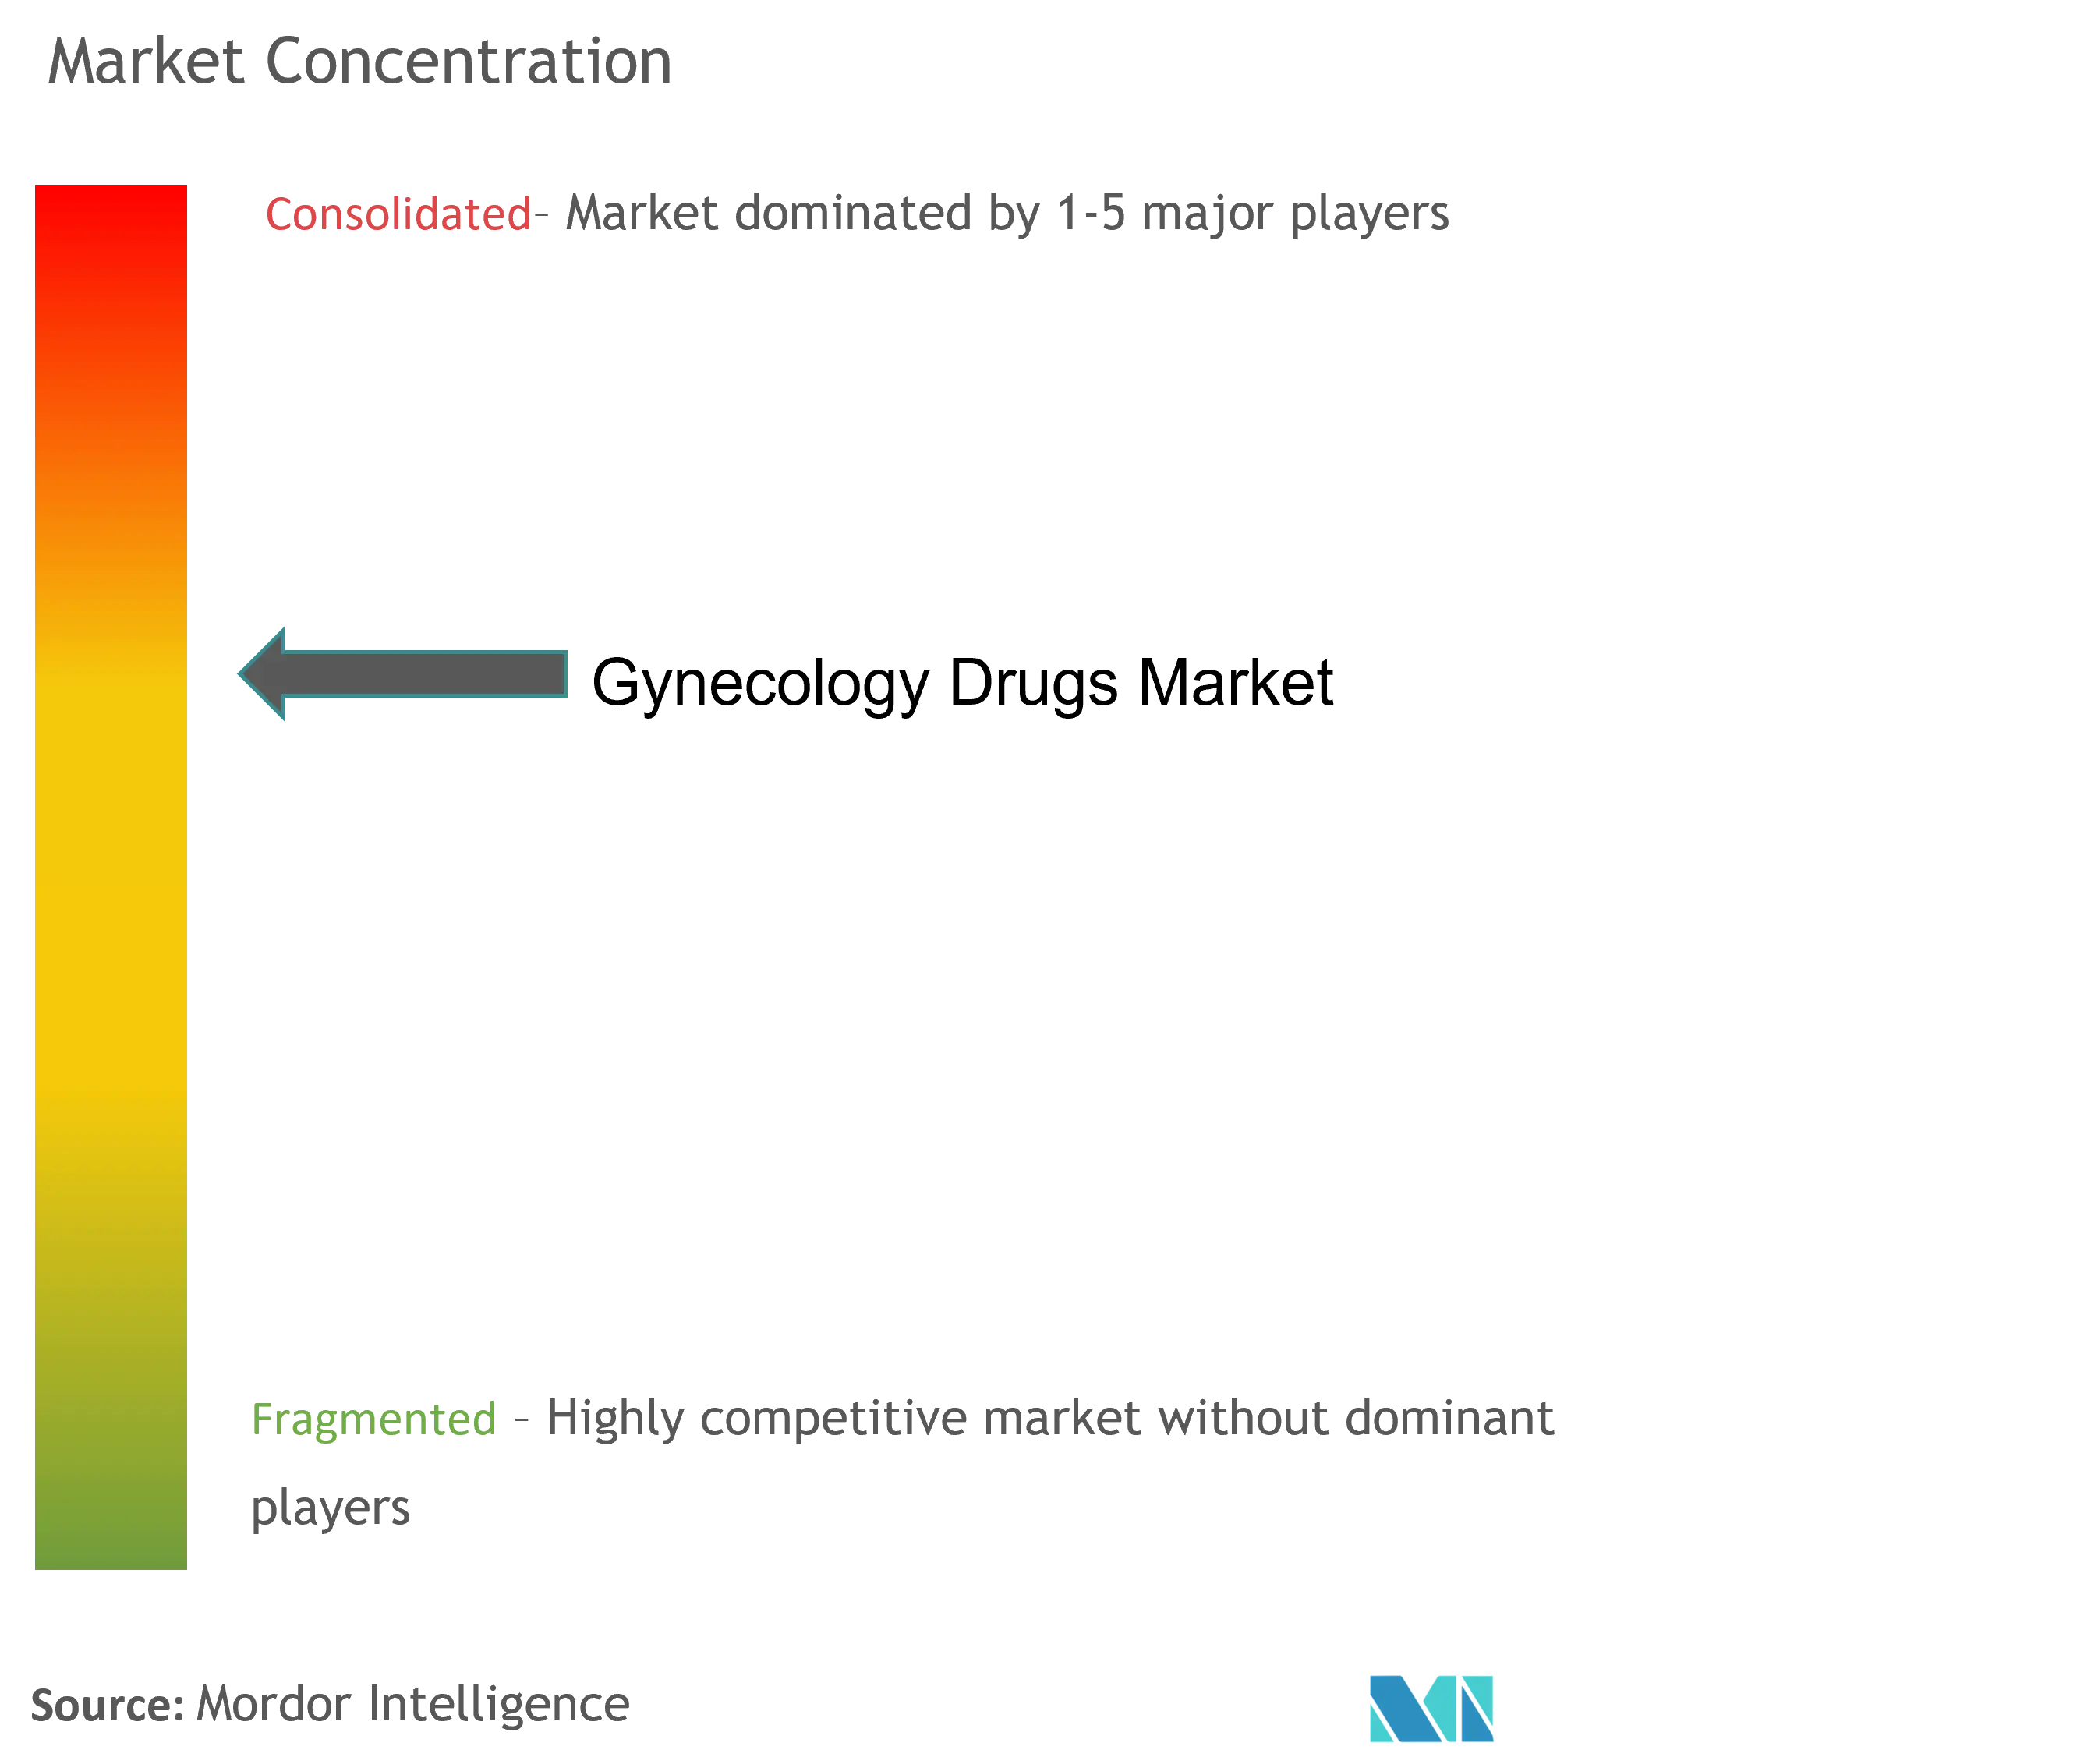
| Market Concentration | Medium |
Major Players *Disclaimer: Major Players sorted in no particular order Image © Mordor Intelligence. Reuse requires attribution under CC BY 4.0. | |
Gynecology Drugs Market Analysis by Mordor Intelligence
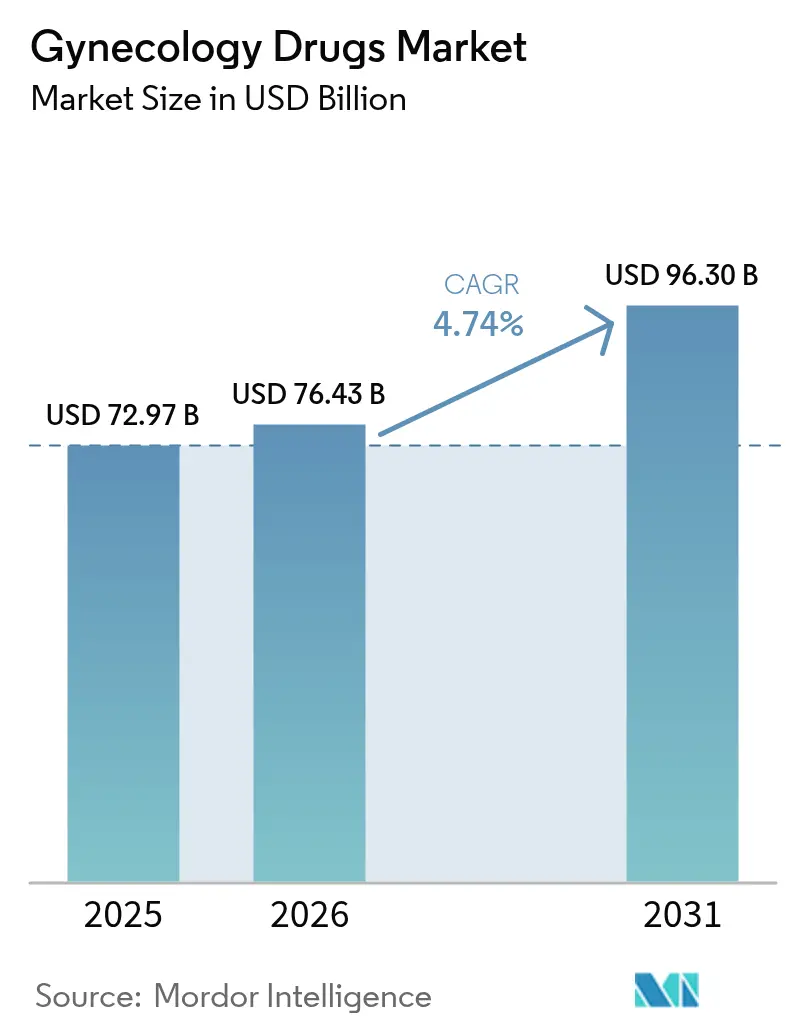
The gynecology drugs market size was valued at USD 72.97 billion in 2025 and estimated to grow from USD 76.43 billion in 2026 to reach USD 96.3 billion by 2031, at a CAGR of 4.74% during the forecast period (2026-2031). Demographic aging, rapid diagnostic advances, and the FDA’s ongoing reassessment of black-box warnings on hormone therapy together create a supportive regulatory climate that could widen therapeutic adoption. Breakthrough antibody-drug conjugates (ADCs) such as mirvetuximab soravtansine are rewriting standards of care in ovarian cancer, while digital pharmacy models expand contraceptive reach beyond brick-and-mortar outlets. Meanwhile, fem-tech startups secure venture capital to address polycystic ovary syndrome (PCOS) and endometriosis, adding competitive pressure on incumbents with legacy contraceptive portfolios.
Key Report Takeaways
- By therapeutic class, hormonal therapies captured 68.07% of the gynecology drugs market share in 2025.
- By indication, contraception contributed 34.12% of the gynecology drugs market size in 2025, while gynecologic oncology is projected to expand at a 5.95% CAGR to 2031.
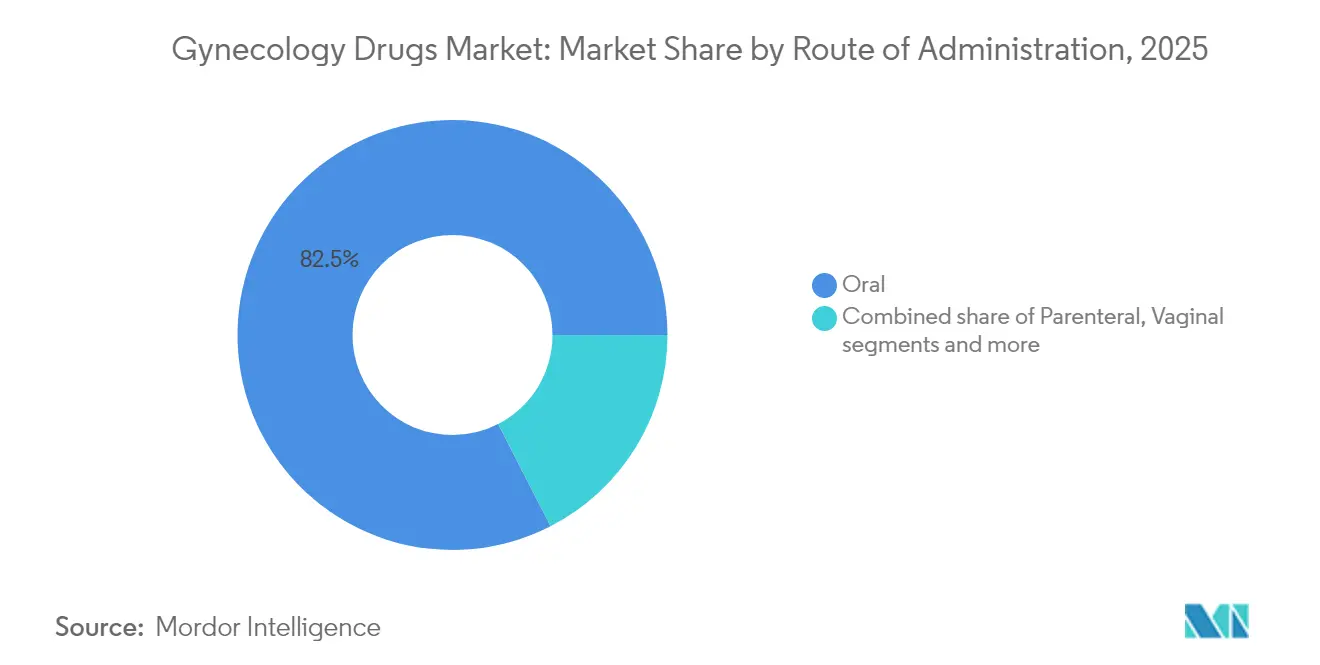
- By route of administration, oral products represented 82.54% of the gynecology drugs market size in 2025.
- By distribution channel, retail pharmacies held 45.74% revenue share in 2025; online pharmacies are forecast to advance at a 5.81% CAGR through 2031.
Note: Market size and forecast figures in this report are generated using Mordor Intelligence’s proprietary estimation framework, updated with the latest available data and insights as of 2026.
Market Trends and Insights
Drivers Impact Analysis of Gynecology Drugs Market*
| Driver | (~) % Impact on CAGR Forecast | Geographic Relevance | Impact Timeline |
|---|---|---|---|
| Growing preference for long-acting reversible contraceptives (LARCs) | +0.8% | Global, with early adoption in North America & Europe | Medium term (2-4 years) |
| Surging adoption of once-daily non-hormonal menopause therapies | +1.2% | North America & Europe primarily, expanding to APAC | Short term (≤ 2 years) |
| FDA fast-track approvals for antibody-drug conjugates in gynecologic oncology | +0.9% | Global, led by US regulatory precedence | Medium term (2-4 years) |
| Rapid expansion of online direct-to-consumer (DTC) fertility drug platforms | +0.7% | North America & Europe, emerging in urban APAC | Short term (≤ 2 years) |
| Rising investment in fem-tech start-ups targeting PCOS & endometriosis | +0.5% | Global, concentrated in developed markets | Long term (≥ 4 years) |
| Country-level reimbursement for osteoporosis biologics | +0.6% | Developed markets with established healthcare systems | Medium term (2-4 years) |
| Source: Mordor Intelligence | |||
Growing Preference for Long-Acting Reversible Contraceptives (LARCs)
Health-system cost analyses consistently favor LARCs over short-acting options, pushing payers to bolster reimbursement. CooperSurgical’s upgraded Paragard inserter, engineered for one-handed deployment, streamlines in-office placement workflows. Uptake is visible in low-resource clinics where copper IUDs reduce supply-chain dependency and follow-up visits. Policy makers now bundle counseling for LARCs into preventive-care visits, aligning with public-health objectives that target unintended pregnancies. These structural enablers stand to funnel recurrent demand into the gynecology drugs market over the medium term. As more Medicaid programs waive insertion fees, provider adoption is poised to quicken further.
Surging Adoption of Once-Daily Non-Hormonal Menopause Therapies
Phase III data for Bayer’s elinzanetant confirmed significant vasomotor symptom relief without estrogen exposure, validating neurokinin antagonism as an effective pathway. The FDA approval of fezolinetant set a regulatory precedent in 2024, although post-launch liver-monitoring requirements heightened pharmacovigilance expectations. An estimated 1.2 billion women will reach menopause by 2030, framing a sizeable patient pool for safer alternatives. Physicians report rising demand from individuals contraindicated for hormones, further stimulating the gynecology drugs market. Educational campaigns by industry groups now emphasize differentiation between systemic estrogens and selective neurokinin blockers to allay residual safety concerns.
FDA Fast-Track Approvals for Antibody-Drug Conjugates in Gynecologic Oncology
The agency’s rapid greenlight for mirvetuximab soravtansine demonstrated survival extension in folate-receptor-alpha-positive ovarian cancer, prompting oncologists to re-sequence chemotherapy lines. A robust pipeline targeting Nectin-4, TROP2, and tissue factor suggests sustained innovation currents. Companion diagnostics co-developed with ADCs strengthen precision-medicine paradigms and justify premium pricing. Academic cancer centers collaborate with biotech firms to run basket trials that compress development timelines. These dynamics expand parenteral volumes, enhancing the gynecology drugs market’s biologics mix through 2030.
Rapid Expansion of Online Direct-to-Consumer Fertility Drug Platforms
Integrated telehealth portals now bundle consultation, prescription, and home delivery under unified user interfaces. Companies leverage algorithmic treatment pathways to streamline refill adherence, a critical differentiator in the competitive fertility-benefits arena. HIPAA updates tightened reproductive-health data safeguards, raising the compliance bar for new entrants. The model gains further traction as state policies broaden insurance coverage for IVF medications, increasing digital pharmacy traffic.
Restraints Impact Analysis of Gynecology Drugs Market*
| Restraint | (~) % Impact on CAGR Forecast | Geographic Relevance | Impact Timeline |
|---|---|---|---|
| Hormone-therapy safety concerns (VTE, breast-cancer risk) | -1.1% | Global, particularly acute in developed markets | Short term (≤ 2 years) |
| Patent-cliff driven price erosion in oral contraceptives | -0.7% | Global, most pronounced in generic-friendly markets | Medium term (2-4 years) |
| Socio-cultural barriers to contraception in conservative economies | -0.5% | Emerging markets, particularly South Asia & Sub-Saharan Africa | Long term (≥ 4 years) |
| API supply-chain fragility for niche gynecologic oncology drugs | -0.4% | Global, with concentrated manufacturing vulnerabilities | Short term (≤ 2 years) |
| Source: Mordor Intelligence | |||
Hormone-Therapy Safety Perceptions
Black-box warnings highlighting venous-thromboembolism and breast-cancer risk still dampen prescription volumes despite modern evidence favoring transdermal and natural-estrogen profiles. Specialist societies lobby for nuanced labeling, but behavior change among general practitioners progresses slowly. Patients over 65 remain a challenging subgroup where cardiovascular risk complicates benefit-risk dialogues. Transdermal patches offer a pharmacokinetic advantage yet struggle for formulary placement without long-term outcomes data. Until labeling updates materialize, hesitancy will cap the gynecology drugs market’s hormone-segment upside.
Patent-Cliff Price Erosion in Oral Contraceptives
Multiple branded pills lost exclusivity in 2025, unleashing a wave of low-cost generics that rebased average selling prices by double digits. Payers quickly shifted formularies, squeezing margins for innovators. Manufacturers responded with lifecycle-management tactics such as orally disintegrating tablets, but differentiation remains modest. Over-the-counter approval of a progestin-only pill added fresh competition while resetting price anchors for the entire category. Cost-sensitive emerging markets welcome the shift, yet aggregate revenue pressure tempers the gynecology drugs market’s near-term growth.
*Our forecasts treat driver/restraint impacts as directional, not additive. The impact forecasts reflect baseline growth, mix effects, and variable interactions.
Gynecology Drugs Market Segment Analysis
By Therapeutic Class:
Portfolio Diversification AcceleratesHormonal agents generated 68.07% revenue in 2025, sustained by entrenched physician familiarity and decades of efficacy data. Yet non-hormonal entrants grew at a robust 5.33% CAGR, carving niches in menopause and cancer care. Elevated safety profiles attract users who previously avoided hormones, broadening addressable populations. ADCs now create a hybrid sub-class blurring lines between cytotoxics and targeted biologics, pushing parenteral volumes upward. To protect incumbency, leading firms redesign progestins and estrogen analogs with improved metabolic impact. Generics crowd the low-dose contraceptive segment, but premium non-hormonal brands partially offset revenue attrition.
Forward-looking R&D increasingly incorporates sex-specific endpoints following updated FDA guidance, accelerating bench-to-clinic translation. Venture-backed biotechs exploit this opening with novel neurokinin and GnRH modulators. The gynecology drugs market consequently pivots toward a balanced mix where hormonal stalwarts coexist with innovation-driven non-hormonal franchises.




By Indication:
Oncology Commands Premium PricingContraception controlled 34.12% of revenue in 2025, reflecting broad public-health adoption. Nevertheless, oncology posted the fastest 5.95% CAGR as ADCs and targeted inhibitors gained traction. Infertility pharmacotherapy maintains mid-single-digit growth, fueled by rising maternal age and employer-funded IVF benefits. Postmenopausal disorders await broader hormone-safety consensus, but non-hormonal breakthroughs stimulate moderate uptake. PCOS therapies evolve beyond insulin sensitizers toward metabolic agents, expanding indication breadth. Endometriosis saw renewed interest after European endorsement of linzagolix, underscoring global unmet need.
Osteoporosis biologics achieve incremental gains as reimbursement widens. Infectious-disease antimicrobials remain stable, though topical innovations improve patient adherence. Collectively, the shifting indication mix recalibrates the gynecology drugs market toward higher biological complexity and differentiated value propositions.
By Route of Administration:
Precision Therapies Propel Parenteral GrowthOral dosing dominated with an 82.54% share in 2025, bolstered by daily contraceptives and menopause tablets. Yet parenteral formats advanced at a 5.66% CAGR, leveraging hospital infusion infrastructure for ADCs and long-acting injectables. Intravenous regimens enable controlled pharmacokinetics essential for tumor-targeting payloads, validating investment in cold-chain capacity. Subcutaneous depot injections extend contraceptive coverage up to three months, aligning with adherence-improvement strategies.
Vaginal gels and rings record steady uptake where localized delivery minimizes systemic exposure. Topical hormonal creams enjoy modest demand for urogenital atrophy, although formulary access varies. Transdermal patches gain momentum among thrombosis-risk patients, offering a bridge between convenience and safety. This evolving route distribution supports manufacturing diversification, strengthening resilience within the gynecology drugs market.
By Distribution Channel:
Digital Dispensing Gains MomentumRetail pharmacies accounted for 45.74% of 2025 revenue, underpinned by insurance adjudication workflows and pharmacist counseling. However, online pharmacies accelerated at 5.81% CAGR as telemedicine prescriptions surged post-pandemic. Platform convenience, subscription refills, and discreet delivery resonate with younger demographics, especially for contraception. Hospital pharmacies retain a niche for high-complexity biologics requiring clinician oversight. Emerging omnichannel strategies now integrate digital ordering with same-day pickup at community stores, blurring channel boundaries.
Regulatory frameworks tighten cybersecurity around reproductive-health data, prompting investment in encryption and identity verification. As API tracking mandates strengthen, distributors deploy blockchain pilots for transparent provenance. These advances collectively modernize supply chains and bolster patient reach, sustaining the gynecology drugs market’s sales velocity.
Geography Analysis
North America Gynecology Drugs Market
North America generated 31.88% of 2025 sales, leveraging mature reimbursement and rapid FDA approvals to maintain therapeutic leadership. The region’s payer mix encourages swift formulary inclusion of innovations such as elinzanetant, although carboplatin shortages expose manufacturing fragility. Fem-tech investment ecosystems in Boston and San Francisco funnel capital into PCOS and endometriosis pipelines, invigorating competitive churn. Insurer coverage expansions for infertility drugs amplify prescription volumes, further enlarging the gynecology drugs market footprint.
Europe Gynecology Drugs Market
Europe follows with steady uptake across contraceptive and menopause segments, supported by coordinated regulatory pathways. The European Commission’s nod for linzagolix broadened endometriosis options and underscored the continent’s receptivity to non-hormonal mechanisms. Divergent country reimbursement rules necessitate granular market-access strategies, yet centralized safety evaluations speed pan-regional launches. Aging demographics intensify demand for osteoporosis biologics, anchoring long-term growth.
APAC Gynecology Drugs Market
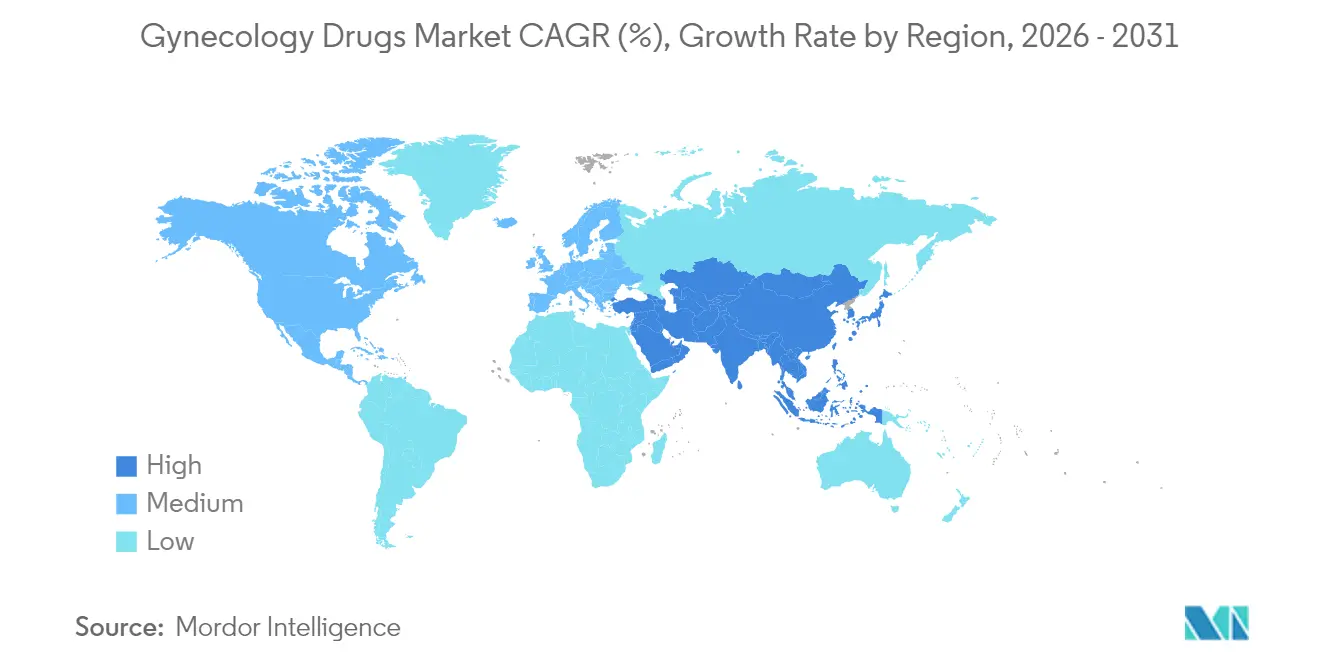
Asia-Pacific is projected to deliver a 6.07% CAGR through 2031, powered by healthcare infrastructure upgrades and rising disposable incomes. Japanese and Australian markets show receptivity to advanced oncology biologics, whereas populous Southeast Asian nations concentrate on affordable contraceptives. Local API production hubs in India and China offer cost advantages yet also present geopolitical risk. Cultural barriers in certain economies moderate hormone-therapy uptake, but urban consumers increasingly prioritize evidence-based gynecological care. Government initiatives that subsidize LARC insertions invigorate segment penetration, expanding the gynecology drugs market across emerging settings.

Regulatory Landscape
Regulation in gynecology drugs continues to be shaped by heightened pharmacovigilance for hormonal contraception and quicker review pathways for novel therapies. In July 2026, EMA PRAC flagged a small increased risk of meningioma with long-term use of desogestrel- or etonogestrel-containing contraceptives, underscoring the importance of periodic label updates, contraindications, and risk-minimization measures for widely used products. On the approvals front, EMA granted marketing authorization for Fylrevy (estetrol) in March 2026 for menopausal hot flushes, reflecting continued regulatory openness to newer estrogen profiles alongside non-hormonal options.
Manufacturing and supply-chain oversight is tightening in parallel. In July 2026, the US FDA issued a proposed rule (Docket No. FDA-2025-N-6075) to modernize drug establishment registration and listing, including improved visibility for foreign drug and API manufacturing and accommodation for distributed manufacturing models, with comments due by September 11, 2026. Trade and import policy attention also increased in April 2026 through a US presidential action focused on adjusting imports of patented pharmaceuticals and pharmaceutical ingredients, which adds further compliance and sourcing scrutiny for globally supplied gynecology therapies.
Value Chain Analysis
The gynecology drugs value chain runs from API production (synthetic hormones, oncology payloads, fertility biologics) to formulation and fill-finish (solid oral dose manufacturing for contraceptives and menopause drugs, plus sterile injectables for oncology and long-acting depots). It also depends on regulatory quality systems and multi-channel distribution across hospital, retail, and online pharmacy.
API sourcing is concentrated in established manufacturing hubs in China and India for multiple synthetic progestin inputs, while temperature-controlled fertility biologics typically move through hub-and-spoke cold-chain networks anchored in the United States and Western Europe, with secondary nodes in markets such as Sao Paulo and Sydney. Recent disruption signals point to operational vulnerabilities across the chain. In June 2026, production setbacks at Aspen Pharmacare facilities contributed to shortages of state-subsidized oral contraceptives in South Africa, showing how single-site manufacturing issues can quickly translate into patient access constraints. Separately, supply tightness reported for certain estrogen patch products in 2026 highlights the dependence of complex transdermal manufacturing on specialized capacity and stable raw-material availability, reinforcing the need for redundancy across contract manufacturing, quality release, and distribution planning.
Competitive Landscape
Market structure is moderately fragmented. Bayer, Pfizer, and Johnson & Johnson protect contraceptive franchises via incremental reformulations, while AbbVie and AstraZeneca advance oncology pipelines. Strategic acquisitions characterize 2024-2025; Insud Pharma’s USD 45 million buyout of Agile Therapeutics secured the Twirla patch, and Cosette Pharmaceuticals’ USD 430 million purchase of Mayne Pharma augmented a menopause-focused portfolio. Partnerships with digital pharmacies grow, as incumbents seek direct-to-consumer footholds without disrupting wholesaler ties. Biotechs leverage orphan-drug exclusivities for rare gynecologic cancers, commanding premium reimbursements that offset limited patient populations.
R&D spending gravitates toward non-hormonal menopause solutions and ADC payload optimization. Companies pilot AI-driven trial designs that stratify by hormone status, compressing development cycles. Manufacturing resilience gains board-level visibility after chemotherapeutic shortages; dual-sourcing of platinum APIs and fill-finish redundancy become standard. Sustainability narratives also surface, with firms trialing recyclable blister packs for oral contraceptives.
Competitive pressure intensifies as generics exploit post-2025 patent cliffs. Branded players counter through patient-support programs and loyalty apps that gamify adherence. Yet price ceilings imposed by government insurance in several markets constrain upside. Overall, diversified pipelines and omnichannel engagement strategies remain pivotal for share defense within the gynecology drugs market.
Gynecology Drugs Industry Leaders
Ferring Holding SA
TherapeuticsMD Inc.
AbbVie Inc.
Pfizer Inc.
GSK plc
- *Disclaimer: Major Players sorted in no particular order
Gynecology Drugs Market Companies Covered in this Report
- Bayer
- Pfizer
- Merck
- GlaxoSmithKline
- Abbvie
- AstraZeneca
- Johnson & Johnson
- Eisai
- Roche
- Novartis
- Eli Lilly and Company
- Teva Pharmaceutical Industries
- Viatris
- Amgen
- Sanofi
- Agile Therapeutics, Inc.
- Organon
- Cooper Companies, Inc.
- Lupin
- Cadila Healthcare Ltd. (Zydus Group)

Market Opportunities and Future Outlook
Lifecycle management and access expansion in established categories create whitespace where clinical convenience can improve adherence and total duration of protection. In January 2026, the US FDA approved Organon’s supplemental NDA extending NEXPLANON use from three to five years, strengthening the long-acting reversible contraception value proposition and raising the bar for competing LARC options across counseling, reimbursement, and provider workflow. The change also supports differentiated service models where payers and clinics prioritize fewer replacement procedures and longer coverage windows.
Menopause and infertility segments offer additional room through new mechanisms and broader supply availability. EMA’s March 2026 marketing authorization for Fylrevy (estetrol) adds another regulatory-backed option for vasomotor symptoms, and the November 2025 EMA authorization for Lynkuet expands non-hormonal choice sets for moderate-to-severe menopausal symptoms. On infertility, April 2026 US FDA approval of Glenmark’s Progesterone Vaginal Inserts 100 mg (bioequivalent to Endometrin) increases availability for luteal support, with emphasis on price-access pathways where generics and branded support programs compete through pharmacy channel execution and reliable manufacturing supply.
Recent Industry Developments in Gynecology Drugs Market
- June 2026: Elahere (mirvetuximab soravtansine) received NHS approval in England for advanced, platinum-resistant ovarian, fallopian tube, or primary peritoneal cancer. The decision expands funded access for a precision ADC in a high-need gynecologic oncology population and can influence treatment sequencing and purchasing through hospital oncology pathways.
- May 2025: Viatris reported positive Phase III data for its low-dose Xulane LO contraceptive patch and communicated plans for an FDA filing in late 2025. The program supports lifecycle extension in the transdermal contraceptive segment, where differentiation depends on tolerability, dose optimization, and payer positioning against generics.
- March 2025: Final MIRASOL analysis reported a 32% mortality reduction with mirvetuximab soravtansine in platinum-resistant ovarian cancer. The results reinforced the clinical rationale for ADC adoption in gynecologic oncology and increased competitive pressure on legacy chemotherapy regimens and emerging targeted combinations.


Gynecology Drugs Market Report Scope and Research Methodology
Market Definition and Coverage
For this study, the gynecology drugs market covers prescription and administered medicines used to prevent, diagnose, treat, or manage female reproductive health conditions across major care settings, and it is measured as manufacturer level revenue in USD.
Scope exclusions: Devices, diagnostic tests, fertility procedures, and non-drug consumables are excluded from the market totals.
Segments Covered in This Report
- By Therapeutic Class (Value)
- Hormonal Therapy
- Non-Hormonal Therapy
- By Indication (Value)
- Contraception
- Gynecology Infections
- Female Infertility
- Postmenopausal Disorders
- Polycystic Ovary Syndrome
- Osteoporosis
- Gynecology Cancer
- Endometriosis
- Others
- By Route of Administration (Value)
- Oral
- Parenteral
- Topical
- Vaginal
- Others
- By Distribution Channel (Value)
- Retail Pharmacies
- Hospital Pharmacies
- Online Pharmacies
- Others
- By Geography (Value)
- North America
- United States
- Canada
- Mexico
- Europe
- Germany
- United Kingdom
- France
- Italy
- Spain
- Rest of Europe
- Asia-Pacific
- China
- India
- Japan
- South Korea
- Australia
- Rest of Asia-Pacific
- South America
- Brazil
- Argentina
- Rest of South America
- Middle East and Africa
- GCC
- South Africa
- Rest of Middle East and Africa
- North America
Data Sources, Market Sizing, and Validation
Desk Research
Desk work starts with building a clean view of the demand pool and treatment pathways, so the later assumptions sit on real world signals. Public sources such as the World Health Organization, the US CDC, the US FDA drug labels and safety updates, and national health statistics agencies are used to anchor disease prevalence, screening patterns, and treated population trends.
We then cross-check uptake and access indicators using sources such as OECD health data, peer-reviewed journals indexed on PubMed, and relevant medical association guidance pages, followed by company filings, investor presentations, and reputed press for product mix direction. Where needed, paid subscriptions for company financials and intelligence, patent databases, and a news and financials platform are used to track launches, loss of exclusivity, and pipeline to marketed conversions that can shift revenue splits. These are illustrative inputs only, and additional public sources were also reviewed for data collection, validation, and clarification.
Primary Interviews and Surveys
Primary work is used to sanity check the treated patient build, therapy choice shifts, and pricing direction across major regions, and then adjust assumptions that look too optimistic or too conservative. We speak with a mix of clinicians, hospital and retail pharmacy stakeholders, payor-side experts, and manufacturers or distributors, which helps us validate how guidelines, reimbursement, and switching patterns are playing out in practice across APAC, EMEA, and the Americas.
Distribution of primary research fieldwork respondents
| Company type | Respondent position | Region |
|---|---|---|
| Top tier: 38% | CXOs: 13% | APAC: 52% |
| Mid tier: 41% | Functional/Unit leaders: 30% | EMEA: 30% |
| Smaller Players: 21% | Managers: 57% | Americas: 18% |
Market-Sizing & Forecasting
Sizing is first reconstructed using a top-down approach where epidemiology and treatment rates are converted into therapy demand, and then translated into value using observed price bands and typical duration of therapy for key indications. To keep totals practical, results are corroborated with selective bottom-up checks, such as sampled revenue by therapy area from public financial disclosures, channel mix checks from pharmacy stakeholders, and spot ASP x volume approximations in a few high-visibility drug classes.
Inputs used in the model include condition prevalence and diagnosis rates (for example endometriosis, PCOS, infections, menopausal disorders, and gynecologic cancers), treated share and persistence, share split between hormonal and non-hormonal therapy, route of administration shifts, and distribution channel mix between hospital, retail, and online pharmacies. Where direct public data is thin for a country or niche indication, gaps are handled by using region-level analogs and then scaling with healthcare spend, access indicators, and expert-validated uptake ranges.
For forecasting, we use scenario analysis supported by a simple multivariate regression layer for larger regions, so growth is tied to measurable drivers such as population aging, diagnosis expansion, guideline changes, and expected patent events. Pricing progression assumptions are kept transparent, and they are re-checked with primary inputs before finalizing the forecast curve.
Data Validation & Update Cycle
Validation is done through a set of consistency checks so the model does not drift away from observable healthcare and pharma signals. Outputs are compared with independent metrics such as therapy utilization direction, major product lifecycle events, and regional access changes, and then unusual jumps are reviewed to confirm whether they are real or driven by an input error.
Before sign-off, the work goes through multi-step analyst reviews where key assumptions, conversions, and currency handling are rechecked, and follow-up calls are triggered when large variances show up versus interview feedback. Reports are refreshed annually, with interim updates when material events occur, and a final pre-delivery pass is done so clients receive the latest updated view.
Mordor Intelligence's Gynecology Drugs Market Sizing Compared With Other Published Estimates
Published market sizes for gynecology drugs can look far apart, even when they use similar words for the market, because the counting rules are not always the same. Differences usually come from which conditions are included, how hospital versus retail revenues are treated, and whether the base year is updated to reflect the latest therapy switching and pricing.
The table shows a higher 2026 value than some 2024-based figures, and in Mordor Intelligence's model the market is counted as drug revenues across major indications with therapeutics split into hormonal and non-hormonal and with channel coverage spanning hospital, retail, and online, which tends to lift totals versus narrower treated cohorts or earlier-year snapshots. Currency timing, the way price erosion after patent expiry is applied, and how fast emerging Asia Pacific demand is allowed to normalize are also common drivers behind the spread.
Benchmark comparison
| Source | Market Size | Gaps in Research Methodology |
|---|---|---|
| Mordor Intelligence | USD 76.43 B (2026) | |
| Industry Data Provider A | USD 67.51 B (2024) | Uses a 2024 base year and a different forecast window, which can understate later adoption and mix shifts in higher-growth regions, and it may apply more conservative pricing progression assumptions across mature markets. |
| Global Advisory Group B | USD 61.80 B (2024) | Anchors on 2024 valuation and can differ on what is counted within gynecology infections and contraception, and on how online pharmacy sales are allocated, which changes the revenue pool before forecasting is applied. |
Taken together, the benchmark spread is mainly explained by base-year selection and a few scope and allocation choices that impact channel and indication totals. By keeping the inputs tied to treated population logic, channel splits, and clearly stated pricing and lifecycle assumptions, the estimate stays traceable and repeatable when the model is refreshed.


Key Questions Answered in the Report
How large is the gynecology drugs market in 2026?
The gynecology drugs market size reached USD 76.43 billion in 2026 and is projected to hit USD 96.3 billion by 2031.
Which therapeutic class generates most revenue?
Hormonal therapies continued to lead, accounting for 68.07% of 2025 sales.
What is the fastest growing regional market?
Asia-Pacific is forecast to expand at a 6.07% CAGR through 2031 as healthcare access improves.
Which indication is expected to grow the quickest?
Gynecologic oncology is projected to rise at a 5.95% CAGR, underpinned by new antibody-drug conjugates.
How are online pharmacies influencing distribution?
Online pharmacies, growing at a 5.81% CAGR, offer telehealth-enabled dispensing that broadens contraceptive and fertility drug access.
What safety issues affect hormone therapy uptake?
Persistent concerns about venous-thromboembolism and breast-cancer risk, coupled with boxed warnings, continue to limit physician prescribing.
Page last updated on:


 Your data is secure and never sold or shared.


