Market Overview
| Study Period | 2020 - 2031 |
|---|---|
| Forecast Data Period | 2026 - 2031 |
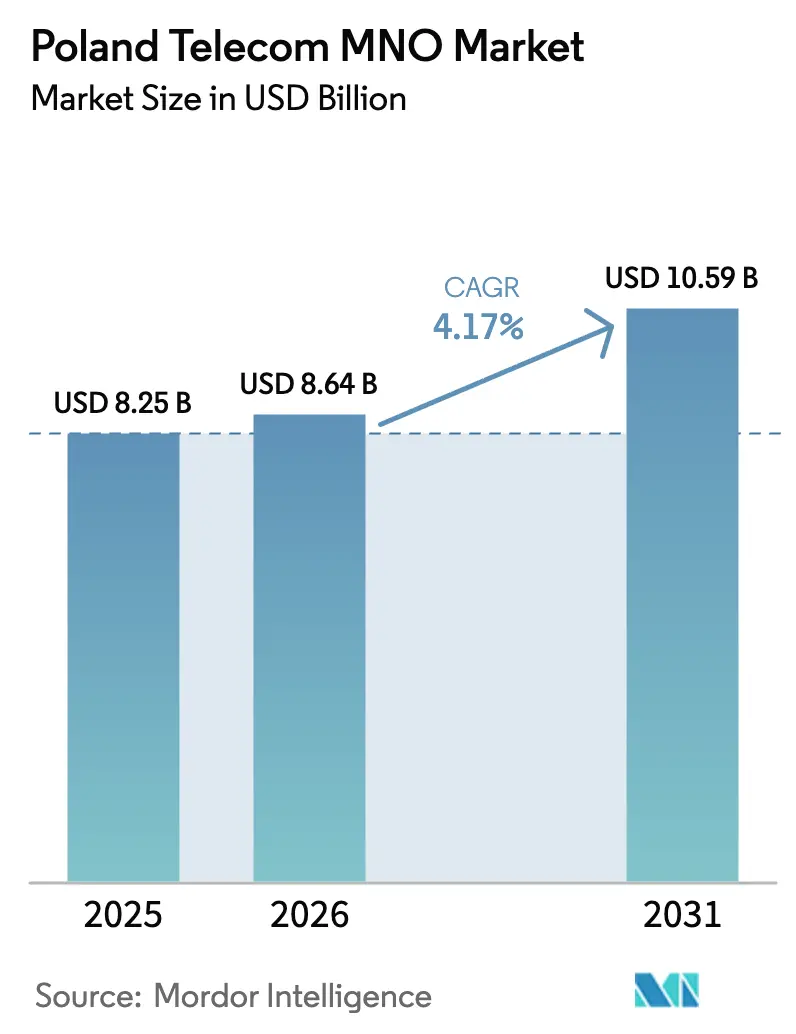
| Base Year Market Size (2025) | USD 8.25 Billion |
| Market Size (2026) | USD 8.64 Billion |
| Market Size (2031) | USD 10.59 Billion |
| Growth Rate (2026 - 2031) | 4.17% CAGR |
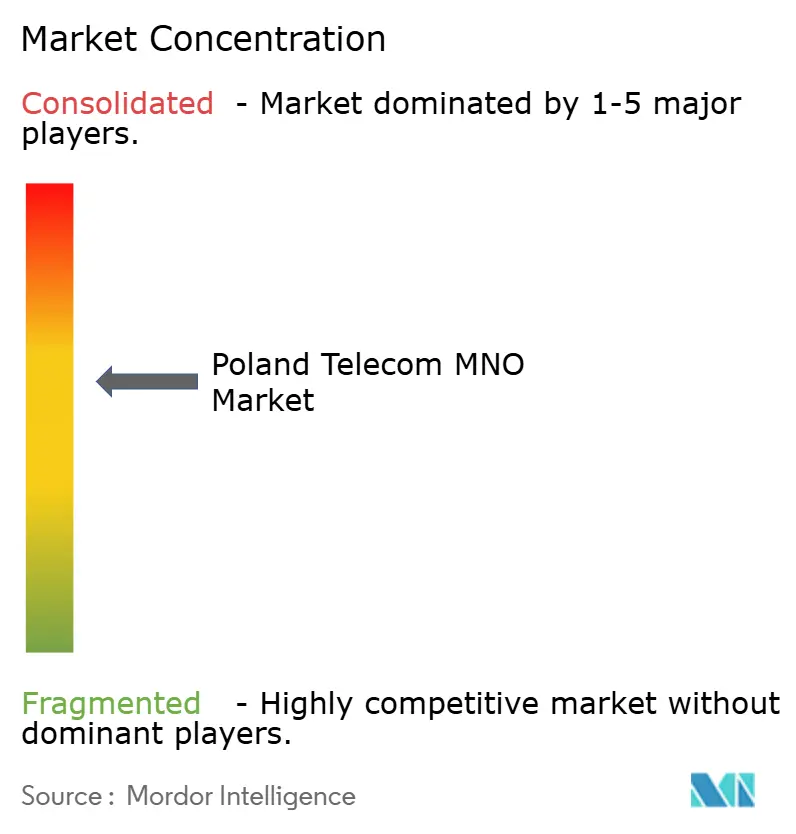
| Market Concentration | Medium |
Major Players *Disclaimer: Major Players sorted in no particular order Image © Mordor Intelligence. Reuse requires attribution under CC BY 4.0. | |
Poland Telecom MNO Market Analysis by Mordor Intelligence
The Poland Telecom MNO Market size is projected to expand from USD 8.25 billion in 2025 and USD 8.64 billion in 2026 to USD 10.59 billion by 2031, registering a CAGR of 4.17% between 2026 to 2031. In terms of subscriber volume, the market was valued at 48.38 million subscribers in 2025 and is expected to grow from 50.22 million in 2026 to 59.56 million by 2031, at a CAGR of 3.47% over the forecast period (2026-2031). This expansion is unfolding in a mature environment where subscriber volumes have peaked, and operators now monetize value-added services, especially 5G data, fiber convergence, and enterprise IoT solutions. A four-player structure keeps competition intense, yet the March 2025 low-band spectrum auction obliges every licensee to deliver 120 Mbps to 99% of households by 2030, sparking fresh rural investment while dense urban areas shift toward millimeter-wave capacity. Bundled quad-play offers, particularly those combining mobile with fiber speeds of 300 Mbps to 900 Mbps, are raising average revenue per offering and reducing churn even as pure mobile ARPU inches upward. Enterprise adoption of private 5G, unified communications, and machine-to-machine links is opening a new, higher-margin layer of demand that cushions the drag from wholesale termination cuts and roaming-cap declines. EU Digital Decade grants, lower policy rates and rising real wages provide macro tailwinds that sustain device upgrades and broadband migration despite fiscal consolidation.
Key Report Takeaways
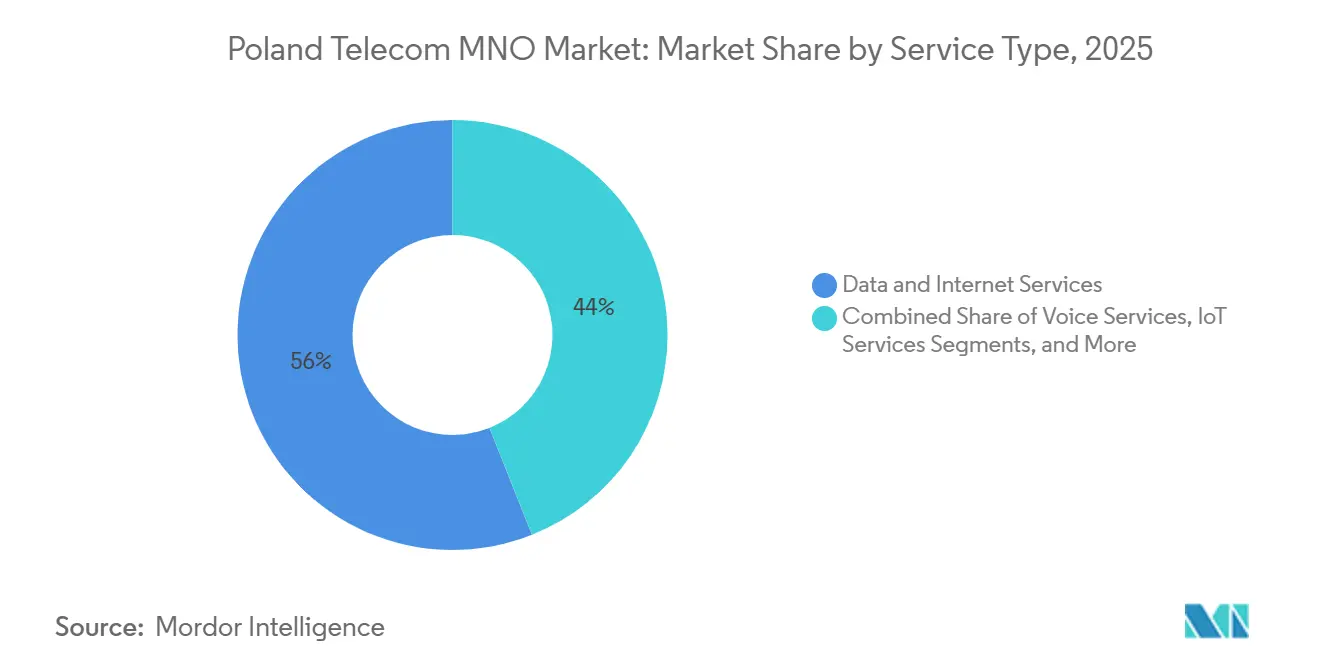
- By service type, Data and Internet Services captured 56.02% of the Poland telecom MNO market share in 2025, while IoT and M2M Services are forecast to accelerate at a 5.43% CAGR through 2031.
- By end-user, consumers generated 72.32% of revenue in 2025, whereas the enterprises segment is projected to expand at a 3.86% CAGR to 2031.
Note: Market size and forecast figures in this report are generated using Mordor Intelligence’s proprietary estimation framework, updated with the latest available data and insights as of January 2026.
Poland Telecom MNO Market Trends and Insights
Drivers Impact Analysis*
| Driver | (~) % Impact on CAGR Forecast | Geographic Relevance | Impact Timeline |
|---|---|---|---|
| 5G Spectrum Auction and Rollout Accelerates Mobile Data Monetisation | +1.2% | National, Warsaw, Krakow, Gdansk, Wroclaw | Medium term (2-4 years) |
| Convergent Quad-Play Bundles Driving ARPU Uplift and Churn Reduction | +0.9% | National, strongest in fiber-ready cities | Short term (≤ 2 years) |
| EU-Funded FTTH Expansion Widens Addressable Fixed-Broadband Base | +0.7% | Eleven underserved provinces | Long term (≥ 4 years) |
| Video-Rich Traffic Surge from Streaming, Gaming and Remote Work | +0.6% | Metropolitan areas | Medium term (2-4 years) |
| Private-5G Pilots in Katowice SEZ and Ports Unlock Enterprise Revenue | +0.3% | Katowice SEZ, Gdansk, Gdynia | Long term (≥ 4 years) |
| mObywatel e-ID Push Boosts Demand for Secure Connectivity Services | +0.2% | National | Medium term (2-4 years) |
| Source: Mordor Intelligence | |||
5G Spectrum Auction and Rollout Accelerates Mobile Data Monetisation
The March 2025 auction allocated 700 MHz and 800 MHz licenses that run until 2040, raising PLN 2.5 billion for the state and imposing strict obligations on Orange, Play, T-Mobile, and Polkomtel to reach 99% of households at 120 Mbps. Those low-band blocks complement the mid-band 3.6 GHz grids already in place, creating a coverage-capacity-hotspot triad that mirrors Western European playbooks. Operators are now packaging 5G fixed-wireless access at PLN 80 per month to households beyond fiber, giving them a fresh revenue path while refarming 2G and 3G airwaves to meet soaring data loads. Longer term, open-API programs such as GSMA Open Gateway allow Polish MNOs to commercialize fraud-prevention, latency, and quality-on-demand features.[1]GSMA, “Mobile Economy Europe 2025,” gsma.com
Convergent Quad-Play Bundles Driving ARPU Uplift and Churn Reduction
Orange grew convergent customers 4.9% year on year to 1.79 million in Q1 2025, each generating PLN 126.2 in average monthly revenue, quadruple the handset figure. Polkomtel counts over 2.5 million multi-play subscribers whose annual churn is several hundred basis points lower than mobile-only peers. T-Mobile added 98,000 broadband lines in nine months thanks to its MagentaOne pack, proving that single-invoice simplicity trumps the gigabyte race. The national regulator tallied 14.1 million bundle users in 2024, giving all four operators headroom to convert legacy cable and satellite customers to IPTV-over-fiber offerings.
EU-Funded FTTH Expansion Widens Addressable Fixed-Broadband Base
L22: A EUR 450 million Digital Poland package and a EUR 131 million InvestEU facility are underwriting neutral-host fiber rolls that aim to reach 1.1 million additional homes, mostly in east and southeast Poland. Orange already passes 9.16 million homes, and Play’s InfraVia venture targets another 6 million at lower construction cost than dense Warsaw ducts. Deregulation proposals that would lift local-loop mandates from the incumbent could further pivot the market toward facilities-based rivalry. For MNOs, the upside spans wholesale rentals, gigabit broadband sales and, critically, higher-margin quad-play conversions.
Video-Rich Traffic Surge from Streaming, Gaming and Remote Work
L23: Arthur D. Little expects average European mobile data usage to soar from 16 GB per month in 2023 to 76 GB by 2030.[2]Arthur D. Little, “Mobile and Fixed Data Traffic Projections,” adlittle.com Orange’s subs already pull 11.7 GB monthly and VoLTE now carries 80% of calls on T-Mobile, freeing spectral blocks for pure data. Tele-medicine, e-prescriptions and remote work are entrenching video reliance, while smartphone adoption among seniors pushes subscription penetration closer to Western levels. Operators respond with densification; Play built 805 new 5G sites in 2024, and tiered fiber upgrades that sell 900 Mbps boosts for PLN 20.
Restraints Impact Analysis*
| Restraint | (~) % Impact on CAGR Forecast | Geographic Relevance | Impact Timeline |
|---|---|---|---|
| EU-Mandated MTR and Roaming Caps Squeeze Operator Margins | -0.8% | National, EU-aligned | Short term (≤ 2 years) |
| Fierce Price Competition Keeps Retail ARPUs under Pressure | -0.6% | National, prepaid and entry postpaid | Short term (≤ 2 years) |
| Energy-Price Volatility Raises Network Opex for 5G Densification | -0.3% | National | Medium term (2-4 years) |
| Slow 700 MHz Clearance Delays Rural Coverage Obligations | -0.2% | Rural and semi-rural | Medium term (2-4 years) |
| Source: Mordor Intelligence | |||
EU-Mandated MTR and Roaming Caps Squeeze Operator Margins
Wholesale roaming ceilings will fall from EUR 1.30 per GB in 2025 to EUR 1.00 in 2027, while symmetrical mobile-termination rates keep sliding under EU rulings. Deutsche Telekom flags these cuts as a direct drag on Poland service revenue.[3]Deutsche Telekom, “Annual Report 2024,” telekom.com Lower inbound roaming income particularly hurts a market traversed by German, Czech and Baltic travelers, and cost-oriented scrutiny on national roaming deals trims wholesale spreads for infrastructure-heavy incumbents. Operators answer by chasing higher-margin enterprise slices, as Polkomtel’s PLN 1,504 B2B ARPU exemplifies.
Fierce Price Competition Keeps Retail ARPUs under Pressure
T-Mobile’s June 2025 move to a PLN 75 unlimited plan with free 300 Mbps fiber upended tiered pricing overnight and forced rivals to simplify offers or cede port-out flows. Play led portability for ten straight quarters but still posted only PLN 32.7 mobile ARPU in Q4 2024. Orange’s handset ARPO sits below PLN 30, and SIM-only propositions cap the upside even as data usage explodes. With headline inflation easing to 2.6% in 2026, consumers remain price-sensitive, making data-driven upsell rather than tariff hikes the main lever.
*Our forecasts treat driver/restraint impacts as directional, not additive. The impact forecasts reflect baseline growth, mix effects, and variable interactions.
Segment Analysis
By Service Type: Data Dominates While IoT Gains Enterprise Traction
Data and Internet Services held 56.02% of Poland telecom MNO market share in 2025, underscoring the pivot from voice-centric revenue to pure broadband. The Poland telecom MNO market size attributed to this category is on track to widen in lockstep with mid-band 5G densification, fixed-wireless substitution and widespread VoLTE adoption. Operators continue to repurpose 2G and 3G spectrum for next-generation data, while fiber backhaul further boosts mobile throughput. Over-the-top messaging has hollowed out SMS income, rendering Messaging Services a minor slice whose relevance now lies in two-factor authentication for e-government and banking.
IoT and M2M Services post the fastest 5.43% CAGR through 2031, driven by private 5G networks in Katowice SEZ, Baltic ports and national rail corridors. The Poland telecom MNO market size for IoT remains modest today, yet the enterprise deals command premium SLAs that far exceed consumer ARPU. Deployment of 5G RedCap chips opens mid-tier wearables and video surveillance opportunities, bridging the gap between narrowband IoT and full-fledged URLLC use cases. Meanwhile, OTT and PayTV remains relevant because bundled IPTV stabilizes churn even as standalone streaming erodes linear channels. Commodity Voice Services keep shrinking as minutes migrate to data-borne apps, freeing low-band airwaves for capacity expansion.


By End-User: Consumers Lead, Enterprises Lift Margins
Consumers produced 72.32% of Poland telecom MNO market revenue in 2025, reflecting near-universal handset ownership and growing smartphone data appetites. Unlimited-data offers, handset installment plans and fiber-linked TV packages keep volumes high, but price rivalry restrains average returns. Operators thus push quad-play bundles that raise switching costs and elevate average revenue per offering almost fourfold versus mobile-only.
Enterprises, government bodies and large institutions are the fastest-growing cohort at a 3.86% annual clip. Although their slice of Poland telecom MNO market size is smaller, the margin differential is substantial, with Polkomtel reporting PLN 1,504 per-account revenue, nearly 20 times consumer handset ARPU. Demand concentrates on private 5G, edge compute, secure identity APIs and unified communications. Public-sector digital-ID programs and railway FRMCS trials add a B2G dimension that is relatively immune to price-led churn. As fixed-mobile convergence and spectrum-based service-level guarantees mature, the enterprise line of business will shape network-slicing strategies and influence where incremental capex lands.

Geography Analysis
The Poland telecom MNO market shows stark urban-rural differences. Warsaw, Krakow, Wroclaw, Gdansk and Poznan host roughly 30% of the population yet receive most mid-band 5G nodes and fiber strands. Orange’s C-band grid covers 40% of citizens primarily in these cities, while Play’s 805 new sites in 2024 lifted its 5G reach to 77% of inhabitants. EU funds totalling EUR 450 million steer wholesale fiber into eleven underserved provinces such as Lubelskie and Podkarpackie, narrowing the divide but stretching operator payback timelines.
L33: Industrial clusters bolster regional demand. Katowice SEZ, the Gdansk-Gdynia port axis and Silesian auto corridors anchor private 5G pilots that bundle connectivity with low-latency edge compute. The PKP FRMCS pilot validates public 5G SA for mission-critical rail signaling over Warsaw-Krakow and Warsaw-Gdansk tracks, giving MNOs a template to pursue other transport authorities.[4]Ericsson, “Private 5G and FRMCS Trials in Poland,” ericsson.com UKE’s spectrum set-asides for 3.8-4.2 GHz local use empower enterprises such as Comarch to self-deploy, forcing national operators to pitch managed-service overlays rather than raw bandwidth.
Mid-sized cities between 100,000 and 500,000 residents provide the sweetest economics for fiber. Play’s Elsat pickup adds 700,000 passings mainly in such locales, while Orange leverages pre-existing ducts to hit 54% broadband penetration on fiber. OECD data highlight a three-fold GDP per capita spread across voivodeships, which echoes in broadband adoption and premium-tier take-up. National plans to reach 100 Mbps everywhere by 2025 and gigabit service by 2030 place coverage obligations on low-band holdings and motivate operators to spread costs through wholesale and subsidy channels.
Competitive Landscape
Orange Polska, Play Communications, T-Mobile Polska and Polkomtel share a mature arena where SIM penetration already exceeds 127%. Orange commands 18.6 million SIMs plus the largest fiber footprint, yet its 2024 revenue slipped 1.8%, showing that efficiency gains only partly offset legacy erosion. Play leads portability and invests heavily in 5G, adding 12,426 base stations and financing rollout via PLN 700 million green bonds. T-Mobile grows convergence fastest, with broadband lines up 41.1% year on year, aided by Deutsche Telekom capital and a strategic one-tariff play. Polkomtel leverages Netia fiber and targets enterprise private 5G to claw higher ARPU, already serving 44% of its B2C base with bundles.
White-space opportunities cluster around EU-funded rural fiber, industrial private 5G contracts and monetized network APIs. Early 5G standalone rollouts could secure a lead, given that only 15% of European peers had gone SA by Q3 2024, according to GSMA. UKE’s intent to lift wholesale duties from Orange may tilt the field toward facilities-based competition, nudging rivals to accelerate their own fiber and tower builds.
Retail price wars are unlikely to abate after T-Mobile’s PLN 75 plan, so operators depend on service differentiation. Orange trials Real Time Text for accessibility compliance, Play pushes sustainability-linked bonds, and Polkomtel courts logistics and manufacturing clients with Ericsson-backed standalone slices. The market remains moderately concentrated, yet none of the four exceeds a third of subscribers, creating persistent incentive to undercut or bundle rather than collude.
Poland Telecom MNO Industry Leaders
Orange Polska SA
Play Communications S.A
T-Mobile Polska S.A.
Polkomtel Sp. z o.o.
- *Disclaimer: Major Players sorted in no particular order

Recent Industry Developments
- November 2025: Orange Polska introduced Real Time Text across VoLTE, meeting EU accessibility rules while augmenting its voice proposition.
- November 2025: Orange Polska opened labor talks for a 2026-2027 social pact amid tight labor conditions.
- October 2025: Polkomtel, Ericsson and GlobalLogic switched on a private 5G pilot in Krakow geared toward industrial automation.
- September 2025: UKE signaled plans to lift Orange’s remaining local-loop and bitstream obligations, pivoting regulation toward infrastructure competition.


Research Methodology Framework and Report Scope
Market Definitions and Key Coverage
Our study defines the Poland telecom market as every zloty of revenue that licensed operators earn from fixed and mobile network voice, messaging, data, pay-TV, and managed IoT services supplied to consumers and enterprises during a calendar year. Infrastructure leasing is included when the lease directly enables service delivery.
Scope exclusion: Device sales, satellite broadcast capacity, and pure data-center hosting fees are not counted.
Segmentation Overview
- Overall Telecom Revenue and ARPU
- Service Type
- Voice Services
- Data and Internet Services
- Messaging Services
- IoT and M2M Services
- OTT and PayTV Services
- Other Services (VAS, Roaming and International Services, Enterprise and Wholesale Services, etc.)
- End-User
- Enterprises
- Consumer
Detailed Research Methodology and Data Validation
Primary Research
We spoke with network planners, wholesale managers, consumer-rights groups, and policymakers across Central Europe. Their insights clarified fiber build targets, realistic 5G adoption curves, and the seasonality of promotional pricing, closing gaps that desk sources leave open.
Desk Research
Mordor analysts first gathered baseline volumes and revenues from the Office of Electronic Communications, Eurostat telecom dashboards, ITU databooks, and the OECD Broadband Portal. We then overlaid operator 10-K equivalents, quarterly presentations, and news captured via Dow Jones Factiva and D&B Hoovers to map ARPU drift and rollout timelines. Patent trends from Questel and shipment clues in Volza helped sense infrastructure demand and supplier health. The sources named are illustrative; many additional public and paid repositories informed our desk work.
A reconciliation pass aligned subscriber and traffic series so that inflection points seen in regulator files matched operator disclosures, giving us a coherent historic spine.
Market-Sizing & Forecasting
A top-down service-income reconstruction, built from regulator revenue tables, anchors the model, which is then checked against sampled ASP × subscriber estimates. Key variables like SIM penetration, household fiber coverage, average data per SIM, spectrum-fee inflation, and IoT connection ramp feed a multivariate regression for 2025-2030. Selective bottom-up operator roll-ups adjust totals where disclosure detail allows.
Data Validation & Update Cycle
Outputs clear two analyst reviews; variance flags trigger fresh source checks, and divergences above five percent restart the loop. Models refresh annually, with mid-cycle updates after major spectrum auctions or tariff shocks, ensuring clients always receive the latest view.
Why Mordor's Poland Telecom Baseline Earns Trust
Published market values often diverge because firms widen scopes, apply blanket ARPU mark-ups, or freeze inputs for years before updating.
Benchmark comparison
| Market Size | Anonymized source | Primary gap driver |
|---|---|---|
| USD 8.44 B (2025) | Mordor Intelligence | - |
| USD 12 B (2024) | Global Consultancy A | Bundles adjacent ICT and device revenue, inflating base |
| €8.2 B (2023) | Industry Data Portal B | Omits OTT and tower leasing; relies on historic ratios |
The comparison shows that by locking scope to operator service income, refreshing volumes every twelve months, and validating each assumption through interviews, Mordor Intelligence delivers a balanced, transparent baseline that decision-makers can trace and replicate.


Key Questions Answered in the Report
What is the current value of the Poland telecom MNO market?
The sector generated USD 8.64 billion in 2026.
How fast will the market grow through 2031?
L41: Revenue is projected to rise at a 4.17% CAGR to USD 10.59 billion by 2031.
Which service type earns the largest revenue share?
Data and Internet Services supplied 56.02% of 2025 turnover.
Why are enterprises critical to operator strategy?
B2B accounts pay ARPU levels up to 20 times higher than consumer handset plans.
How does spectrum policy influence rural coverage?
700 MHz licenses compel all four MNOs to deliver 120 Mbps to 99% of households by 2030.
What new pricing model disrupted competition in 2025?
T-Mobile launched a single PLN 75 unlimited mobile plan bundled with 300 Mbps fiber at no extra fee.
Page last updated on:


