Market Overview
| Study Period | 2020 - 2031 |
|---|---|
| Forecast Data Period | 2026 - 2031 |
| Historical Data Period | 2020 - 2024 |
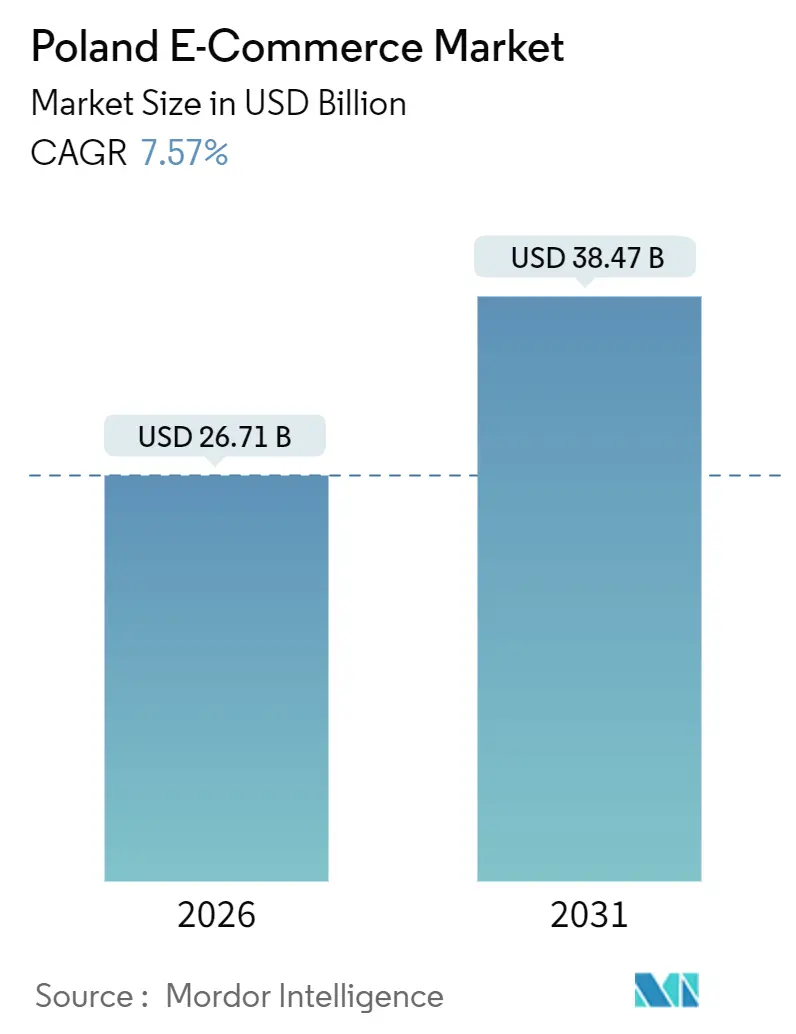
| Market Size (2026) | USD 26.71 Billion |
| Market Size (2031) | USD 38.47 Billion |
| Growth Rate (2026 - 2031) | 7.57% CAGR |
| Market Concentration | Medium |
Major Players *Disclaimer: Major Players sorted in no particular order Image © Mordor Intelligence. Reuse requires attribution under CC BY 4.0. | |
Poland E-Commerce Market Analysis by Mordor Intelligence
The Poland e-commerce market size stood at USD 26.71 billion in 2026 and is projected to reach USD 38.47 billion by 2031, reflecting a 7.57% CAGR through the forecast period. Mobile-first consumption, rising locker density, and unified European regulation are combining to keep the Poland e-commerce market on a durable growth path. Platforms that optimize for one-tap checkout on smartphones are converting traffic more efficiently, while last-mile partnerships between marketplaces and logistics specialists continue to compress delivery windows. Policy alignment with Brussels is forcing larger players to upgrade compliance technology, a cost that pushes smaller rivals toward either acquisition targets or niche positioning. At the same time, consumer-friendly credit regulation is legitimizing buy-now-pay-later, lifting basket sizes, and repeat-purchase frequency. The interplay of these forces underpins both the upside potential and the operational complexity that characterize the Poland e-commerce market today.
Key Report Takeaways
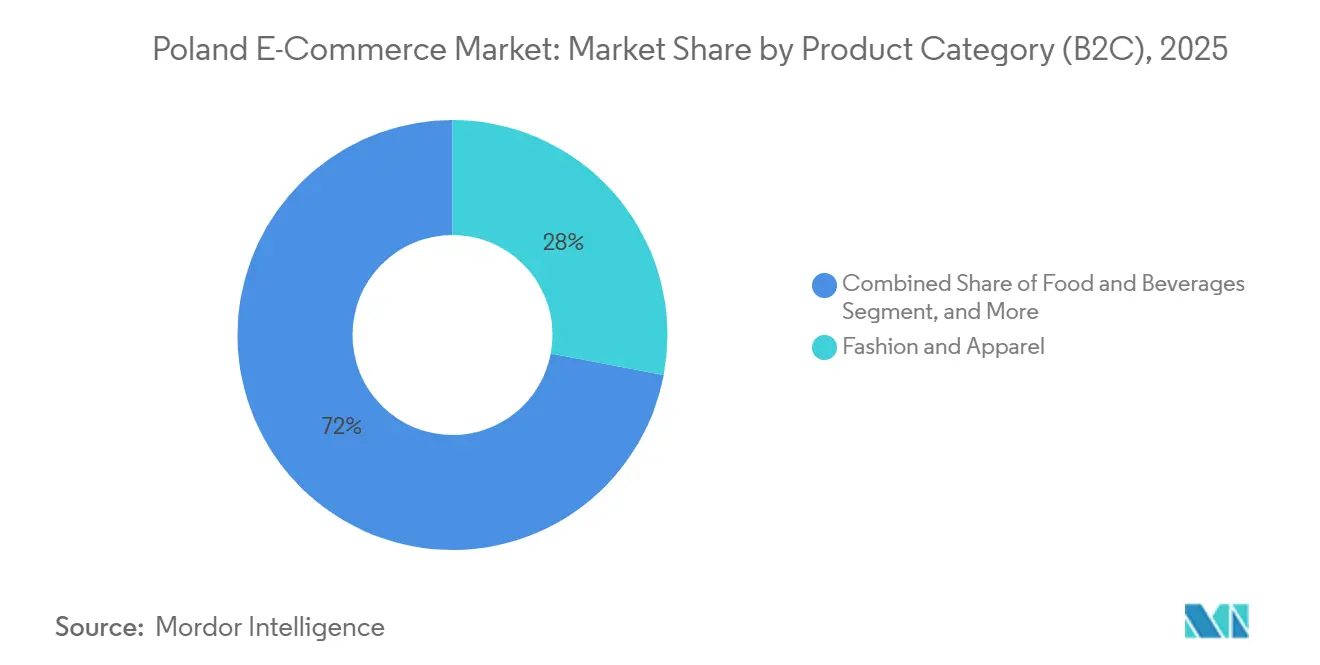
- By product category, fashion and apparel led with a 27.98% revenue share of Poland e-commerce market in 2025, while food and beverages are forecast to expand at an 11.04% CAGR to 2031.
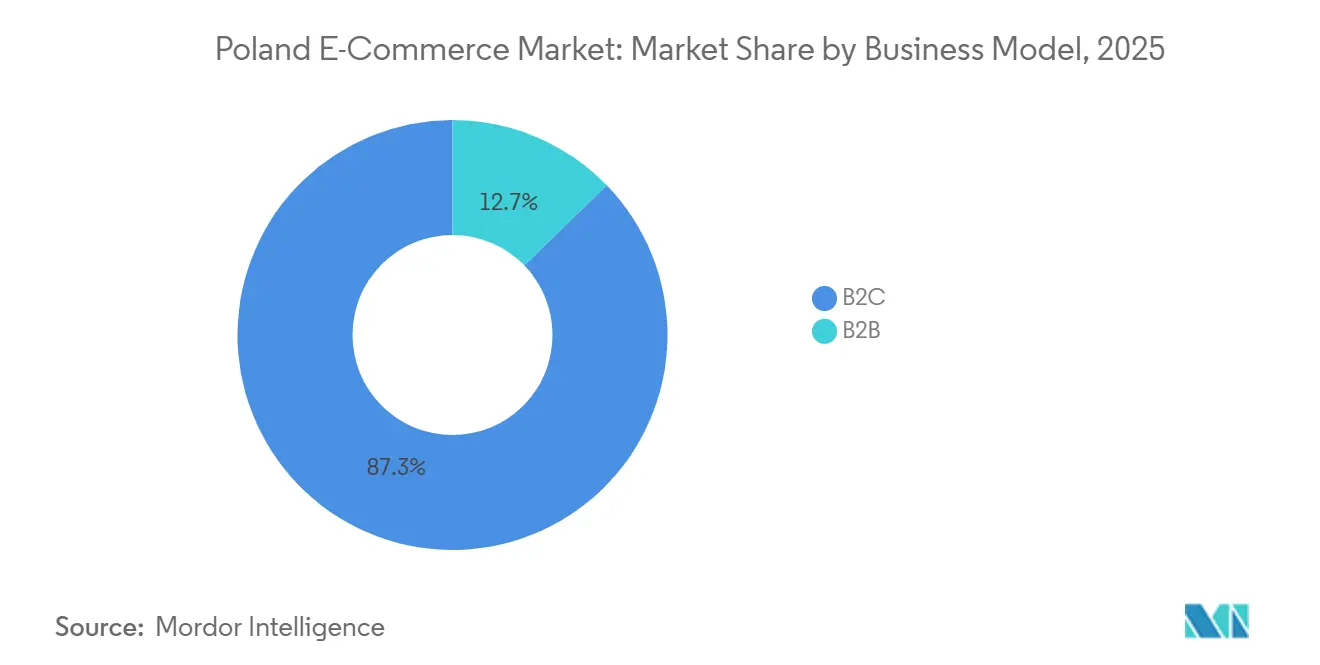
- By business model, the B2C segment held 87.26% of the Poland e-commerce market share in 2025, whereas B2B procurement is projected to grow at a 9.61% CAGR through 2031.
- By device type, smartphones captured 64.67% of Poland e-commerce market in 2025, and this channel is advancing at a 9.28% CAGR through 2031.
- By payment method, cards retained a 36.68% share of the Poland e-commerce market in 2025, yet BNPL is expanding at a 10.93% CAGR through 2031.
Note: Market size and forecast figures in this report are generated using Mordor Intelligence’s proprietary estimation framework, updated with the latest available data and insights as of January 2026.
Poland E-Commerce Market Trends and Insights
Drivers Impact Analysis*
| Driver | (~) % Impact on CAGR Forecast | Geographic Relevance | Impact Timeline |
|---|---|---|---|
| Rising Digital-Literacy and Smartphone Penetration Fuelling M-Commerce | +1.2% | National, high concentration in Warsaw, Kraków, Wrocław, Gdańsk | Medium term (2–4 years) |
| EU and National Grants Accelerating SME Web-store On-boarding | +0.8% | National, strongest in Mazowieckie, Małopolskie, Dolnośląskie | Long term (≥ 4 years) |
| Proliferation of Buy-Now-Pay-Later Improving Checkout Conversion | +1.0% | National, skewed to urban millennials and Gen-Z | Short term (≤ 2 years) |
| Same-Day Last-Mile Networks by InPost and Allegro One Elevating CX | +1.3% | Top five metropolitan areas, spillover to tier-2 cities | Short term (≤ 2 years) |
| EU Digital Services Act Enforcement Raising Compliance Tech Spend | +0.5% | National, affecting very large platforms | Medium term (2–4 years) |
| Growth of Re-commerce Platforms Monetising Circular Economy Demand | +0.6% | National, early traction in Warsaw, Kraków, Trójmiasto | Medium term (2–4 years) |
| Source: Mordor Intelligence | |||
Rising Digital-Literacy and Smartphone Penetration Fuelling M-Commerce
Smartphone adoption reached 86% of adults in 2025, and BLIK counted 14.2 million active users the same year.[1]Polish Payment Standard, “BLIK Payment System Statistics Q3 2024,” polishepaymentstandard.pl The instant-payment system removes card-entry friction, shrinking the historical gap between desktop and mobile conversion rates. Allegro’s 2024 analytics showed mobile conversion now trails desktop by only five percentage points, a delta that is narrowing each quarter. Public investment is amplifying the trend, as the European Social Fund Plus allocated EUR 120 million (USD 131 million) to Polish digital-skills programs in 2024. Older demographics, once digitally hesitant, are now transacting from mid-tier Android handsets, broadening the Poland e-commerce market beyond its millennial core. Platforms that fail to hit sub-three-second mobile load times or maintain single-screen checkout experiences are losing share to app-native rivals.
EU and National Grants Accelerating SME Web-Store On-Boarding
Between 2021 and 2025, EUR 450 million (USD 492 million) flowed to SME digitalization, with another EUR 200 million (USD 219 million) scheduled for 2026-2027 under the Recovery and Resilience Facility.[2]Polish Agency for Enterprise Development, “SME Digitalization Program Report 2024,” parp.gov.pl Subsidies cover up to 70% of start-up costs for payment gateways, inventory software, and marketplace fees. As a result, 18,000 SMEs launched online in 2024, a 34% year-on-year jump, heavily clustered around Warsaw and Kraków innovation hubs. The influx is fragmenting share, creating a long tail of artisan brands that compete through product differentiation rather than speed. Grant-funded vendors often lack scale for next-day fulfillment, giving incumbents with proprietary logistics an advantage in the Poland e-commerce market.
Proliferation of Buy-Now-Pay-Later Improving Checkout Conversion
BNPL transaction value hit EUR 2.54 billion (USD 2.78 billion) in 2024.[3]Eurostat, “E-commerce Statistics for Individuals and Enterprises 2025,” ec.europa.eu Amendments to Poland’s consumer-credit act placed 5% caps on installment fees and mandated real-time bureau checks, legitimizing the product and mitigating over-indebtedness risk. Allegro Pay and Klarna report 8-12 percentage-point improvements in mobile conversion after integrating compliant BNPL modules. Demographically, 62% of users are under 35, and average BNPL baskets run 40% higher than card equivalents. Merchant economics tighten because BNPL discount rates sit at 3-5% versus 1.5-2% for cards, yet the uplift in unit sales keeps the Poland e-commerce market expanding faster than traditional retail.
Same-Day Last-Mile Networks by InPost and Allegro One Elevating CX
InPost operated 24,000 automated lockers by mid-2025 and, together with Allegro One, introduced 12-hour delivery across 15 cities. The service costs PLN 9.99 (USD 2.50), undercutting couriers by roughly 30%. Proprietary locker infrastructure allows full margin capture and 18% higher repeat-purchase frequency among eligible users, according to Allegro’s 2024 investor call. Amazon, lacking similar assets, now covers next-day delivery for a significant portion of households, diluting Prime’s value proposition. Smaller merchants that cannot meet locker packaging standards risk demotion in marketplace search rankings, reinforcing a winner-takes-most pattern inside the Poland e-commerce market.
Restraints Impact Analysis*
| Restraint | (~) % Impact on CAGR Forecast | Geographic Relevance | Impact Timeline |
|---|---|---|---|
| Fragmented Rural Logistics Raising Fulfilment Costs | -0.7% | Rural Warmińsko-Mazurskie, Podlaskie, Lubelskie, Świętokrzyskie | Long term (≥ 4 years) |
| High Product-Return Rates Under Polish Consumer Law | -0.6% | National, acute in fashion, footwear, home-furnishing | Medium term (2–4 years) |
| Limited Cross-Border Payment Interoperability inside CEE | -0.4% | Poland, Czech Republic, Slovakia, Hungary corridors | Medium term (2–4 years) |
| Escalating Courier Wage Inflation Compressing Margins | -0.5% | National, highest in Warsaw, Kraków, Trójmiasto | Short term (≤ 2 years) |
| Source: Mordor Intelligence | |||
Fragmented Rural Logistics Raising Fulfilment Costs
Locker coverage outside voivodeship capitals stands at one unit per 7,500 residents, versus one per 1,200 in Warsaw. Rural deliveries cost PLN 15-20 (USD 3.75-5.00), roughly double urban rates, and suffer a higher failed-delivery incidence.[4]Statistics Poland, “E-commerce and Digital Economy Statistics 2025,” stat.gov.pl InPost plans 3,000 additional lockers by 2027, but utilization in villages runs at 30-40% of city levels, extending payback to over four years. Merchants consequently impose minimum-order thresholds or exclude certain postcodes, limiting penetration in less densely populated areas. Until density improves, the Poland e-commerce market will remain metropolitan-centric.
High Product-Return Rates Under Polish Consumer Law
The EU Consumer Rights Directive grants a 14-day no-fault return window. Fashion return rates exceed 30%, with LPP reporting reverse-logistics costs equal to 5.2% of online revenue in 2024. Refunds must clear within 14 days of receipt, compressing working-capital cycles. Serial wardrobing and bracketing inflate handling expenses, and product depreciation forces markdowns. Pilot investments in virtual try-on are promising but nascent, so returns remain an unavoidable drag on profitability for the Poland e-commerce market.
*Our forecasts treat driver/restraint impacts as directional, not additive. The impact forecasts reflect baseline growth, mix effects, and variable interactions.
Segment Analysis
By Business Model: B2B Procurement Outpacing Consumer Channels
B2C accounted for 87.26% of transaction value in 2025, yet B2B procurement is advancing at a 9.61% CAGR, the fastest among business models. Digitally native purchase portals shorten procurement cycles by up to 40% and integrate electronic invoicing across EU borders. Manufacturing firms moving online to mitigate labor shortages find predictable replenishment advantages that consumer channels cannot match. While customer-acquisition costs rise inside the Poland e-commerce market, the subscription-like cadence of B2B orders creates steadier cash flow. Marketplace operators are adding VAT-compliant modules to capture this growth, including Mercateo’s Polish rollout in 2025. The Polish e-commerce market size for B2B is poised to capture an incremental share of total digital trade through the forecast horizon.
Desktop interfaces still dominate B2B checkouts because buyers prefer multi-tab price comparison and bulk-order management. However, mobile-responsive dashboards are closing gaps, especially among mid-sized enterprises where procurement teams work remotely. Suppliers that integrate punch-out catalogs into ERP systems are experiencing significant improvements in customer retention. As more industrial spend migrates online, the Poland e-commerce market will witness a re-balancing of investment, with platforms dedicating larger technology budgets to enterprise modules rather than consumer-facing flash-sale engines.


By Device Type (B2C): Mobile Commanding Two-Thirds of Consumer Value
Smartphones captured 64.67% of consumer spend in 2025 and are growing at a 9.28% CAGR, the top rate among devices. Allegro devoted 60% of its 2024 tech budget to mobile optimization, including image-based search and personalized push alerts. Desktop purchases still matter for big-ticket electronics and furniture, expanding at a 5.8% CAGR but losing proportional share. Emerging interfaces, such as in-car screens and smart TVs, are nascent but showcase how the Poland e-commerce market will diversify touchpoints. Platforms lagging on responsive design now see search-algorithm penalties, prompting legacy retailers to retrofit sites or cede ground.
The Poland e-commerce market size tied to mobile is expected to surpass USD 25 billion before 2030, a threshold that will make smartphone usability the de facto determinant of conversion. Merchants optimizing assets for sub-three-second load times and biometric authentication will continue to edge out competitors reliant on desktop-centric layouts.
By Payment Method (B2C): BNPL Disrupting Card Dominance
Cards retained a 36.68% share in 2025, yet BNPL is scaling at a 10.93% CAGR, fastest among methods. Digital wallets led by BLIK now account for nearly one in three mobile transactions, benefitting from lower fraud and faster authorization. BNPL usage delivers 40% higher average baskets, compelling merchants to absorb higher merchant discount rates in exchange for volume. Mastercard and Visa have pilot installment products, yet lack the brand equity BNPL specialists hold with Gen-Z buyers. As a result, the Poland e-commerce market share of cards is likely to erode modestly, even while absolute value climbs.
For high-frequency categories, split payments have proven decisive. Allegro Pay processed PLN 3.2 billion (USD 800 million) in the first nine months of 2024, illustrating how embedded finance can deepen walled-garden ecosystems. Payment fragmentation forces merchants to reconcile multiple acquirers, but real-time analytics help optimize routing fees, cushioning margin impact.
By Product Category (B2C): Food Overtaking Fashion in Growth Velocity
Fashion owned 27.98% share in 2025, yet food and beverages is advancing at 11.04% CAGR on the back of Żabka’s autonomous-store network and Carrefour’s two-hour delivery pilots. Electronics, beauty, and furniture are experiencing steady growth, supported by omnichannel research habits. Toys, DIY, and media are growing at a slower pace as international platforms compete aggressively on price. The Poland e-commerce market size attributed to food is expected to surpass significant milestones, highlighting how convenience retail is reshaping online baskets.
Żabka’s Nano kiosks inside office buildings capture impulse demand, lowering the hurdle of minimum-order thresholds. Fashion players now face wallet-share competition from high-frequency grocery purchases. Sellers investing in cross-vertical loyalty programs will fare best, leveraging repeat food trips to cross-sell apparel or electronics, a strategy already piloted by Modivo’s partnership with Allegro Smart.

Geography Analysis
Poland is the largest digital commerce arena in Central and Eastern Europe, with online spend per capita at USD 705 in 2025, ahead of Spain but behind France. Urban centers drive momentum: Warsaw, Kraków, Wrocław, Poznań, and Gdańsk contribute significantly to the national e-commerce performance due to their dense locker grids. The European Union’s Digital Services Act, effective February 2024, standardized compliance across borders, letting Polish platforms compete on equal footing with Western peers. InPost’s 24,000 lockers give domestic players a structural speed advantage, forcing Amazon and Zalando to lease third-party capacity or endure longer delivery windows.
Cross-border trade remains limited because BLIK, CERTIS, and VIAMO are not interoperable. TARGET Instant Payment Settlement harmonizes euro transfers, but Poland’s retention of the złoty keeps merchants juggling multiple acquirers. Currency friction restrains the Poland e-commerce market from fully tapping into the adjacent Czech and Slovak demand. A prospective Digital Euro may resolve this, but its implementation is expected to take considerable time.
Rural Poland lags due to sparse locker coverage and higher courier costs. Government-funded logistics corridors are discussed, yet implementation is slow. Until density rises, urban–rural divergence continues. Nonetheless, incremental locker rollouts in tier-2 cities already shorten delivery promises, nudging penetration upward. Western border regions benefit from German consumer spillover, as lower Polish prices attract cross-channel shoppers, albeit in limited categories such as auto parts and DIY supplies.
Competitive Landscape
The top three domestic champions, including Allegro, InPost, and LPP, significantly influence competitive dynamics. Allegro leverages Allegro Pay to strengthen user engagement within its ecosystem. In 2024, Allegro acquired the Czech marketplace mall.cz, signaling a regional roll-up strategy. InPost, for its part, anchors logistics with an unparalleled locker network and same-day Allegro One coverage, effectively acting as the rails for the Poland e-commerce market.
International entrants pursue assortment breadth or premium positioning. Amazon opened a third fulfillment center slated for 2026 to lift next-day coverage to 85% of households. Zalando deepened local inventory pools to cut return cycles in fashion. Re-commerce specialist Vinted secured EUR 340 million (USD 372 million) Series F funding in January 2025 to scale AI-based authentication, riding the circular-economy wave. These moves illustrate that differentiation now hinges on proprietary technology and adjacent services rather than price alone.
Smaller marketplaces compete in niche verticals such as pet supplies, hobby crafts, or regional foods, but rising compliance costs under the Digital Services Act compress margins. Consolidation is probable, with mid-tier players looking either to be acquired or to integrate into larger ecosystems via white-label storefronts. The Poland e-commerce industry is therefore marching toward a barbell structure of mega-platforms and hyper-focused specialists.
Poland E-Commerce Industry Leaders
Media Expert
Zoo Plus AG
Zalando SE
Empik S.A.
X-Kom Sp. z o.o.
- *Disclaimer: Major Players sorted in no particular order

Recent Industry Developments
- January 2026: InPost began pilot drone delivery tests over suburban Warsaw corridors to evaluate viability for same-day rural coverage.
- November 2025: InPost announced a PLN 500 million (USD 125 million) plan to deploy 3,000 additional lockers in rural areas by 2027.
- September 2025: Allegro bought a 25% stake in WE|DO for PLN 80 million (USD 20 million) to refine urban route optimization.
- July 2025: LPP opened a 100,000-square-meter automated fulfillment center in Brzeg Dolny for PLN 400 million (USD 100 million).


Research Methodology Framework and Report Scope
Market Definitions and Key Coverage
Mordor Intelligence defines Poland's e-commerce market as the gross merchandise value (GMV) generated by business-to-consumer and business-to-business digital storefronts operating within Poland's borders, regardless of seller nationality. Transactions must involve a physical product that is ordered and paid for online and delivered through any fulfillment channel.
Scope exclusion: Purely digital content, business-to-consumer food-delivery aggregators, and classified or C2C listings are not counted.
Segmentation Overview
- By Business Model
- B2C
- B2B
- By Device Type (B2C)
- Smartphone / Mobile
- Desktop and Laptop
- Other Device Types
- By Payment Method (B2C)
- Credit and Debit Cards
- Digital Wallets
- Buy Now Pay Later (BNPL)
- Other Payment Methods
- By Product Category (B2C)
- Beauty and Personal Care
- Consumer Electronics
- Fashion and Apparel
- Food and Beverages
- Furniture and Home
- Toys, DIY and Media
- Other Product Categories
Detailed Research Methodology and Data Validation
Primary Research
We interview Polish marketplace executives, third-party sellers, courier managers, payment-service providers, and industry academics across Warsaw, Kraków, Poznań, and Tri-City. These conversations validate growth drivers, clarify return-rate assumptions, and calibrate price-point shifts that desk research alone cannot detect.
Desk Research
Our analysts first review high-quality public records such as Eurostat retail sales dashboards, Poland's GUS household budget surveys, UKE telecom statistics, and Ecommerce Europe yearbooks, supplemented by trade-association releases and investor filings. Customs import data, parcel-volume disclosures from InPost and Poczta Polska, and smartphone penetration updates from GSMA Intelligence round out the demand and logistics picture. Paid assets including D&B Hoovers and Dow Jones Factiva supply company revenues and deal news that help us benchmark platform scale and spot outliers. The data sources above are illustrative; many additional materials are consulted throughout the study.
Market-Sizing & Forecasting
Top-down reconstruction begins with official retail sales and e-commerce penetration, which are then adjusted for VAT, refunds, and cross-border leakages. Select bottom-up checks, sampled average selling price times parcel counts, and revenue roll-ups from the ten largest platforms anchor the totals. Variables fed into our multivariate regression forecast include smartphone ownership, parcel-locker density, BNPL transaction share, cross-border purchase ratio, disposable-income trajectory, and urban broadband coverage. Where bottom-up inputs are absent, regional proxies are gap-filled and stress-tested against primary interviews before acceptance.
Data Validation & Update Cycle
Outputs pass a three-layer analyst review that flags variance above set thresholds, triggers re-contact with experts if anomalies persist, and documents rationale for every adjustment. The model refreshes annually, with interim updates published when material policy, currency, or logistics shocks occur.
Why Mordor's Poland E-commerce Baseline Commands Confidence
Published estimates often differ because firms mix digital services with goods, convert currencies at varying dates, or overlook high return rates that shrink net GMV.
Key gap drivers include divergent scope, one-off web-traffic extrapolations lacking parcel corroboration, and less frequent data refreshes. Mordor's disciplined top-down and selective bottom-up blend, plus our yearly update cadence, reduce such drift.
Benchmark comparison
| Market Size | Anonymized source | Primary gap driver |
|---|---|---|
| USD 24.76 B (2025) | Mordor Intelligence | - |
| USD 32.98 B (2024) | Regional Consultancy A | Bundles service fees and cross-border flows, inflating base |
| USD 27.97 B (2024) | Industry Database B | Relies on web-traffic extrapolation, omits high return-rate adjustment |
Together, the comparison shows that while other publishers provide useful signals, Mordor's transparent scope choices, multi-source inputs, and rigorous validation offer decision-makers a balanced, dependable starting point for strategy.


Key Questions Answered in the Report
How large is the Poland e-commerce market in 2026?
The Poland e-commerce market size reached USD 26.71 billion in 2026 and is on a 7.57% CAGR trajectory toward USD 38.47 billion by 2031.
Which product category is expanding fastest online in Poland?
Food and beverages is the fastest, advancing at an 11.04% CAGR, outpacing the established fashion segment.
What role does BNPL play in Polish online spending?
BNPL’s transaction value grew to EUR 2.54 billion in 2024 and is recording a 10.93% CAGR through 2031, lifting mobile checkout conversion by up to 12 percentage points.
Why is rural e-commerce penetration lower than urban levels?
Sparse parcel-locker density and higher courier costs add 40-60% to last-mile expenses, discouraging free-shipping offers in rural zones.
Which companies dominate last-mile delivery in Poland?
InPost leads with over 24,000 automated lockers and, together with Allegro One, offers 12-hour delivery in 15 major cities.
Page last updated on:


