
Plasma Fractionation Market Size and Share
Market Overview
| Study Period | 2020 - 2031 |
|---|---|
| Market Size (2026) | USD 42.15 Billion |
| Market Size (2031) | USD 63.06 Billion |
| Growth Rate (2026 - 2031) | 8.40 % |
| Fastest Growing Market | Asia Pacific |
| Largest Market | North America |
| Market Concentration | Medium |
Major Players *Disclaimer: Major Players sorted in no particular order Image © Mordor Intelligence. Reuse requires attribution under CC BY 4.0. | |
Plasma Fractionation Market Analysis by Mordor Intelligence
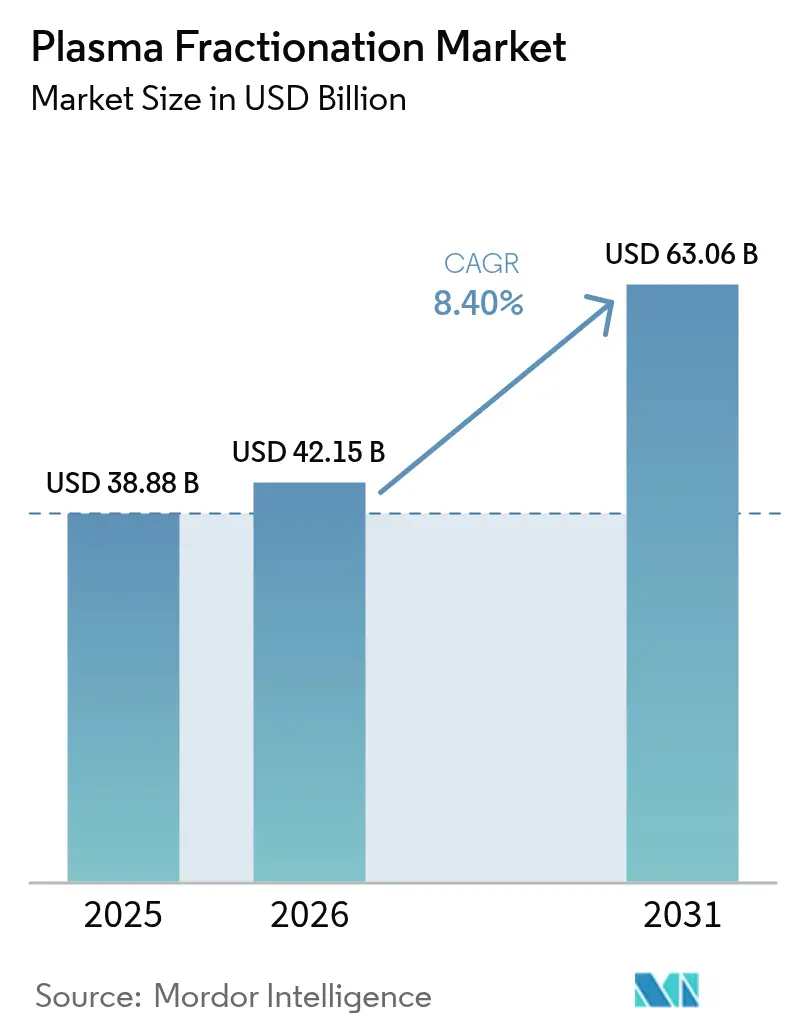
Plasma fractionation market size in 2026 is estimated at USD 42.15 billion, growing from 2025 value of USD 38.88 billion with 2031 projections showing USD 63.06 billion, growing at 8.4% CAGR over 2026-2031. Rising demand for plasma-derived medicinal products in neurology, immunology and critical-care medicine underpins this expansion, while supply security remains a strategic priority for manufacturers. Asia-Pacific is advancing fastest as governments and private operators build domestic plasma collection capacity; at the same time, North America continues to dominate volumes thanks to favorable donor compensation models. Product innovation is accelerating around high-concentration immunoglobulins, next-generation virus-removal filters and automated collection devices, helping companies lower cost per liter and improve manufacturing yields. Competitive intensity is shaped by vertical integration, with leading players operating hundreds of donation centers to secure raw material and cushion supply shocks in the plasma fractionation market.
Key Report Takeaways
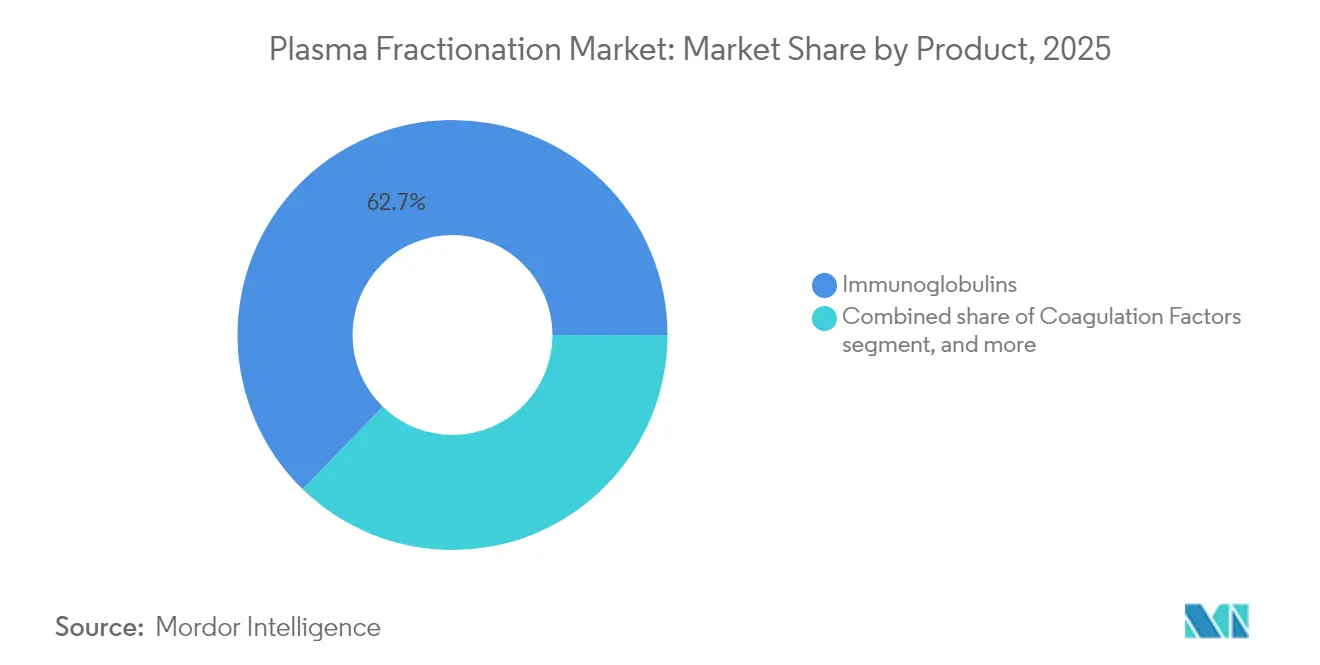
- By product, immunoglobulins led with 62.74% revenue share in 2025; coagulation factors are projected to expand at a 8.97% CAGR to 2031.
- By application, neurology accounted for a 41.66% share in 2025; pulmonology is forecast to expand at a 10.12% CAGR through 2031.
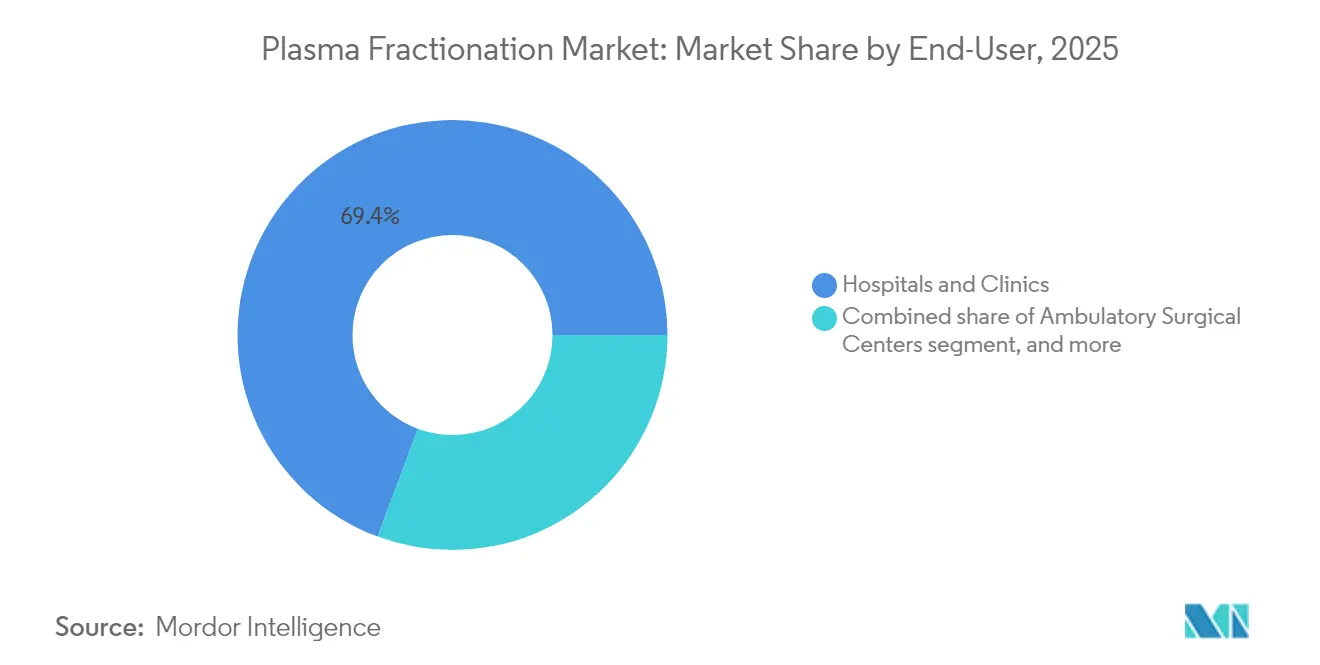
- By end-user, hospitals and clinics held 69.35% share in 2025; other end-users are set to grow at an 10.93% CAGR through 2031.
- By sector, private fractionators commanded 67.41% share in 2025 and are advancing at an 8.18% CAGR through 2031.
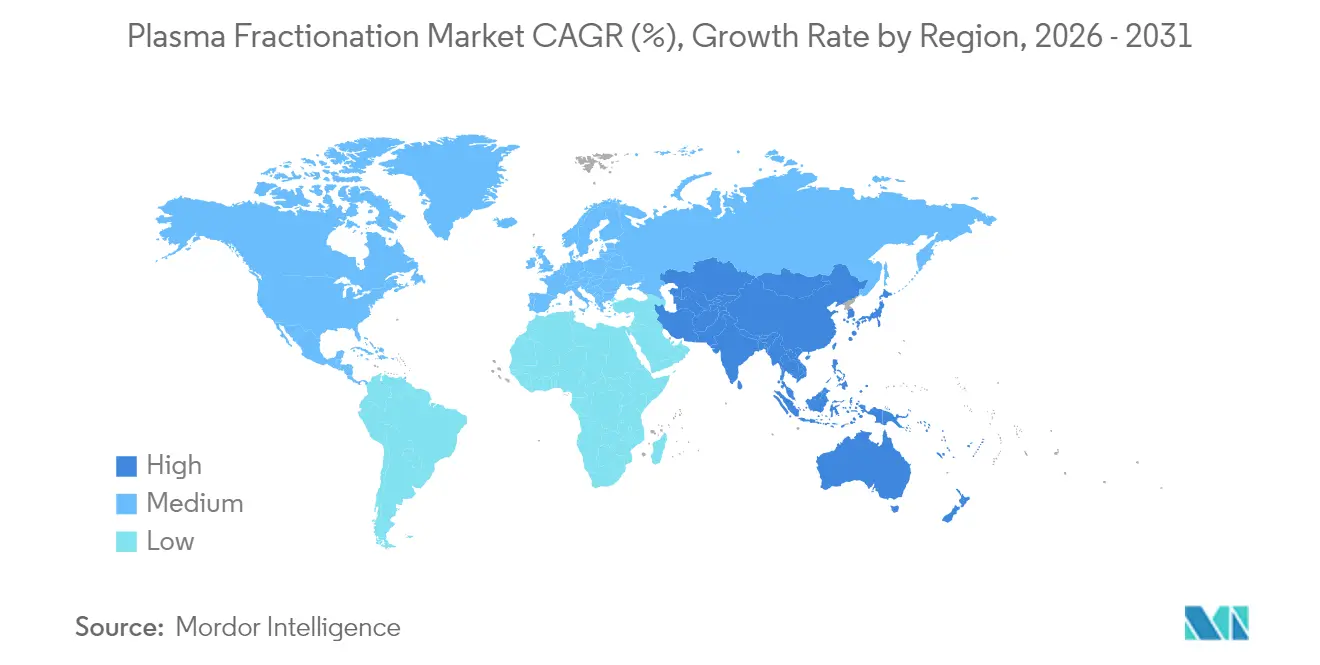
- By geography, North America captured 53.05% share in 2025; Asia-Pacific is projected to register a 9.18% CAGR to 2031.
Note: Market size and forecast figures in this report are generated using Mordor Intelligence’s proprietary estimation framework, updated with the latest available data and insights as of 2026.
Market Trends and Insights
Drivers Impact Analysis of Plasma Fractionation Market*
| Driver | % Impact on CAGR Forecast | Geographic Relevance | Impact Timeline |
|---|---|---|---|
| Expansion of private donor plasma collection centers | +2.1 | North America; emerging Asia-Pacific | Medium term (2-4 years) |
| Rising adoption of subcutaneous immunoglobulin (SCIG) | +1.8 | North America, Europe, Asia-Pacific | Medium term (2-4 years) |
| Increasing utilization of albumin in critical-care management | +1.2 | Asia-Pacific (China, India, Indonesia) | Short term (≤ 2 years) |
| Favourable government funding for hemophilia treatment programs | +0.9 | Global, strongest in developed markets | Medium term (2-4 years) |
| Accelerated regulatory approvals for hyperimmune globulins | +1.0 | Global, priority in North America & Europe | Short term (≤ 2 years) |
| Growth of contract fractionation services in emerging economies | +0.7 | Latin America, Africa, South-East Asia | Long term (≥ 4 years) |
| Source: Mordor Intelligence | |||
Expansion of Private Donor Plasma Collection Centers
Global operators continue to accelerate site roll-outs to secure supply, reshaping the plasma fractionation market. CSL Plasma deployed the RIKA Plasma Donation System in Houston, trimming session times by 15 minutes and improving donor throughput. Canadian Blood Services is opening new centers—including Thunder Bay in early 2025—to increase domestic collections[1]. Emerging economies are following suit; Indonesia’s first fractionation plant in Karawang will process 600,000 liters a year, converting discarded plasma into medicines. These moves collectively ease the raw-material bottleneck as global IG demand grows 8-9% annually. Larger, technology-enabled centers also allow companies to diversify sourcing and mitigate region-specific donor constraints, reinforcing supply resilience across the plasma fractionation market.
Rising Adoption of Subcutaneous Immunoglobulin (SCIG)
Patient preference for home therapy and pressure to lower infusion costs are driving rapid uptake of SCIG. XEMBIFY, the first FDA-cleared 20% SCIG for treatment-naïve primary immunodeficiency patients, offers ≥98% IgG purity and favorable tolerability. HYQVIA pairs 10% IG with recombinant hyaluronidase to achieve 93.3% bioavailability while requiring fewer infusion sites. These high-concentration products, alongside smart infusion pumps, facilitate self-administration and free hospital capacity. Payers view SCIG favorably because it reduces chair time and ancillary costs, supporting broader reimbursement. Consequently, specialty pharmacies and infusion centers are scaling distribution networks, reinforcing a structural shift toward decentralized care within the plasma fractionation market.
Increasing Albumin Utilization in Critical Care
Consensus guidance now recommends human serum albumin for fluid resuscitation in septic shock and perioperative management. Clinical experts in China, India and Indonesia emphasize albumin’s oncotic properties to stabilize hemodynamics and mitigate complications[2]. As healthcare infrastructure improves, Asia-Pacific hospitals are adopting standardized protocols, translating into higher albumin volumes. Local production initiatives, exemplified by Indonesia’s Karawang facility, aim to meet rising demand and reduce import dependence. Short-term growth is further supported by new evidence linking albumin supplementation to lower mortality in complex liver disease, widening its therapeutic scope. These trends collectively lift regional consumption, contributing to sustained expansion of the plasma fractionation market.
Government Funding for Hemophilia Treatment Programs
Public reimbursement schemes are broadening access to prophylactic replacement therapy, stabilizing demand for coagulation factors. Real-world data show comparable annualized bleeding rates between standard half-life and extended half-life products (1.7 vs 1.8 in hemophilia A; 2.1 vs 1.4 in hemophilia B), steering payers toward value-based procurement models. Pilot programs in Europe and Asia now incorporate quality-of-life metrics when allocating budgets, reinforcing steady uptake despite rising recombinant competition. Funding also covers comprehensive care centers that coordinate physiotherapy, psychosocial support and genetic counseling, driving holistic patient management. Such initiatives provide a predictable demand base, enabling manufacturers to optimize production lines and maintain economies of scale within the plasma fractionation market.
Restraints Impact Analysis of Plasma Fractionation Market*
| Restraints Impact Analysis | (~) % Impact on CAGR Forecast | Geographic Relevance | Impact Timeline |
|---|---|---|---|
| Supply constraints due to donor compensation caps | −1.7 | Europe (spillover worldwide) | Short term (≤ 2 years) |
| Competition from long-acting recombinant coagulation factors | −1.3 | North America & Europe; spreading globally | Long term (≥ 4 years) |
| High batch failure rates with chromatography-intensive lines | −1.0 | Global, heightened in older facilities | Medium term (2-4 years) |
| Limited reimbursement for IVIG in low-income Asian countries | −0.8 | South Asia, parts of ASEAN | Short term (≤ 2 years) |
| Source: Mordor Intelligence | |||
Supply Constraints Due to Donor Compensation Caps
Europe’s ethical ceilings on donor payments threaten supply stability, with forecasts pointing to a 4-8 million-liter shortfall by 2025. Imports already cover 40% of European demand, underscoring vulnerability to external shocks. The proposed Substances of Human Origin regulation seeks a balance between donor protection and material sufficiency, but near-term collection gaps persist. Australia, operating on voluntary donation, imported USD 399.2 million worth of immunoglobulin in 2022-23 as domestic volumes lagged 8% annual demand growth[3]. These limitations compel fractionators to diversify sourcing, optimize yield per liter and invest in collection technology—yet they still temper growth projections for the plasma fractionation market.
Competition from Long-Acting Recombinant Coagulation Factors
Extended half-life recombinant factors and emerging gene therapies are redefining hemophilia management economics. Etranacogene dezaparvovec offers the prospect of durable correction with a single infusion, challenging lifetime plasma-derived factor consumption. Non-factor agents such as emicizumab further reduce bleeding episodes with subcutaneous dosing, enhancing adherence and patient convenience. With comparable clinical outcomes and supportive reimbursement in advanced markets, recombinant portfolios erode the addressable pool for plasma-derived coagulation factors. Although legacy products retain a role in inhibitor-positive or resource-constrained settings, competitive intensity weighs on segment profitability and moderates overall growth of the plasma fractionation market.
*Our forecasts treat driver/restraint impacts as directional, not additive. The impact forecasts reflect baseline growth, mix effects, and variable interactions.
Plasma Fractionation Market Segment Analysis
By Product:
Immunoglobulins Retain Leadership, Coagulation Factors AccelerateImmunoglobulins held 62.74% of the plasma fractionation market share in 2025, reflecting their broad therapeutic footprint in immunology and neurology. Launches of high-concentration formulations like Yimmugo are expected to lift segment revenues, with Grifols projecting USD 1 billion in U.S. sales over seven years. The plasma fractionation market benefits from stable double-digit demand for immunoglobulins, underpinned by expanding indications such as chronic inflammatory demyelinating polyneuropathy. At the same time, manufacturing upgrades—most notably Asahi Kasei Medical’s Planova FG1 filter—raise throughput and lower virus breakthrough risk, supporting volume growth.
Coagulation factors, while representing a smaller revenue base, are forecast to expand at a 8.97% CAGR, the fastest among product lines. Extended prophylaxis protocols foster rising per-patient consumption, and new delivery platforms improve adherence. Nevertheless, recombinant alternatives and non-factor therapies introduce pricing pressure. Albumin retains a sizeable share due to its role in critical care, especially across Asia-Pacific where protocol updates recommend early administration in septic shock. Protease inhibitors, centred on alpha-1 antitrypsin, are gaining momentum in pulmonology as standardized pathways for severe deficiency enter clinical practice. Taken together, product diversification and technological advancement continue to define competitive positioning in the plasma fractionation market.

By Application:
Neurology Dominates, Pulmonology Rises QuicklyNeurology applications accounted for 41.66% of 2025 revenues, anchored by intravenous and subcutaneous immunoglobulin use in CIDP and multifocal motor neuropathy. HYQVIA’s 93.3% bioavailability exemplifies modality evolution, offering fewer sites and lower infusion frequency. As disease awareness improves, diagnosis rates climb, further cementing neurology’s primacy in the plasma fractionation market. Growth is reinforced by real-world data demonstrating sustained functional gains and reduced relapse frequency with maintenance dosing.
Pulmonology marks the fastest-growing segment, slated to post a 10.12% CAGR to 2031. Alpha-1 antitrypsin replacement therapy drives this surge, with European consensus guidelines streamlining patient selection and dosing. Research linking arterial stiffness to cardiovascular risk in deficiency patients underscores wider systemic benefits, potentially unlocking new reimbursement pathways. Immunology remains a core indication set, while hematology confronts recombinant competition. Critical-care adoption of albumin in trauma and surgical contexts bolsters cross-department utilization, broadening application diversity. Collectively, these dynamics ensure the plasma fractionation market stays responsive to shifting clinical priorities.
By End-User:
Hospitals Command Volumes, Alternative Sites GrowHospitals and clinics captured 69.35% of global revenues in 2025, reflecting their central role in administering intravenous therapies and managing acute indications. Complex infusion protocols, adverse-event monitoring and reimbursement pathways keep hospital pharmacies at the heart of the plasma fractionation market. As hospitals adopt integrated care pathways, utilization rates of albumin and coagulation factors rise, sustaining volume leadership. Investments in automated blood-component processors, including the Reveos system, enable transfusion services to cut processing steps by 65% and free resources for higher-value activities.
The “other end-users” category—which encompasses home care, specialty pharmacies and infusion suites—is projected to grow at 10.93% CAGR, powered by SCIG adoption and payer encouragement of home-based models. Improved training programs and remote monitoring technologies, such as connected pumps, enhance safety and adherence. Ambulatory surgical centers represent a niche yet expanding destination for albumin use in hemodynamic stabilization. Blood banks and plasma collection centers, while upstream, influence downstream availability by securing the raw material that sustains the plasma fractionation market.
By Sector:
Private Fractionators Drive Scale and InnovationPrivate players commanded 67.41% of 2025 revenues and exhibit the fastest growth trajectory at 8.18% CAGR. Octapharma’s plan to lift production capacity by 50% before 2028 typifies aggressive expansion strategies. These firms leverage flexible capital allocation, advanced IT infrastructure and global sourcing networks to optimize cost per liter and maintain quality. Vertically integrated models spanning donation through final fill-and-finish help private operators manage margins amid pricing pressure, securing competitive advantage in the plasma fractionation market.
Public fractionators remain pivotal in regions prioritizing self-sufficiency, albeit with more conservative investment horizons. Collaborations—such as Indonesia’s joint venture between the national sovereign wealth fund and SK Plasma—illustrate hybrid models that blend state oversight with private technological expertise. Technology-transfer agreements and contract manufacturing bolster public capacity without duplicating expensive R&D pipelines. Over the forecast period, blended ecosystems of private and public entities will continue to evolve, balancing access, affordability and strategic autonomy across the plasma fractionation market.
Geography Analysis
North America Plasma Fractionation Market
North America remains the epicenter of the plasma fractionation market, holding 53.05% of revenue in 2025. The United States alone accounts for 70% of global source plasma, supported by donor compensation that sustains a dense network of nearly 1,200 centers. The Congressional Plasma Caucus spotlights bipartisan support for uninterrupted immunoglobulin access, while technological upgrades like CSL’s RIKA system shorten donation times and improve throughput. Advanced regulatory processes facilitate rapid approval of next-generation filters and formulations, reinforcing the region’s supply chain robustness.
APAC Plasma Fractionation Market
Asia-Pacific represents the fastest-growing arena, anticipated to record a 9.18% CAGR to 2031. Governments in Indonesia, China and India are investing in domestic fractionation plants to reduce reliance on imports. Indonesia’s Karawang facility will convert 600,000 liters annually into high-value products, exemplifying a shift toward self-sufficiency. Nonetheless, supply imbalances persist: Australia imported USD 399.2 million worth of immunoglobulin in 2022-23, with demand growing 8% each year. Strategic transactions, such as CSL’s divestiture of its Wuhan plasma portfolio to Rongsheng Pharmaceutical for USD 185 million, realign footprints for better local market fit.
EMEA and LATAM Plasma Fractionation Market
Europe faces structural headwinds from donor compensation caps, leading to 40% dependence on U.S. plasma. Proposed SoHO regulations aim to boost donor retention while preserving ethical standards, yet near-term scarcity remains a reality. Manufacturing expertise and established distribution channels temper risk, but capacity utilization hinges on raw material flows. Latin America, the Middle East and Africa collectively contribute a modest share today, yet rising healthcare expenditure and wider insurance coverage are opening access to plasma-derived therapies. Long-term upside lies in infrastructure investment and public-private partnerships, gradually enlarging regional slices of the plasma fractionation market.
Mordor Intelligence provides coverage of the plasma fractionation market across other key regional markets. Detailed country-level analysis extends to India incorporating local coverage and market participation, as required.
Regulatory Landscape
Regulation of plasma-derived medicinal products continues to tighten around donor safety, traceability, and quality management of source plasma. In the EU, the European Medicines Agency (EMA) retains Plasma Master File (PMF) certification as a key control for products supplied into the market. During 2026, EMA PMF lifecycle activity remained active for major fractionators via annual update re-certifications and variations, including PMF updates processed for CSL Behring and Takeda, and a Type IB PMF variation for Grifols. This reinforces the expectation of ongoing epidemiological surveillance, validated manufacturing controls, and documented change management across collection and fractionation.
In Europe, the Substances of Human Origin framework was strengthened with Regulation (EU) 2024/1938 (adopted June 2024), which treats plasma for fractionation as a critical SoHO and drives member-state actions aimed at adequacy and self-sufficiency while preserving ethical safeguards. Standards-setting also progressed globally: at the WHO Expert Committee on Biological Standardization (ECBS) meeting in April 2026, new and replacement international reference standards were established for blood coagulation factors, supporting more consistent potency and quality control testing of plasma-derived coagulation products across markets and manufacturers.
Competitive Landscape
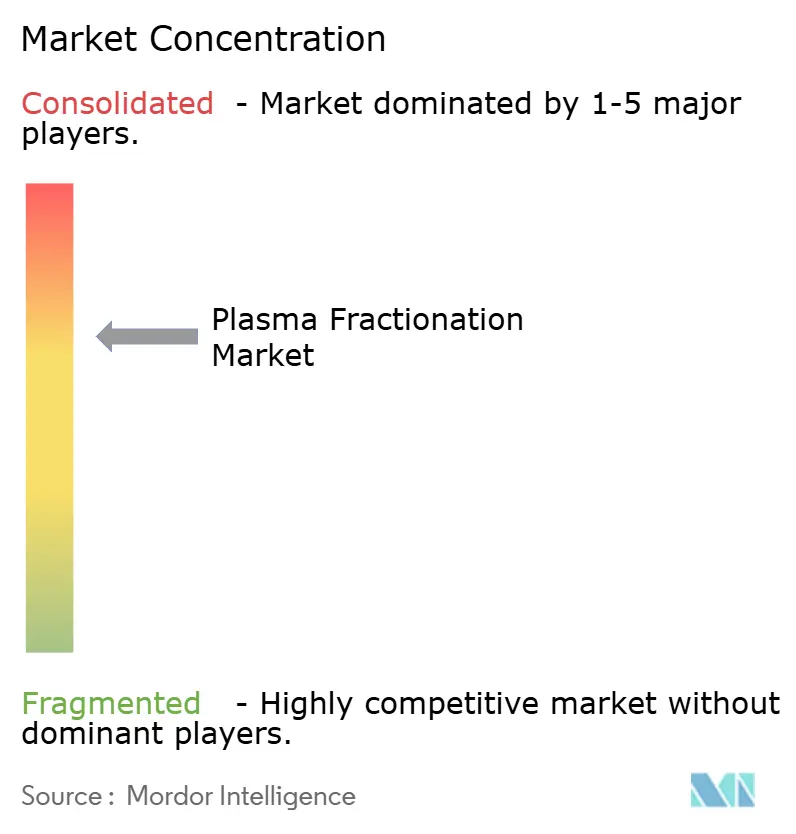
The plasma fractionation market is moderately concentrated: CSL Behring, Grifols and Takeda control an estimated 70% of global capacity, leveraging vertically integrated operations to secure raw material and maintain quality leadership. Cost-efficient sourcing is central; CSL operates approximately 350 donation centers worldwide, while Grifols’ Operational Improvement Plan reduced cost per liter by 22% in 2024. Takeda’s dual supply-chain hubs in the U.S. and Europe provide geographic redundancy, enabling agile response to regional demand spikes.
Innovation differentiates competitors. Asahi Kasei Medical’s Planova FG1 filter delivers seven-fold higher flux, slashing virus-filtration bottlenecks and trimming batch cycles. Grifols advanced ESG scoring to 70 in the 2024 Corporate Sustainability Assessment, appealing to ethically inclined institutional investors. CSL’s Program REACH modernizes donor engagement with mobile scheduling and loyalty analytics, boosting repeat donations and data accuracy.
Governance reforms signal strategic evolution. Grifols separated management from family ownership in 2024, appointing Nacho Abia as CEO to sharpen operational focus and investor communication. Regional challengers are emerging: Kedrion opened a production hub in Bolognana, Italy, to scale hyperimmune globulin output, while Australian start-up Aegros is raising USD 20 million to commercialize high-yield fractionation technology. These developments hint at gradual dilution of incumbent share, although scale advantages remain formidable in the plasma fractionation market.
Plasma Fractionation Industry Leaders
-
CSL Behring
-
Grifols S.A
-
Octapharma
-
Kedrion S.p.A
-
Bio Products Laboratory Ltd.
- *Disclaimer: Major Players sorted in no particular order
Plasma Fractionation Market Companies Covered in this Report
- CSL Behring
- Grifols
- Takeda Pharmaceuticals
- Octapharma
- Kedrion Biopharma
- Biotest
- Bio Products Laboratory
- Shanghai RAAS Blood Products Co., Ltd.
- Sanquin Blood Supply Foundation
- LFB S.A.
- ADMA Biologics
- Kamada Ltd.
- Baxter
- Intas Biopharmaceuticals Ltd.
- PlasmaGen BioSciences
- Emergent Bio Solutions
- Biolife Plasma Services
Market Opportunities and Future Outlook
Investments in yield-focused manufacturing are increasing headroom for immunoglobulins and other plasma-derived proteins, and they also create room for suppliers of enabling technologies (automation, virus filtration, and process intensification) that improve output per liter of plasma. In March 2026, CSL announced a USD 1.5 billion expansion of its Kankakee, Illinois plasma-therapy manufacturing facility, incorporating its Horizon 2 manufacturing process. In July 2026, Octapharma announced a USD 1.5 billion U.S. headquarters and manufacturing campus in Rock Hill, South Carolina. These projects support demand for equipment, consumables, and services that shorten batch cycles, improve yields, and raise domestic end-to-end capacity in major demand centers.
Regional self-sufficiency programs and new build-outs in EMEA and emerging markets also widen scaling routes beyond the traditional U.S.-centric plasma supply chain, aligning with Europe’s push under the SoHO framework. In May 2026, Kedrion announced a EUR 150 million expansion at its Bolognana, Italy site, targeting a tripling of annual processing capacity to 3.3 million liters by 2031. Grifols also moved forward on long-cycle capacity with a July 2025 announcement for a new Llicà de Vall, Spain facility backed by EUR 160 million. In parallel, PT SK Plasma Core Indonesia confirmed a USD 150 million Karawang facility scheduled to begin operations in early 2027, and SK Plasma started construction of a Turkey fractionation plant in a joint venture with the Turkish Red Crescent in June 2026, supporting local supply strategies and contract and technology-transfer pathways for fractionators and national blood organizations.
Recent Industry Developments in Plasma Fractionation Market
- July 2026: Octapharma announced a USD 1.5 billion investment to build a U.S. headquarters and manufacturing campus in Rock Hill, South Carolina, alongside plans tied to significant job creation. The move strengthens local production optionality and adds another large-scale capacity node in North America, where supply security and throughput remain central competitive levers for immunoglobulins.
- June 2026: Grifols held a groundbreaking for its new plasma fractionation facility in Llicà de Vall, Spain, with an initial EUR 160 million investment and plans to add 3 million liters of annual capacity by 2030. This expansion supports European manufacturing scale-up at a time when EU policy attention is focused on adequacy and self-sufficiency of substances of human origin.
- October 2024: Asahi Kasei Medical introduced the Planova FG1 virus removal filter, positioned with materially higher flux than earlier filters. Higher-throughput virus filtration supports debottlenecking in chromatography-intensive fractionation lines and can improve facility utilization by reducing cycle-time constraints in downstream processing.
Plasma Fractionation Market Report Scope and Research Methodology
Market Definition and Coverage
This market is defined as the value generated from fractionating human blood plasma into therapeutic proteins and related plasma-derived products that are supplied to healthcare and research end users.
Scope exclusions: It excludes whole blood and red cell products, transfusion-only services, and general hospital blood banking activities that do not involve industrial plasma fractionation.
Segments Covered in This Report
- By Product
- Immunoglobulins
- Intravenous Immunoglobulin (IVIG)
- Subcutaneous Immunoglobulin (SCIG)
- Other Immunoglobulins
- Coagulation Factors
- Albumin
- Protease Inhibitors (C1-Esterase, Alpha-1 Antitrypsin)
- Other Plasma-Derived Products
- Immunoglobulins
- By Application
- Neurology
- Immunology
- Hematology
- Pulmonology
- Critical Care & Trauma
- Other Applications
- By End-User
- Hospitals & Clinics
- Ambulatory Surgical Centers
- Plasma Collection Centers & Blood Banks
- Other End-Users
- By Sector
- Private Fractionators
- Public Fractionators
- Geography
- North America
- United States
- Canada
- Mexico
- Europe
- Germany
- United Kingdom
- France
- Italy
- Spain
- Rest of Europe
- Asia-Pacific
- China
- Japan
- India
- Australia
- South Korea
- Rest of Asia-Pacific
- Middle East & Africa
- GCC
- South Africa
- Rest of Middle East & Africa
- South America
- Brazil
- Argentina
- Rest of South America
- North America
Data Sources, Market Sizing, and Validation
Desk Research
Desk work starts with building a clean view of demand signals and supply constraints around plasma collection and fractionation output. We reference public sources such as the World Health Organization, US FDA guidance and public databases, CDC publications, and national health ministries to frame disease context and therapy usage patterns.
On the supply side, we also review sources such as UN Comtrade trade statistics for relevant plasma protein categories, peer reviewed articles on plasma derivatives, and updates shared by blood and plasma associations. Company annual reports, investor presentations, and reputable press releases are used to map capacity additions and country exposure, and paid subscriptions for company financials and patent databases are used selectively to fill gaps on product pipelines and manufacturing footprints. These examples are not exhaustive, and other public sources were also used to collect data, validate assumptions, and clarify research points.
Primary Interviews and Surveys
Primary work was used to test assumptions that are hard to confirm from public data, including fractionation yield expectations, product mix shifts, and the way contract pricing moves by region. We spoke with a mix of roles across fractionation operations, commercial functions, and downstream hospital and lab stakeholders in APAC, EMEA, and the Americas, so regional demand intensity and supply tightness could be checked against each other.
Distribution of primary research fieldwork respondents
| Company type | Respondent position | Region |
|---|---|---|
| Top tier: 35% | CXOs: 14% | APAC: 46% |
| Mid tier: 51% | Functional/Unit leaders: 27% | EMEA: 36% |
| Smaller Players: 14% | Managers: 59% | Americas: 18% |
Market-Sizing & Forecasting
Sizing is built using top-down logic where plasma collection volumes, fractionation throughput, and the therapy demand pool are used to reconstruct the spend that can realistically occur in a year. After that macro picture is formed, it is corroborated with selective bottom-up approximations such as sampled price per gram times estimated grams sold for key plasma proteins, plus channel checks on hospital and clinic purchasing behavior.
Inputs that matter for this market include donor plasma collection trends, fractionation capacity utilization, product yield rates (albumin, immunoglobulins, and coagulation proteins), therapy utilization growth for immunology and hematology indications, and average selling price progression by region and contract type. When gaps show up in bottom-up checks for smaller countries, we use proxy indicators such as import reliance and therapy adoption speed, and then adjust using interview feedback. For forecasting, scenario analysis is used to reflect how collection constraints, new capacity ramp ups, and reimbursement conditions can shift supply and pricing, and the final year-by-year path is kept consistent with expert consensus on these variables.
Data Validation & Update Cycle
Outputs are checked through multiple passes so the totals align with independent signals, including changes in plasma collection, fractionation capacity announcements, and observed pricing direction in major regions. When a segment or region looks off, we revisit assumptions, rerun sensitivity checks, and in some cases reconnect with industry participants to confirm whether the change is real or driven by model inputs.
Before sign-off, an analyst review step is completed to confirm arithmetic integrity, currency treatment, and year-on-year logic, followed by a final consistency check across regions and end users. Reports are refreshed annually, and interim updates are made when material events occur, such as major capacity expansions, regulatory changes, or disruptions in plasma collection.
Mordor Intelligence's Plasma Fractionation Market Size Compared Against Other Published Estimates
It is normal to see different market values for plasma fractionation because not every publisher counts the same product scope, year, and pricing basis. Differences also come from how supply limits are treated, and whether demand is linked to real therapy usage or projected more aggressively.
Key gaps usually show up when one estimate blends adjacent plasma-derived therapy value chains together, or when the model assumes faster utilization growth without checking capacity utilization and yield constraints. Currency conversion timing and the anchor year can also move the number, especially when contract prices reset unevenly across regions and product groups.
Benchmark comparison
| Source | Market Size | Gaps in Research Methodology |
|---|---|---|
| Mordor Intelligence | USD 42.15 B (2026) | |
| Global Consultancy A | USD 35.79 B (2024) | Uses an earlier anchor year and a different forecast window, and the estimate appears to be more demand-forward without explicitly reflecting fractionation capacity utilization and yield limits year by year. |
| Industry Publisher B | USD 43.55 B (2026) | Tracks a longer horizon that can lift near-term assumptions, and the scope presentation suggests some adjacent plasma-derived therapy components may be bundled, which can shift the counted value upward. |
The table shows that year selection and what is counted inside plasma-derived products are the two practical reasons for the spread. A capacity and yield anchored build, followed by a pricing and product-mix check by region, keeps the 2026 value tied to realistic output and usage patterns, which is the approach applied here and then validated through interviews, ending with Mordor Intelligence.
Key Questions Answered in the Report
What is the current value of the plasma fractionation market?
The plasma fractionation market size stands at USD 42.15 billion in 2026 and is projected to reach USD 63.06 billion by 2031.
Which product segment holds the largest share of the plasma fractionation market?
Immunoglobulins lead, accounting for 62.74% of revenues in 2025.
Which region is expected to grow fastest in plasma fractionation?
Asia-Pacific is forecast to record a 9.18% CAGR from 2026 to 2031.
Who are the leading companies in the plasma fractionation industry?
CSL Behring, Grifols and Takeda together hold about 70.0% of global capacity.
Why are subcutaneous immunoglobulins gaining popularity?
SCIG products allow home-based self-administration, reduce hospital dependence and maintain comparable efficacy to intravenous formulations.