
Plant Growth Chambers Market Size and Share
Market Overview
| Study Period | 2021 - 2031 |
|---|---|
| Market Size (2026) | USD 610.19 Million |
| Market Size (2031) | USD 840.6 Million |
| Growth Rate (2026 - 2031) | 6.62 % |
| Fastest Growing Market | Asia Pacific |
| Largest Market | North America |
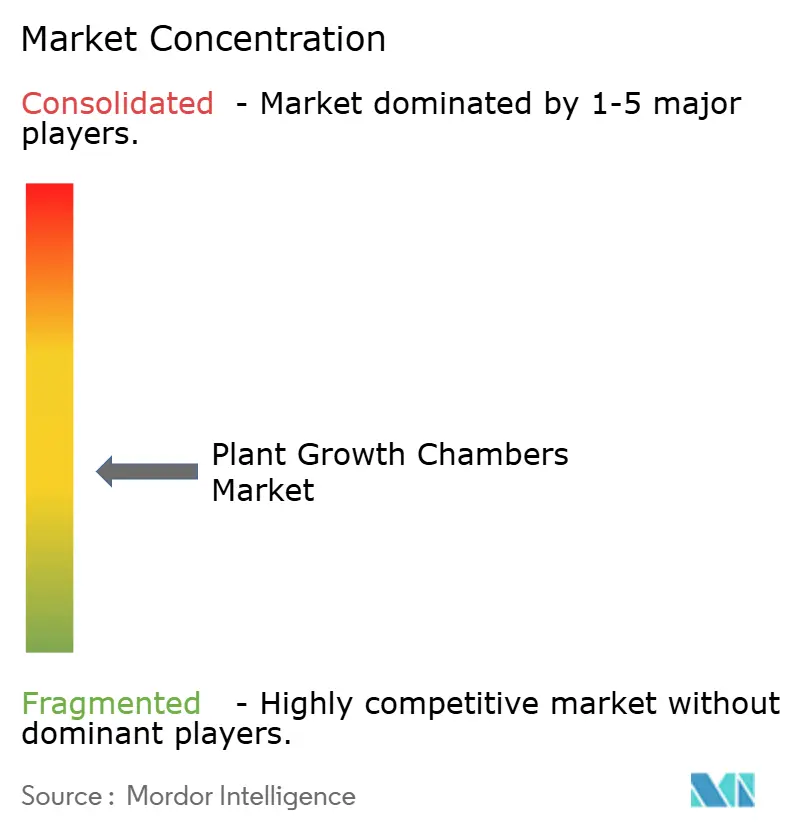
| Market Concentration | Medium |
Major Players *Disclaimer: Major Players sorted in no particular order Image © Mordor Intelligence. Reuse requires attribution under CC BY 4.0. | |
Plant Growth Chambers Market Analysis by Mordor Intelligence
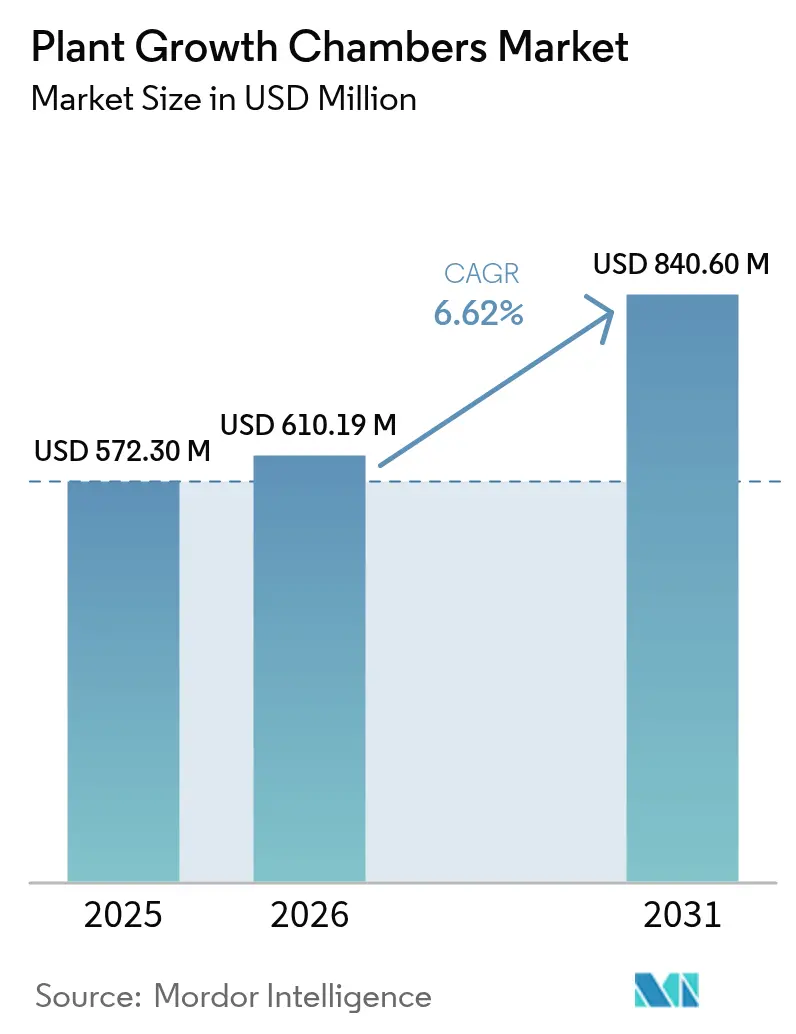
The plant growth chambers market size in 2026 is estimated at USD 610.19 million, growing from 2025 value of USD 572.3 million with 2031 projections showing USD 840.6 million, growing at 6.62% CAGR over 2026-2031. Growing demand for reproducible plant research conditions in biotechnology and advanced agriculture fuels steady spending on controlled-environment infrastructure. Standardized chambers underpin CRISPR gene-editing workflows, tissue-culture pipelines, and microgravity crop trials, turning precise temperature, humidity, and light management into a strategic asset. Manufacturers that pair robust hardware with sensor-rich analytics gain an edge as laboratories seek to cut experimental variability, speed regulatory submissions, and control operating costs. R&D intensity across North America and rapid capital formation in Asia-Pacific signal widening geographic investment, while rising energy tariffs and e-waste rules sharpen attention on life-cycle efficiency.
Key Report Takeaways
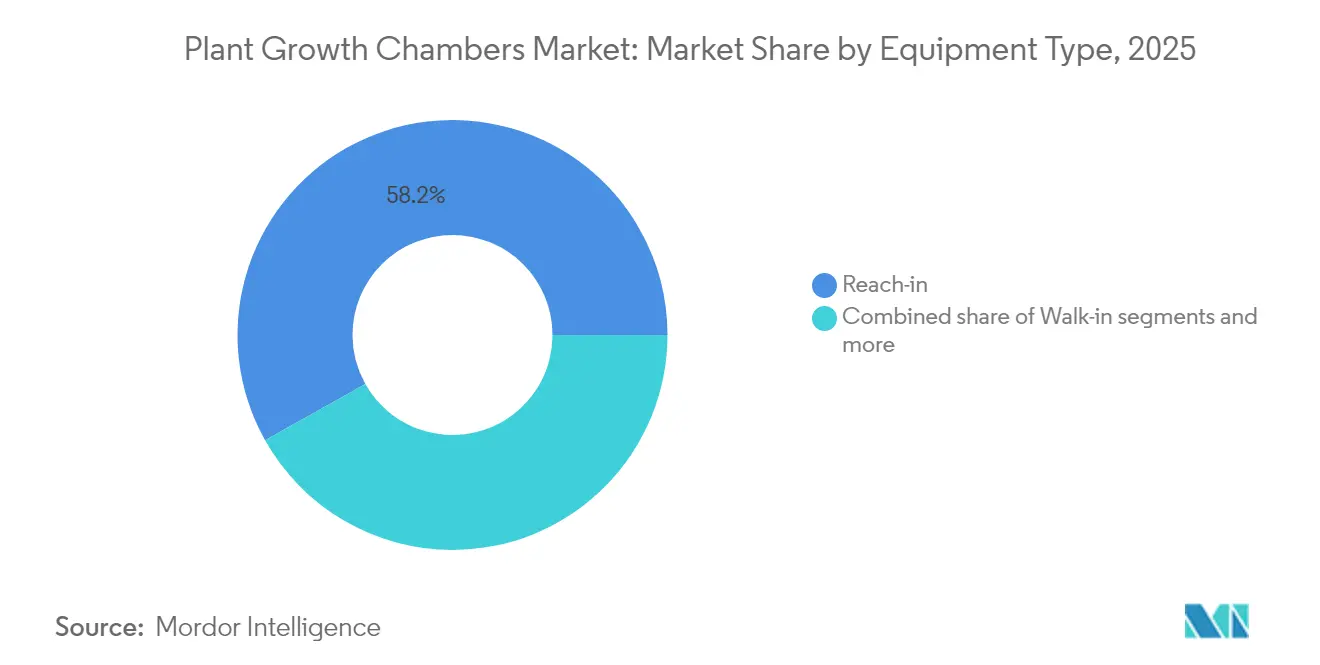
- By equipment type, reach-in units captured 58.15% of the plant growth chambers market share in 2025, while walk-in systems are projected to expand at a 7.68% CAGR to 2031.
- By application, short plants accounted for 38.05% of the plant growth chambers market size in 2025; tall-plant programs are advancing at a 7.29% CAGR through 2031.
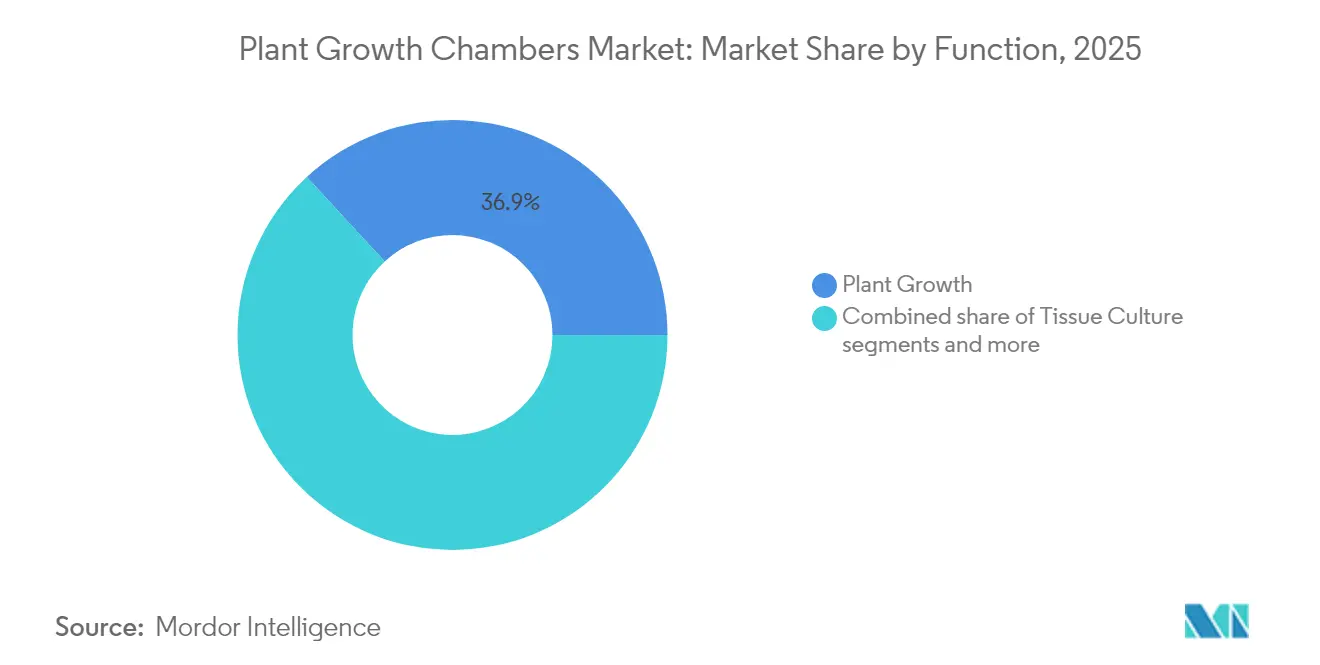
- By function, general plant-growth tasks led with 36.85% revenue in 2025, and tissue culture is poised for the fastest 8.02% CAGR to 2031.
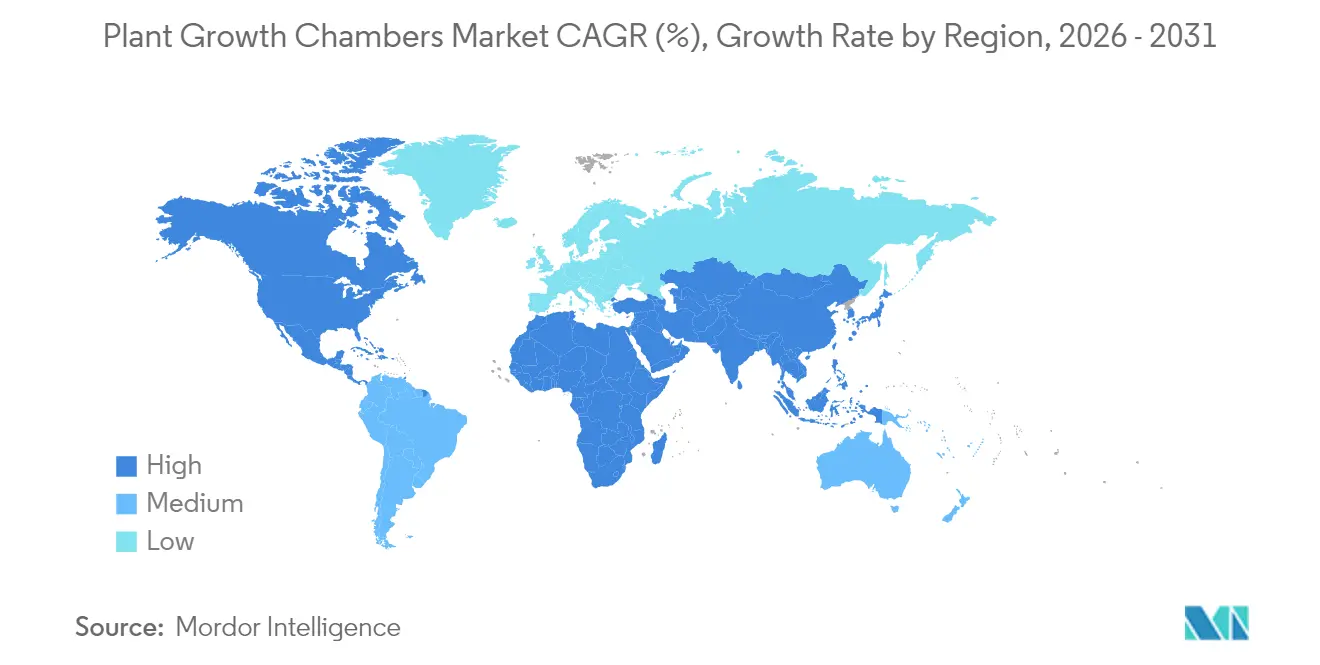
- By geography, North America commanded 34.35% revenue in 2025, whereas Asia-Pacific is set to record a 9.69% CAGR to 2031.
Note: Market size and forecast figures in this report are generated using Mordor Intelligence’s proprietary estimation framework, updated with the latest available data and insights as of 2026.
Market Trends and Insights
Drivers Impact Analysis of Plant Growth Chambers Market*
| Driver | (~)% Impact on CAGR Forecast | Geographic Relevance | Impact Timeline |
|---|---|---|---|
| Rising demand for precision agriculture solutions | +1.2% | Global, with early adoption in North America and Europe | Medium term (2-4 years) |
| Expansion of crop-science R&D spending by seed majors | +0.9% | North America and Europe primarily, expanding to the Asia-Pacific | Long term (≥ 4 years) |
| Accelerated cannabis legalization is boosting controlled-environment investments | +1.1% | North America, Europe, and select Asia-Pacific markets | Short term (≤ 2 years) |
| Rapid adoption of IoT-enabled remote monitoring and analytics | +0.8% | Global, with faster penetration in developed markets | Medium term (2-4 years) |
| Gene-editing workflows (CRISPR) require ultra-stable growth environments | +0.7% | North America, Europe, and China | Long term (≥ 4 years) |
| Space-agriculture experiments driving micro-chamber innovation | +0.4% | North America and Europe, limited to specialized institutions | Long term (≥ 4 years) |
| Source: Mordor Intelligence | |||
Rising Demand for Precision Agriculture Solutions
Precision agriculture's evolution toward controlled environment systems reflects farmers' need to optimize resource utilization while maintaining consistent crop quality under increasingly volatile climate conditions. NASA's recent awards for advanced plant habitat systems demonstrate how space agriculture requirements are driving terrestrial innovations in environmental control precision[1]Source: NASA, “Advanced Plant Habitat Systems Awards,” NASA.GOV. Laboratories choose reach-in formats when space is limited, yet still require high sensor density. As agriculture digitizes, replicable chamber data strengthens field trial validity and supports regulatory filings.
Expansion of Crop-Science R&D Spending by Seed Majors
Major seed companies are redirecting R&D investments toward controlled environment facilities to accelerate breeding cycles and validate gene-edited traits under standardized conditions before field deployment. The European Union's updated plant health regulations require enhanced documentation and digital reporting for plant material movement, creating additional demand for controlled environment systems that can provide complete environmental traceability[2]Source: European Union, “Regulation (EU) 2024/3115,” EUR-LEX.EUROPA.EU. Walk-in models that fit tall crops and in-chamber instrumentation gain traction. The trend lifts premium hardware sales tied to advanced control and robust data logging.
Accelerated Cannabis Legalization Boosting Controlled-Environment Investments
Cannabis cultivation's transition from illicit to regulated markets has created unprecedented demand for controlled environment systems that ensure product consistency and regulatory compliance. The industry's adoption of Good Agricultural and Collection Practices (GACP) standards requires environmental controls that exceed traditional horticultural applications, particularly for medicinal cannabis destined for markets. The market opportunity extends beyond cultivation to include research applications where cannabis companies conduct strain development and potency optimization under controlled conditions. Regional legalization patterns create geographic clustering of demand, with early-adopting jurisdictions developing concentrated controlled environment infrastructure.
Rapid Adoption of IoT-Enabled Remote Monitoring and Analytics
IoT integration transforms plant growth chambers from passive environmental containers into active research platforms that generate continuous data streams for predictive analytics and automated control optimization. The European Space Agency's MELiSSA program demonstrates how advanced environmental monitoring supports closed-loop life support systems, with terrestrial applications in commercial plant production[3]Source: European Space Agency, “MELiSSA Project Overview,” ESA.INT. Centralized monitoring trims labor costs across multi-unit installations and supports predictive maintenance. Vendors now bundle software subscriptions alongside hardware, opening recurring-revenue channels.
Restraints Impact Analysis of Plant Growth Chambers Market*
| Restraint | (~)% Impact on CAGR Forecast | Geographic Relevance | Impact Timeline |
|---|---|---|---|
| High initial capital expenditure | -1.4% | Global, particularly impacting smaller research institutions | Short term (≤ 2 years) |
| Energy-intensive operation increases OPEX | -1.1% | Global, with a higher impact in regions with expensive electricity | Medium term (2-4 years) |
| Scarcity of chamber-rated, PFAS-free insulation materials | -0.6% | Europe and North America are primarily due to regulatory requirements | Medium term (2-4 years) |
| Growing e-waste regulation complicates end-of-life disposal | -0.3% | Europe and developed markets with strict WEEE compliance | Long term (≥ 4 years) |
| Source: Mordor Intelligence | |||
High Initial Capital Expenditure
The substantial upfront investment required for advanced plant growth chambers creates adoption barriers, particularly for smaller research institutions and emerging biotechnology companies operating under capital constraints. The cost barrier particularly affects academic institutions where budget cycles and procurement processes can delay chamber acquisition by 12-18 months beyond initial need identification. Manufacturers respond by offering modular systems and financing arrangements, but the fundamental cost structure remains a market constraint that limits adoption among price-sensitive customer segments.
Energy-Intensive Operation Increasing OPEX
Plant growth chambers consume substantial electricity for lighting, temperature control, and air circulation systems, with energy costs representing 25-50% of total operational expenses depending on local utility rates and usage patterns. LED lighting systems, while more efficient than traditional fluorescent or HID technologies, still require significant power for achieving photosynthetically active radiation levels comparable to natural sunlight. BINDER's recent introduction of energy-efficient climate chambers with inverter compressor technology demonstrates the manufacturer's efforts to address operational cost concerns through improved hardware design.
*Our forecasts treat driver/restraint impacts as directional, not additive. The impact forecasts reflect baseline growth, mix effects, and variable interactions.
Plant Growth Chambers Market Segment Analysis
By Equipment Type:
Walk-in Chambers Enable High-Throughput ResearchReach-in units captured 58.15% of the plant growth chambers market share in 2025. Walk-in models are projected to expand at a 7.68% CAGR, outpacing reach-in units that dominate the current plant growth chambers market size. The surge reflects institutional moves toward high-throughput phenotyping, tall-crop breeding, and cannabis flower production, where human access and headroom are mandatory. Walk-ins support large sensor arrays, integrated imaging, and robotic sampling, making the premium price acceptable for data-rich studies. Reach-in designs still anchor routine tasks because they optimize floor space and minimize power draw. Advanced LED arrays and variable-speed airflow broaden their use in small-batch experiments and teaching labs.
Customization defines both formats. Vendors offer CO₂-enrichment modules, spectral-tunable lights, and water-cooled condensers that adapt chambers to species-specific protocols. Add-on data gateways feed analytics platforms that benchmark environmental stability across units. Competitive differentiation thus pivots on configurability and software rather than sheet-metal fabrication alone.



By Application:
Short Plants Retain Lead While Tall Plants AccelerateShort-plant programs seedlings, micro-greens, and in-vitro cultures held 38.05% revenue in 2025, underscoring their centrality to academic inquiry. These runs often require rapid turnarounds, single-rack layouts, and strict contamination control, aligning well with reach-in formats. Tall-plant work, notably cannabis and tree genomics, is forecast to grow 7.29% annually as legal frameworks mature and long-cycle breeding migrates indoors. Taller chambers integrate high-capacity lighting and adjustable shelf systems to handle vegetative and flowering phases without compromising uniformity.
Cross-application learning shapes design evolution. Airflow algorithms developed for dense seedling trays now guide HVAC tuning in large-canopy cannabis chambers, improving micro-climate homogeneity. This knowledge transfer compresses development timelines and reduces risk for emerging crops.
By Function:
Tissue Culture Emerges as the Fastest-Growing NichePlant growth activities remained the largest contributor, representing 36.85% of 2025 sales, yet tissue culture is gaining momentum with an 8.02% CAGR. Companies propagate gene-edited material under aseptic conditions, demanding tight particulate control and programmable light recipes that influence metabolite pathways.
Seed germination and environment optimization segments cater to specialty breeders and stress-physiology researchers with precise day-night cycles and atmospheric manipulation. Space-agriculture contracts accelerate innovation. Bench-top micro-chambers designed for orbital experiments now serve tissue-culture labs that value their ultra-low footprint and hermetic sealing. These units pioneer energy-efficient airflow and nutrient recovery options later scaled into larger systems, reinforcing a virtuous loop between niche and mainstream functions.
Geography Analysis
North America Plant Growth Chambers Market
North America led the plant growth chambers market in 2025 with 34.35% revenue share, sustained by deep R&D budgets across biotechnology and legalized cannabis enterprises. Federal grants and private venture funding flow into facilities requiring validated environmental control, while the United States FDA guidance on botanical drugs specifies documented chamber data for product consistency. Canada’s mature cannabis supply chain further enlarges the installed base, and Mexico’s agricultural modernization projects open new demand for mid-range units.
APAC Plant Growth Chambers Market
Asia-Pacific is forecast to post a 9.69% CAGR, the fastest region, as China, Japan, India, and Australia channel public funds into food security and biotech capacity. Chinese institutes build large phytotrons to study climate-resilient crops, and Japanese electronics firms apply precision manufacturing know-how to local chamber production.
EMEA Plant Growth Chambers Market
Europe, the Middle East, and Africa present a mosaic of regulatory drivers and resource constraints. European Union phytosanitary laws heighten traceability, encouraging chambers with embedded compliance software. Germany and the United Kingdom anchor demand through ag-biotech clusters. Gulf states pursue indoor farming to offset arid soils, adopting chamber lessons from research for commercial leafy-green production. African markets remain early-stage yet benefit from donor-backed agronomic programs that include controlled-environment modules for seed testing and variety trials.

Regulatory Landscape
Plant growth chambers used in regulated research are governed by a combination of biosafety/biocontainment rules and laboratory quality systems that raise expectations for documentation, audit trails, and facility certification. In the United States, EPA Good Laboratory Practice requirements under 40 CFR Part 160 and Part 792 shape calibration, maintenance, cleaning, and documented environmental stability for chambers used in GLP-regulated agricultural chemical testing, while USDA APHIS Biotechnology Regulatory Services permit processes for work with regulated microorganisms require detailed facility descriptions and inspection-ready containment documentation. Oversight for sensitive biological research also affects procurement practices, following the May 2024 update to federal policy on Dual Use Research of Concern and Pathogens with Enhanced Pandemic Potential and subsequent agency implementation updates.
Outside the United States, containment and traceability requirements similarly affect how research facilities specify chamber installations. In the United Kingdom, the Genetic Technology (Precision Breeding) Regulations 2025 added longer record-keeping obligations (including environmental risk assessment records), reinforcing demand for chambers with robust data logging and retention features. In Australia, the Office of the Gene Technology Regulator provides certification guidance for Physical Containment Level 2 constant temperature rooms under the Gene Technology Act 2000, which influences how institutions design and validate controlled rooms and chamber spaces. China also applies national standards relevant to test and laboratory practices (for example, GB/T 28852-2012 and GB/T 27428-2022), supporting compliance-led procurement in public institutes and industrial labs.
Competitive Landscape
The plant growth chambers market features moderate fragmentation. Thermo Fisher Scientific, Conviron, and BINDER combine broad catalogs with global service networks, positioning them for enterprise-scale deals. Their latest models emphasize energy efficiency, inverter compressors, and natural refrigerants to contain utility costs and comply with climate rules. Each layer's proprietary software that unifies sensor data and automates alerts, turning hardware into an IoT node.
Mid-sized specialists such as Percival Scientific, Darwin Chambers, and Environmental Growth Chambers carve niches in custom builds. They tailor airflow, lighting, and rack configurations to unconventional species or space-restricted labs, trading standardization for bespoke performance. Competitive pressure now revolves around post-sale services: calibration, preventative maintenance, and data-integrity audits. Firms that embed predictive diagnostics cut downtime and lock in multi-year service agreements.
Recent private-equity interest signals sector maturation. Biolog’s 2025 purchase of Anaerobe Systems reflects a trend toward consolidation of complementary microbiology and plant research technologies. In January 2025, BINDER launched LED-equipped climate chambers that consume 40% less energy. These product innovations help established companies maintain market position, as new entrants focus on software and analytics capabilities.
Plant Growth Chambers Industry Leaders
Percival Scientific, Inc.
Control Environments Ltd.
Thermo Fisher Scientific Inc.
Binder GmbH
Weiss Technik GmbH (Schunk Group)
- *Disclaimer: Major Players sorted in no particular order
Plant Growth Chambers Market Companies Covered in this Report
- Percival Scientific Inc.
- Control Environments Ltd.
- Thermo Fisher Scientific Inc.
- Binder GmbH
- Weiss Technik GmbH (Schunk Group)
- Aralab SA
- Darwin Chambers Company LLC
- PHC Holdings Corporation
- Caron Products and Services Inc. (TASI Group)
- Nijssen Koeling BV
- JEIO TECH Co., Ltd.
- Environmental Growth Chambers Inc.
- Saveer Biotech Limited
- Freezers India Manufacturing Pvt Ltd
- Snijders Scientific BV

Market Opportunities and Future Outlook
An opportunity is emerging from public and institutional capital programs that expand controlled-environment research capacity and translate into sustained demand for chamber hardware, controls, and service contracts. In April 2026, Washington State University began construction of a new plant growth facility at the Wenatchee Tree Fruit Research and Extension Center, including an attached 1,500 sq ft growth chamber area supported by a USD 10 million state capital budget allocation. Separately, the U.S. Army Corps of Engineers reported delivery and commissioning of USD 13.5 million in upgraded climate-controlled greenhouse and screenhouse facilities for USDA-ARS in Corvallis, Oregon, which highlights how federally funded infrastructure upgrades drive specification-led needs for environmental control, monitoring, and validation.
On the technology side, buyers are increasingly shifting from standalone chambers to modular platforms that connect automation, imaging, and software-defined experimentation. This direction creates room for vendors to package chambers together with interoperable sensors, remote monitoring, and data integrity features for multi-user environments. University deployments of high-throughput phenotyping within plant growth facilities (University of Missouri, January 2026) and research platforms coupling standardized growth environments with autonomy and machine learning (Berkeley Lab integrating EcoFAB standardized growth chambers with EcoBOT, July 2026) reinforce a near-term procurement focus on retrofit-friendly controls, standardization across sites, and long-run energy and maintenance optimization as electricity costs and end-of-life compliance expectations rise in developed markets.
Recent Industry Developments in Plant Growth Chambers Market
- July 2026: Berkeley Lab integrated EcoFAB standardized growth chambers with the EcoBOT machine-learning-driven autonomous system to improve reproducibility in plant biology experiments. The work points to a shift toward standardized chamber architectures that support automation, repeatable experiments, and data-driven environmental control workflows.
- July 2025: Thermo Fisher Scientific launched the Heratherm Environmental Chamber line, offering multiple configurations (including light and CO2-capable models) oriented toward regulated laboratory use cases. The release expands options for labs that need configurable environmental control with compliance-aligned features and vendor service support.
- January 2024: The European Commission adopted new phytosanitary regulations that increased requirements for digital reporting and environmental traceability for plant material movement. The change strengthens the case for chambers with comprehensive monitoring and documentation capabilities that can support compliance and audit readiness.


Plant Growth Chambers Market Report Scope and Research Methodology
Market Definition and Coverage
This market is defined as revenues earned from plant growth chambers that create controlled settings for plant research and propagation by managing temperature, humidity, light, and airflow, and that are sold as complete chamber systems.
Scope exclusions: We exclude open-field or greenhouse structures, standalone HVAC and lighting components sold separately, and general laboratory incubators not designed for plant growth use.
Segments Covered in This Report
- By Equipment Type
- Reach-in
- Walk-in
- Modular / Stackable
- Containerized
- Custom-built Solutions
- By Application
- Short Plants
- Tall Plants
- By Function
- Plant Growth
- Seed Germination
- Tissue Culture
- Environment Optimization
- Geography
- North America
- United States
- Canada
- Mexico
- Rest of North America
- South America
- Brazil
- Argentina
- Rest of South America
- Europe
- Germany
- United Kingdom
- France
- Italy
- Spain
- Russia
- Rest of Europe
- Asia-Pacific
- China
- Japan
- India
- Australia
- Rest of Asia-Pacific
- Middle East
- United Arab Emirates
- Saudi Arabia
- Rest of Middle East
- Africa
- South Africa
- Kenya
- Rest of Africa
- North America
Data Sources, Market Sizing, and Validation
Desk Research
Desk research was used to set the outer boundaries of demand and to collect reference series that can be checked year after year. Public sources such as USDA publications, National Science Foundation R&D statistics, Eurostat datasets, FAOSTAT, and UN Comtrade trade tables were used to understand where research activity and equipment movement were rising, and where they were flattening.
We also reviewed manufacturer catalogs and technical datasheets to map chamber classes and typical configurations, then matched them with procurement signals we could track in university and public lab tenders, plus press releases and annual filings where available. Where needed, a paid subscription for company financials and news was used selectively to confirm revenue splits and expansion announcements. We also referenced patent records to track activity around environmental control and sensing features. These desk research inputs are illustrative, and we relied on additional public sources for data collection, validation, and clarification.
Primary Interviews and Surveys
Primary work focused on interviews and short surveys with chamber OEM staff, distributors, lab facility managers, and research buyers from academic, clinical, and commercial labs. These discussions were used to confirm typical selling prices by chamber format, replacement cycles, lead times, and the practical difference between standard models and custom builds, and then to sense-check regional adoption patterns.
Distribution of primary research fieldwork respondents
| Company type | Respondent position | Region |
|---|---|---|
| Top tier: 32% | CXOs: 14% | APAC: 50% |
| Mid tier: 54% | Functional/Unit leaders: 30% | EMEA: 30% |
| Smaller Players: 14% | Managers: 56% | Americas: 20% |
Market-Sizing & Forecasting
Sizing started with a top-down build that reconstructs the addressable demand pool using research spending and controlled-environment lab activity, then translates those indicators into likely equipment procurement volumes by region. After that, we applied chamber mix and price bands to reach a value estimate, and cross-checked totals using selective bottom-up approximations such as sampled ASP times expected unit volumes and distributor channel checks.
Key model inputs included the split of reach-in versus walk-in demand, the share of modular or custom-built installations in new lab builds, typical replacement timing for heavily used chambers, and the pricing impact of features such as higher uniformity lighting, CO2 control, and data logging. We also monitored where tissue culture and seed germination workloads were expanding, since these application areas often trigger chamber purchases even when broader research budgets appear flat.
Forecasts were generated using scenario analysis supported by simple trend lines on the same demand indicators, then adjusted based on primary feedback about order backlogs, expected pricing moves, and budget visibility for public labs. Where direct volume signals were weak, gaps were handled by using proxy indicators such as tender frequency, lab construction pipelines, and import patterns, followed by a conservative adjustment factor that was validated in interviews.
Data Validation & Update Cycle
To validate the numbers, we compared the model output against independent signals such as tender awards, reported shipment momentum discussed in public updates, and regional research funding direction, which helped flag outliers early. Large variances were reviewed step by step, and assumptions were revisited when pricing or mix changes could explain the gap.
A second analyst review is completed before sign-off, and any open questions trigger re-contact with relevant interviewees so the logic remains consistent across regions and years. The report is refreshed annually, with interim updates when a material event affects pricing, availability, or demand conditions. Before delivery, a final check is performed to ensure clients receive the most current view available at that time.
Mordor Intelligence's Plant Growth Chambers Market Size Compared With Other Published Estimates
It is common to see different market sizes for plant growth chambers even when the scope name looks the same. The differences usually come down to what counts as a chamber system versus adjacent lab equipment, how custom projects are treated, and whether the published study follows a conservative or aggressive pricing path.
By tracking equipment-type mix and application-led demand signals, Mordor Intelligence keeps the total centered on complete plant growth chamber systems, and we price-check the result through interviews rather than applying a single flat ASP across all regions.
Benchmark comparison
| Source | Market Size | Gaps in Research Methodology |
|---|---|---|
| Mordor Intelligence | USD 572.30 M (2025) | |
| Industry Publisher A | USD 608.50 M (2025) | This estimate appears to apply a broader inclusion set with fewer equipment formats called out, which can pull in adjacent environmental chambers and lift the average price assumption in the base year. |
| Trade Release B | USD 507.00 M (2024) | The base year is different and the coverage may lean toward standard reach-in and walk-in units, which can undercount modular, containerized, and custom-built solutions that are often sold through project-led channels. |
The spread in the table is mainly explained by boundary choices around what qualifies as a plant growth chamber sale and how pricing is carried forward across regions. Our approach stays repeatable because the total is built from visible demand drivers, is checked against channel feedback, and is adjusted when mix or procurement cycles shift.


Key Questions Answered in the Report
What is the projected value of the plant growth chambers market in 2031?
The plant growth chambers market is expected to reach USD 840.6 million by 2031.
Which region will expand fastest through 2031?
Asia-Pacific is forecast to grow at a 9.69% CAGR due to government support for biotech and controlled-environment agriculture.
Why are walk-in chambers gaining traction?
Walk-in units enable high-throughput phenotyping and tall-crop experiments, driving a 7.68% CAGR despite higher upfront costs.
How does energy efficiency influence purchasing decisions?
Electricity can account for up to 50% of operating costs, so inverter compressors and LED lighting sway buyers toward energy-optimized models.
What factor limits adoption among smaller institutions?
High initial capital expenditure remains the strongest barrier, with advanced walk-in systems exceeding USD 200,000 per unit.
Page last updated on:





