
Phenolic Resin Market Size and Share
Market Overview
| Study Period | 2020 - 2031 |
|---|---|
| Market Volume (2026) | 9.49 Million tons |
| Market Volume (2031) | 11.79 Million tons |
| Growth Rate (2026 - 2031) | 4.42 % |
| Fastest Growing Market | Asia Pacific |
| Largest Market | Asia Pacific |
| Market Concentration | Low |
Major Players *Disclaimer: Major Players sorted in no particular order Image © Mordor Intelligence. Reuse requires attribution under CC BY 4.0. | |
Phenolic Resin Market Analysis by Mordor Intelligence
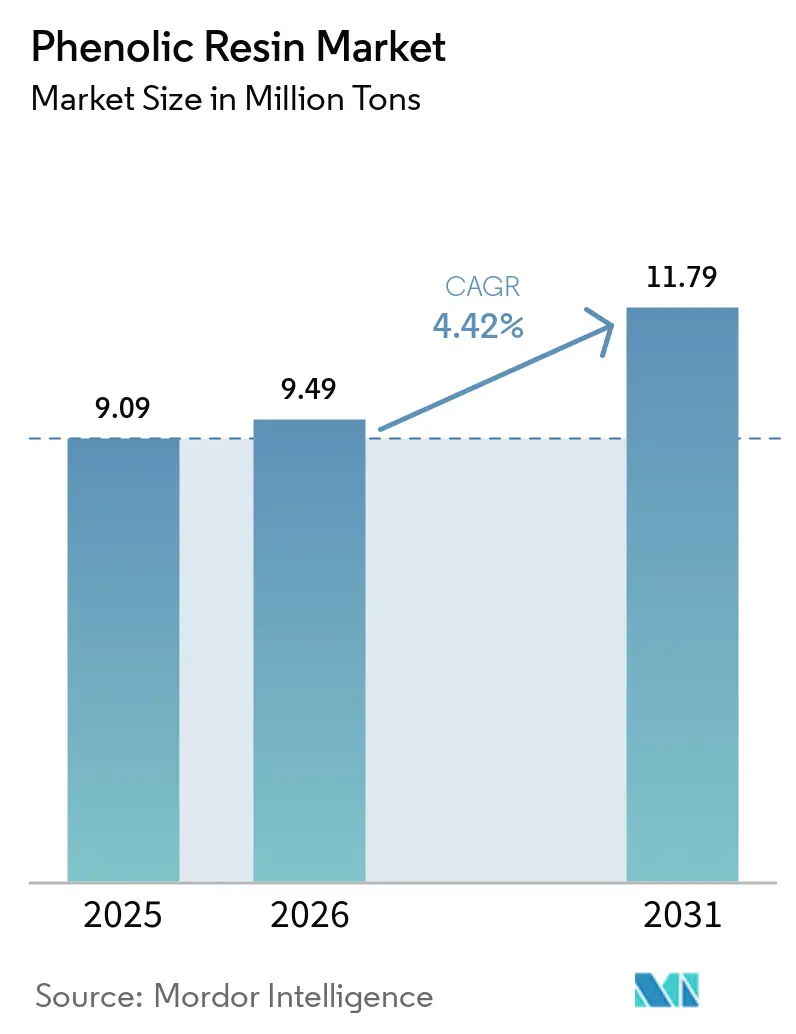
The Phenolic Resin Market size is expected to grow from 9.09 Million tons in 2025 to 9.49 Million tons in 2026 and is forecast to reach 11.79 Million tons by 2031 at 4.42% CAGR over 2026-2031. Investments in lightweight electric-vehicle composites, rising demand for fire-safe insulation in modular buildings, and high-frequency 5G infrastructure roll-out reinforce consumption momentum. Competitive pressure from bio-based grades stimulates process innovation while helping established producers defend margins. At the same time, regional supply chains are maturing, with several large Asian plants poised to export to Europe and North America once domestic needs are met. Therefore, Incumbents focus on differentiated formulations that meet stricter emission regulations and offer shorter curing cycles.
Key Report Takeaways
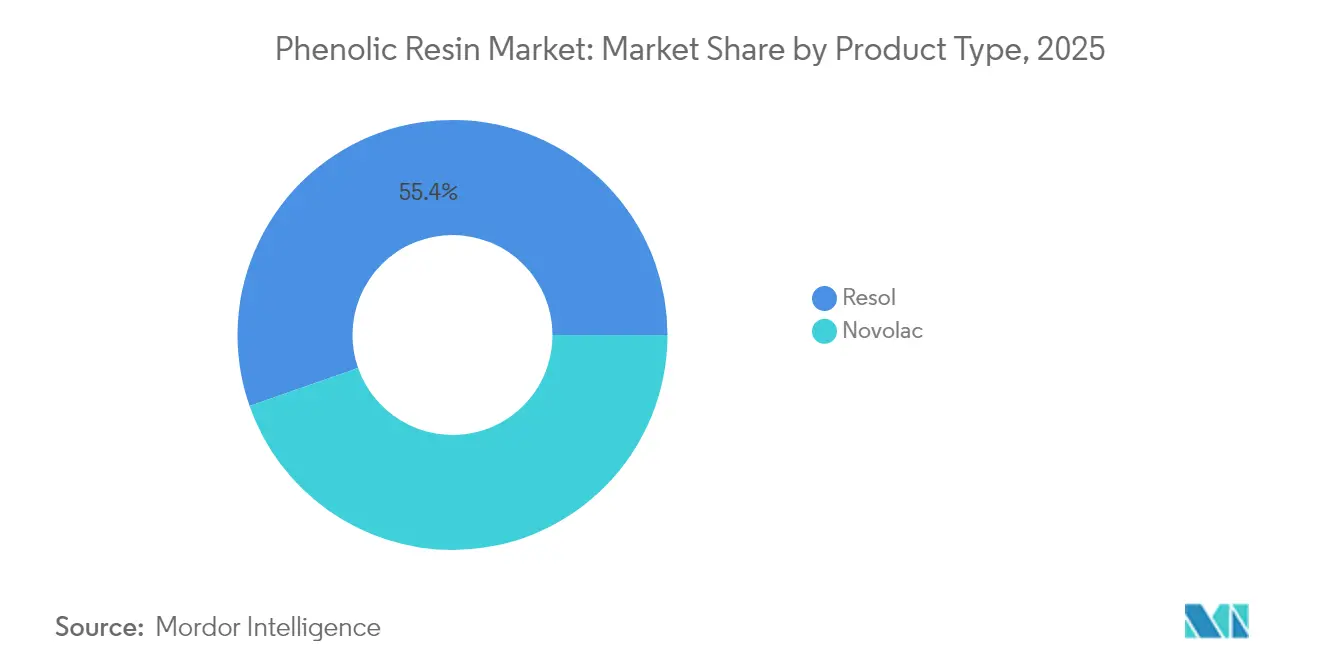
- By product type, resol phenolic resins accounted for 55.35% of the phenolic resin market share in 2025, while novolac resins are the fastest-growing at a CAGR of 4.87%.
- By application, adhesives commanded 53.02% share of the phenolic resin market size in 2025 and are advancing at a 4.96% CAGR through 2031.
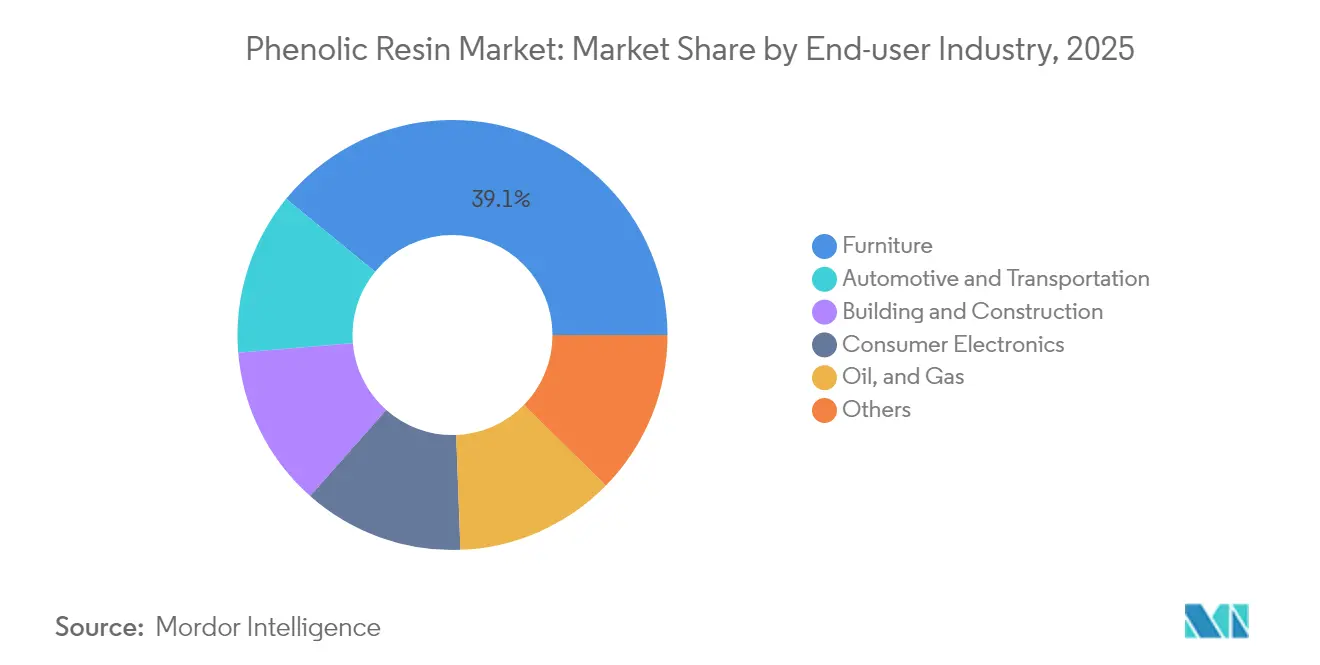
- By end-user industry, the furniture sector held 39.08% of the phenolic resin market size in 2025 while recording the highest projected CAGR at 5.62% to 2031.
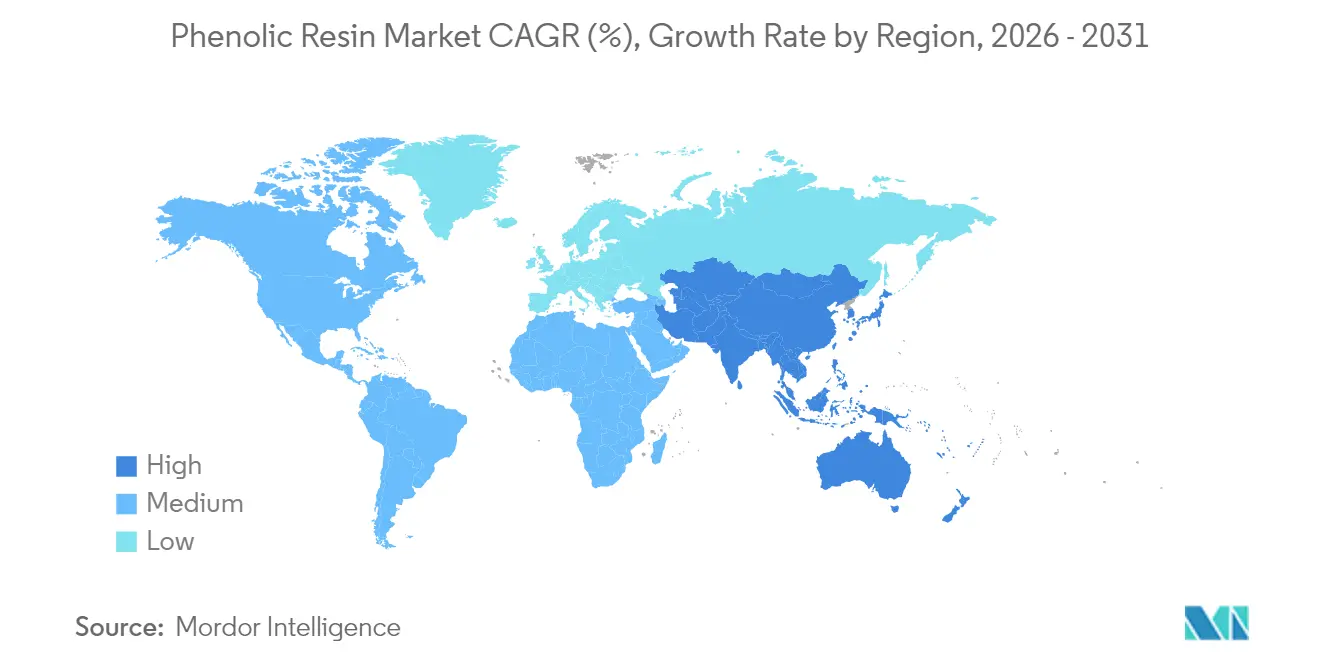
- By geography, Asia Pacific represented 48.60% of the phenolic resin market share in 2025 and is expanding at a 5.03% CAGR during the forecast period.
Note: Market size and forecast figures in this report are generated using Mordor Intelligence’s proprietary estimation framework, updated with the latest available data and insights as of 2026.
Market Trends and Insights
Drivers Impact Analysis of Phenolic Resin Market*
| Drivers | (~) % Impact on CAGR Forecast | Geographic Relevance | Impact Timeline |
|---|---|---|---|
| Lightweight, heat-resistant composites for EV and hydrogen vehicles | +1.2% | Global – strongest in China, North America, Europe | Medium term (2-4 years) |
| Modular and prefab construction adopting phenolic-foam insulation | +0.9% | North America and EU, spill-over to APAC | Long term (≥ 4 years) |
| Recovery of automotive friction-material production | +0.8% | Global manufacturing hubs | Short term (≤ 2 years) |
| Stricter fire-safety norms in public-transport interiors | +0.7% | Europe, North America, APAC | Medium term (2-4 years) |
| Expansion of 5G PCB laminates using low-loss phenolics | +1.1% | Asia Pacific core, global spill-over | Medium term (2-4 years) |
| Source: Mordor Intelligence | |||
Lightweight Composites Support Electric-Mobility Scale-Up
Automakers pursuing vehicle weight reduction are specifying phenolic-based sheet-molding compounds for battery enclosures, underbodies, and structural braces. SABIC’s multi-material battery housing recorded a 20% weight cut while maintaining thermal-runaway containment at 1,100 °C, illustrating the material’s superior heat and flame resistance[1]SABIC, “Advanced Materials for EVs and Energy Storage,” sabic.com. Higher voltage 800-V architectures intensify requirements for comparative tracking index performance, an attribute where phenolic formulations outperform epoxy and polyester alternatives. Hydrogen fuel-cell vehicles widen the addressable market as phenolic composites enable lightweight, chemically inert pressure-vessel shelves and ancillary housings
Modular Construction Accelerates Phenolic-Foam Adoption
The move toward factory-built walls and volumetric modules benefits phenolic foam, whose low smoke generation and Class A flame rating satisfy stricter North American and European codes. Prefabricated façade panels equipped with 30 mm phenolic boards deliver U-values below 0.15 W/m²-K, meeting near-zero-energy building targets without thick cavities. Installation speed is another appeal: contractors report up to 25% labor savings because phenolic foam boards combine insulation and fire barrier in a single layer[2]FM Approvals, “Standard FM 4880,” fmapprovals.com. Rail operators follow a similar logic, EN 45545-2 compliance drives phenolic sandwich panels for interior linings, lowering refurbishment downtime while guaranteeing R1 HL3 classification
Automotive Friction-Material Rebound Sustains Resin Orders
Global light-vehicle output recovered to 91 million units in 2025, reviving demand for phenolic-bonded brake pads. Sumitomo Bakelite commercialized lignin-modified novolac resins that reduce cradle-to-gate CO₂ by 40% yet retain fade resistance above 480 °C, vital for high-performance calipers. Regenerative braking still uses friction pads for emergency and low-speed stops, prolonging service intervals but raising peak temperature cycles. Commercial-vehicle electrification compounds volume upside, as buses and delivery vans require oversized pads to manage heavier curb weights.
Fire-Safety Regulations Expand Addressable Sectors
Phenolic resins are inherently char-forming and do not require halogenated flame retardants, an attribute gaining favour under Europe’s Ecodesign and California’s SB-1019 furniture rules. In aviation, FAR 25.853 interior panels based on phenolic/aramid honeycombs meet heat release rates below 65 kW-min/m² while shedding 45% weight against aluminium honeycomb. Metro operators in Beijing and Paris adopt phenolic floorboards to comply with toxic-gas thresholds, steering demand beyond traditional epoxy panels.
Restraints Impact Analysis of Phenolic Resin Market*
| Restraints | (~) % Impact on CAGR Forecast | Geographic Relevance | Impact Timeline |
|---|---|---|---|
| Volatile phenol and formaldehyde feedstock prices | –0.6% | Global | Short term (≤ 2 years) |
| Stricter formaldehyde-emission regulations | –0.4% | Europe, North America, global rollout | Long term (≥ 4 years) |
| Limited recycling and end-of-life options | –0.3% | Global, strongest in OECD markets | Long term (≥ 4 years) |
| Source: Mordor Intelligence | |||
Feedstock Volatility Challenges Margin Stability
Phenol accounts for roughly 50% of the cash cost in standard resol production, exposing manufacturers to swings tied to benzene and propylene. Asian suppliers benefit from surplus BPA capacity that releases unreacted phenol back into the merchant market, cushioning regional price shocks. Forward-buying strategies and indexed contracts partly mute risk, yet smaller converters lack hedging scale.
Emission Regulations Tighten Compliance Budgets
Europe’s ECHA is preparing a 2026 restriction that caps free formaldehyde in woodworking adhesives at 0.1%, mirroring California’s Phase 2 limit. Producers must retrofit reactors with vacuum-stripping columns or adopt alternative cross-linkers to stay within limits. Sumitomo Bakelite’s water-soluble resols already reach 0.05% free monomer, but costs run 8-10% higher than commodity grades. Furniture makers hesitate to absorb the premium, potentially delaying adoption in price-sensitive segments.
*Our forecasts treat driver/restraint impacts as directional, not additive. The impact forecasts reflect baseline growth, mix effects, and variable interactions.
Phenolic Resin Market Segment Analysis
By Product Type:
Resol Grades Anchor Volume LeadershipResol formulations generated 55.35% of the phenolic resin market share in 2025, thanks to self-curing behavior that eliminates hardeners in plywood and oriented-strand-board lines. Novolac variants are growing at a CAGR of 4.87% CAGR to 2031, outpacing resol as electronic-laminate and friction-material applications expand. Around 68 kt of novolac capacity is slated to come onstream in India and Vietnam by 2027, targeting export markets that demand low-free-phenol performance.
Resols employ an F:P ratio above 1.0, forming methylene linkages that set at 120–140 °C. This mechanism favours continuous press lines where cycle time dictates profitability. Conversely, novolac resins, synthesized under acidic conditions with F:P below 1.0, demand hexamine curing agents but yield finer cross-link topology, which boosts viscosity stability during long storage. Brake-pad formulators prefer novolac because thermal decomposition begins near 480 °C, 60 °C higher than typical resols, ensuring fade resistance. High-frequency circuit-board makers also choose novolac-epoxy hybrids for low moisture uptake below 0.2% at 23 °C/50% RH, critical to avoid delamination under reflow soldering.



By Application:
Adhesives Dominate Consumption ProfileAdhesives contributed 53.02% to the phenolic resin market size in 2025 and are projected to grow 4.96% CAGR through 2031. Exterior-grade plywood, laminated veneer lumber, and cross-laminated timber lines account for over half of this application demand, leveraging phenolic binders to satisfy boil-proof testing. Molding applications are centred on compression-moulded under-hood automotive parts, where dimensional stability at 180 °C is essential.
Hot-press plywood plants consume 40–60 g phenolic solid per square metre, and ongoing debottlenecking of LVL facilities in Finland and China underpins steady volume support. Injection-molding compounds, although smaller in tonnage, fetch 2-3 times higher margins, prompting suppliers to expand short-fiber glass-filled phenolic grades.
By End-User Industry:
Furniture Leads but Automotive Gains MomentumThe furniture sector absorbed 39.08% of the phenolic resin market demand in 2025, underpinned by rising engineered-wood penetration in both residential and office fit-outs. Flooring and cabinet makers value the resin’s resistance to humidity cycling, extending product life in tropical climates. Automotive and broader transportation applications are set to climb as electrification requires flame-retardant components that offset thermal-runaway risk. Building and construction is propelled by modular-housing programs that rely on phenolic foam insulation to satisfy passive-house envelopes.
Oil and gas, and marine users are capitalising on phenolic composite coatings that withstand sour-gas corrosion and seawater ingress. Those applications often specify filament-wound phenolic pipes for offshore risers, a market niche expected to pick up once postponed deep-water projects move ahead post-2026.
Geography Analysis
APAC Phenolic Resin Market
Asia Pacific controlled 48.60% of the global phenolic resin market volume in 2025 and is expanding at a 5.03% CAGR through 2031. India offers the fastest incremental lift as domestic plywood makers convert from urea-formaldehyde to phenolic adhesive systems in response to Bureau of Indian Standards revisions. Indonesia and Vietnam, buoyed by foreign direct investment into furniture clusters, are emerging buyers of liquid resin imports.
North America Phenolic Resin Market
North America is anchored by a resilient housing-start pipeline and re-shoring of electric-vehicle supply chains. Recent US Inflation Reduction Act tax credits accelerate battery-plant construction, creating pull-through demand for phenolic composite battery boxes and insulation components.
Europe Phenolic Resin Market
Europe is constrained by subdued construction activity, yet sees bright spots in railway refurbishment and high-speed train carriage production. EN 45545-2 upgrades mandated by several national operators advance phenolic panel adoption.
MEA Phenolic Resin Market
Gulf petrochemical players are evaluating downstream phenolic integration to monetise benzene streams, which could stimulate local supply. South Africa is trialling phenolic foam in public-hospital retrofits to meet energy-efficiency targets, presenting a beachhead for niche imports.

Regulatory Landscape
Phenolic resin production and end-use sit within chemical-registration and exposure frameworks, and formaldehyde emission rules for composite wood products shape resin formulation choices for adhesives. In the European Economic Area, substances used to make phenolic resins such as phenol and formaldehyde are subject to REACH registration obligations for manufacture or import above 1 tonne per year, and compliance expectations increasingly extend beyond registration into lifecycle controls highlighted under the EU Chemicals Strategy for Sustainability.
In North America, formaldehyde emissions from composite wood products are regulated under U.S. EPA TSCA Title VI, and in practice are aligned with California Air Resources Board (CARB) ATCM requirements through test methods, quality control, recordkeeping, and third-party verification for compliant programs such as ULEF and NAF pathways. In February 2026, the U.S. EPA advanced updates to the Formaldehyde Emission Standards for Composite Wood Products through a voluntary consensus standards update, reinforcing the role of validated quality control and emissions testing across plywood, particleboard, and MDF supply chains where phenolic adhesives are widely used.
Value Chain Analysis
The phenolic resin value chain starts with upstream petrochemical feedstocks (phenol and formaldehyde), then moves through resin synthesis (resol and novolac), formulation (modifiers, fillers, and curing agents such as hexamine for novolacs), and downstream conversion into adhesives, molding compounds, laminates, friction materials, and insulation products. Feedstock exposure remains the primary cost lever, with phenol and formaldehyde together representing the majority of production cost, which makes pricing and margins sensitive to benzene and propylene-linked movements and to local availability of merchant formaldehyde.
Midstream producers such as Hexion, SI Group, BASF, Prefere Resins, and Sumitomo Bakelite differentiate through integration, process reliability, and application support to converters in engineered wood, automotive friction, electronics laminates, and construction insulation. Distribution and toll-blending matter for smaller-volume specialty grades and for serving fragmented adhesive and coatings customers; channel strengthening actions, such as Shrieve Chemical Company acquiring TLC Ingredients in January 2026 to expand U.S. distribution reach, also highlight the value of regional stocking and technical service in improving customer lead times. On the innovation side, bio-based substitution has moved into commercial offerings, with lignin-modified phenolic resins introduced by Sumitomo Bakelite adding an alternate upstream input stream linked to biomass and pulp-and-paper adjacencies rather than solely petrochemical phenol.
Competitive Landscape
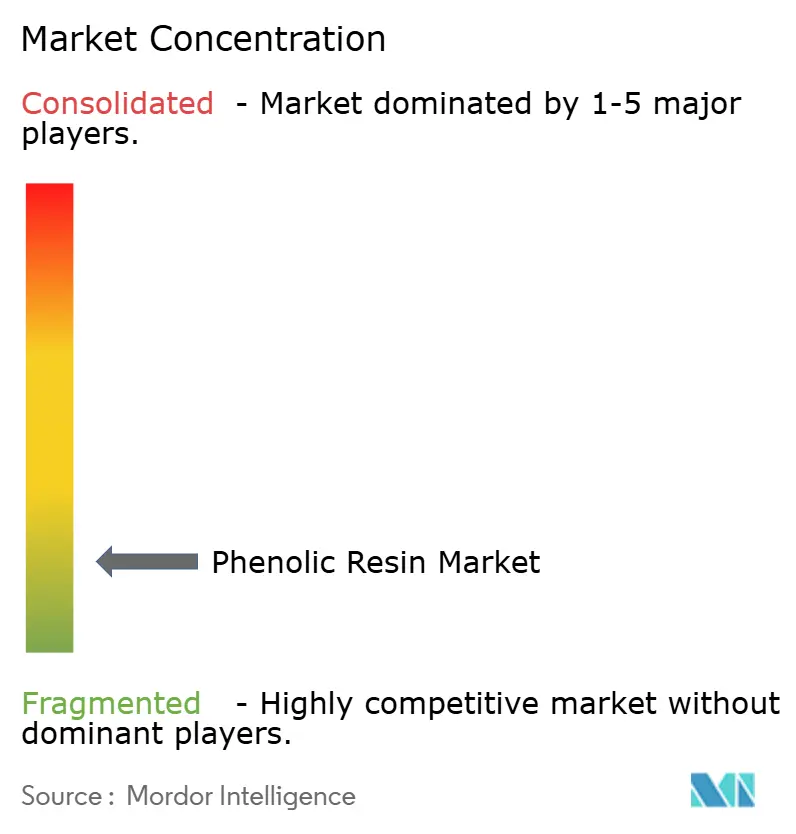
The phenolic resin market exhibits high fragmentation. Vertical integration into phenol and formaldehyde feedstocks remains a key differentiator, especially amid volatile benzene spreads. Hexion leverages internally developed predictive-maintenance AI, acquired through Smartech, to hold down unplanned downtime at its liquid-resol reactors. Regional specialists focus on application depth rather than volume scale. Sustainability narratives animate competitive positioning. Sumitomo Bakelite’s new lignin-modified novolac reportedly cuts cradle-to-gate CO₂ by 1.2 t/t versus conventional petroleum-based grades.
Phenolic Resin Industry Leaders
BASF
Prefere Resins Holding GmbH
SI Group
Sumitomo Bakelite Co. Ltd
Hexion Inc.
- *Disclaimer: Major Players sorted in no particular order
Phenolic Resin Market Companies Covered in this Report
- BAKELIGHT SYNTHESIS
- Aica Kogyo Co. Ltd
- ASAHI YUKIZAI CORPORATION
- ASK Chemicals
- BASF
- Capital Resin Corporation
- DIC Corportaion
- Hexcel Corporation
- Hexion Inc.
- Kolon Industries Inc.
- NANPAO RESINS CHEMICAL GROUP
- Plastics Engineering Company (Plenco
- Prefere Resins Holding GmbH
- Romit Resins Pvt. Ltd
- Shandong Laiwu Runda New Material Co. Ltd
- SHENGQUAN GROUP
- SI Group
- Sumitomo Bakelite Co. Ltd
- Sundow Polymers Co. Ltd
- Taiwan PU Corporation
- UPM

Market Opportunities and Future Outlook
The strongest opportunity is in ultra-low-emitting and low-free-monomer phenolic systems for engineered wood, supported by tightening compliance and test-method rigor under frameworks such as U.S. EPA TSCA Title VI and parallel CARB programs. Procurement actions by large wood-products manufacturers provide on-market validation: Weyerhaeuser entered a supply contract for low-emissions resole phenolic resin from Hexion covering deliveries across 2024 through 2026, indicating demand for formulations that help composite wood and structural panel producers manage formaldehyde compliance and documentation burdens while sustaining press-cycle productivity.
Bio-based and lower-carbon resin inputs offer another white-space, with commercial traction and supplier roadmaps visible across lignin-, cardanol-, and tannin-based pathways aimed at reducing reliance on petroleum-derived phenol while addressing VOC and free-formaldehyde constraints. Recent commercialization of lignin-modified novolac and resol grades by Sumitomo Bakelite and its group company expands options for foundry binders and wood adhesives. Upstream decarbonization of complementary resin ingredients is also being pursued through partnerships such as OCI and Prefere Resins using lower-carbon melamine for resins serving laminates and coatings. At the same time, periodic logistics and energy shocks have kept attention on supply resilience and inventory strategy, including early-2026 U.S. price volatility tied to energy and shipping disruptions, which is reinforcing buyer interest in diversified sourcing, local stocking, and formulations that reduce total applied cost through shorter cure cycles or lower add-on rates.
Recent Industry Developments in Phenolic Resin Market
- June 2026: OCI and Prefere Resins partnered to use low-carbon MelaminebyOCI Novo (biogas-produced melamine) in resin production for downstream sectors including coatings, papers, textiles, and laminates. The move broadens access to lower-carbon inputs for resin formulators and supports product positioning where customers are tracking embedded emissions across materials.
- March 2026: Sumitomo Bakelite launched a new series of specialty high-adhesion modified phenolic resins for composite materials. The launch expands the companys portfolio for composite bonding and structural applications, aligning with demand for higher-performance phenolic systems in transportation and industrial components.
- October 2024: Sumitomo Bakelite group company Sunbake began commercial sales of the Sumitac PL-700 series, a resol-type lignin-modified phenolic resin for wood adhesives. This commercialization advanced bio-based substitution in a high-volume end use, providing adhesive manufacturers with an alternative route to lower fossil-derived content while keeping phenolic performance attributes.


Phenolic Resin Market Report Scope and Research Methodology
Market Definition and Coverage
This market is defined as the demand for phenolic resins that are manufactured and sold for industrial use, counted at the point of sale by producers or authorized channels, and tracked across major consuming regions.
Scope exclusions: the sizing excludes downstream finished goods value (such as brake pads, laminates, or insulation boards) and counts only the resin material value or volume.
Segments Covered in This Report
- By Product Type (Volume)
- Novolac
- Resol
- By Application
- Molding
- Adhesives
- Insulation
- Others
- By End-user Industry
- Automotive and Transportation
- Building and Construction
- Consumer Electronics
- Oil, and Gas
- Furniture
- Others
- By Geography
- Asia-Pacific
- China
- India
- Japan
- South Korea
- Malaysia
- Thailand
- Indonesia
- Vietnam
- Rest of Asia-Pacific
- North America
- United States
- Canada
- Mexico
- Europe
- Germany
- United Kingdom
- France
- Italy
- Spain
- NORDIC Countries
- Turkey
- Russia
- Rest of Europe
- South America
- Brazil
- Argentina
- Colombia
- Rest of South America
- Middle-East and Africa
- Saudi Arabia
- United Arab Emirates
- Nigeria
- South Africa
- Rest of Middle-East and Africa
- Asia-Pacific
Data Sources, Market Sizing, and Validation
Desk Research
Desk work starts by mapping where phenolic resins are consumed and which signals can be followed year over year. We use public sources such as UN Comtrade trade statistics, U.S. Census Bureau manufacturing datasets, Eurostat industrial and trade tables, and national statistical offices in key producing economies for demand and supply context.
We also review company annual reports, investor presentations, sustainability reports, patents, and reputable industry press to track capacity additions, plant run rates, and application shifts (for example, insulation uptake in construction and lightweighting needs in vehicles). Where needed, paid subscriptions are used only for company financials and intelligence, patent databases, and shipment-level import export views, so the assumptions can be checked against observed movements. These desk sources are illustrative, and additional public references are used for data collection, validation, and clarification during the study.
Primary Interviews and Surveys
Primary work is used to test desk assumptions with people who see pricing and demand changes early, including resin producers, compounders, distributors, and procurement or technical teams tied to key end-use industries. Interviews and surveys also help confirm how product mix shifts between novolac and resol grades and how demand varies by region, before final totals are locked.
Distribution of primary research fieldwork respondents
| Company type | Respondent position | Region |
|---|---|---|
| Top tier: 37% | CXOs: 13% | APAC: 44% |
| Mid tier: 49% | Functional/Unit leaders: 33% | EMEA: 33% |
| Smaller Players: 14% | Managers: 54% | Americas: 23% |
Market-Sizing & Forecasting
Sizing is built using a top-down approach where production data, trade flows, and end-use consumption signals are used to reconstruct the demand pool for phenolic resins by region. The model is then corroborated with selective bottom-up checks, such as sampled producer and distributor revenue views, typical price per ton ranges by grade, and volume validation from large application clusters, with totals adjusted when mismatches appear.
Key inputs include phenol and formaldehyde cost direction (as upstream anchors), reported capacity additions and shutdowns for phenolic resin lines, construction insulation activity and codes that lift fire-safe materials, automotive and transportation production trends that influence friction materials and composites, and trade balances that indicate regional tightness. For the forecast, scenario analysis is used with a base case that reflects interview consensus on capacity utilization, expected application growth, and a realistic price progression, and then high and low cases are run when cost swings or construction cycles are expected to change purchasing behavior. When a direct bottom-up data point is missing for a country, we use a trade proxy plus regional consumption intensity, and then re-check it through expert feedback so the estimate stays practical and repeatable.
Data Validation & Update Cycle
Outputs are validated through triangulation across independent signals, including volume trends, pricing direction, and regional import export movements, which are checked before internal sign-off. If a large variance shows up, the driver is isolated first, then assumptions are revisited, followed by re-contacting relevant interviewees when the gap is material.
Each report is refreshed annually, and interim updates are made when major events occur, such as sizable capacity changes or sharp feedstock volatility. Before delivery, a final analyst pass is completed so clients receive the most current view available at the time of publication.
Mordor Intelligence's Phenolic Resin Market Size Versus Other Published Estimates
Published market sizes for phenolic resins can differ even when they sound similar, because the counted boundary is not always the same and the conversion from volume to value is handled differently. Differences also come from how quickly assumptions are refreshed, and whether supply and demand signals are checked against each other before the number is finalized.
Trade balances, capacity utilization commentary, and observed price per ton ranges are the evidence checks that tie Mordor Intelligence to a volume-led baseline of 9.49 million t (2026), rather than a value-only figure that can shift mainly due to pricing assumptions. Another common gap driver is scope, since some estimates fold adjacent thermoset resins or include downstream formulated products, and that tends to lift the total beyond the resin-only view. Currency timing and the choice of base year also matter, because a 2024 value snapshot will not line up neatly with a 2026 volume base unless grade mix and regional pricing are normalized.
Benchmark comparison
| Source | Market Size | Gaps in Research Methodology |
|---|---|---|
| Mordor Intelligence | USD 9.49 M (2026) | |
| Industry Publisher A | USD 15.07 B (2024) | Uses a value-led 2024 base, and the total can move materially based on assumed average selling price by application and grade mix, which is not directly comparable to a volume-first baseline year. |
| Research Publisher B | USD 16.36 B (2024) | Relies on revenue sizing for 2024 and may apply broader inclusion across end-use product baskets, which can inflate the counted total if resin-only boundaries are not explicitly enforced. |
The spread across the three figures mainly reflects unit choice and boundary choices, followed by base-year timing and price normalization methods. By keeping the steps traceable to capacity, trade, and end-use demand signals and then pressure-testing the implied prices, we keep a balanced estimate that can be explained and reproduced with practical inputs.


Key Questions Answered in the Report
What is the current size of the phenolic resin market?
The phenolic resin market size was 9.49 million t in 2026 and is projected to reach 11.79 million t by 2031, representing a 4.42% CAGR.
Which segment contributes the largest share to the phenolic resin market?
Adhesive applications lead, accounting for 53.02% of global volume in 2025 due to widespread use in plywood and engineered-wood products.
Why is Asia Pacific the fastest-growing region?
The region combines large installed resin capacity with rapid end-use growth in construction, automotive and electronics, resulting in a 5.03% CAGR through 2031.
How are electric vehicles influencing demand?
EV battery enclosures and structural parts require lightweight, flame-resistant composites, boosting uptake of advanced phenolic formulations validated by suppliers such as SABIC and Mitsubishi Chemical.
What sustainability trends are shaping the phenolic resin industry
Lignin-modified resins that cut CO₂ by up to 40% and ultra-low-monomer grades that meet tightening emission caps are gaining commercial traction, led by Sumitomo Bakelite and Stora Enso.
Page last updated on:


 Your data is secure and never sold or shared.


