
Market Overview
| Study Period | 2020 - 2031 |
|---|---|
| Market Size (2026) | USD 116.45 Billion |
| Market Size (2031) | USD 236.28 Billion |
| Growth Rate (2026 - 2031) | 15.22 % |
| Fastest Growing Market | Asia-Pacific |
| Largest Market | North America |
| Market Concentration | Medium |
Major Players *Disclaimer: Major Players sorted in no particular order Image © Mordor Intelligence. Reuse requires attribution under CC BY 4.0. | |
Pharmacy Management System Market Analysis by Mordor Intelligence
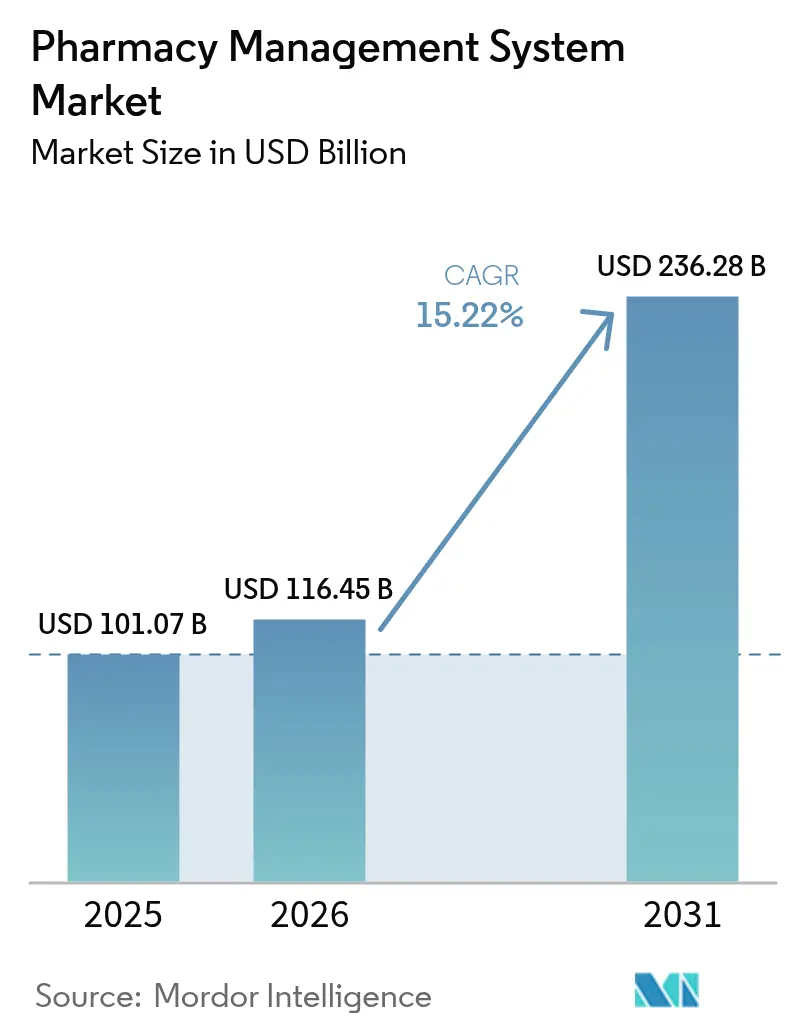
Pharmacy Management System market size in 2026 is estimated at USD 116.45 billion, growing from 2025 value of USD 101.07 billion with 2031 projections showing USD 236.28 billion, growing at 15.22% CAGR over 2026-2031.
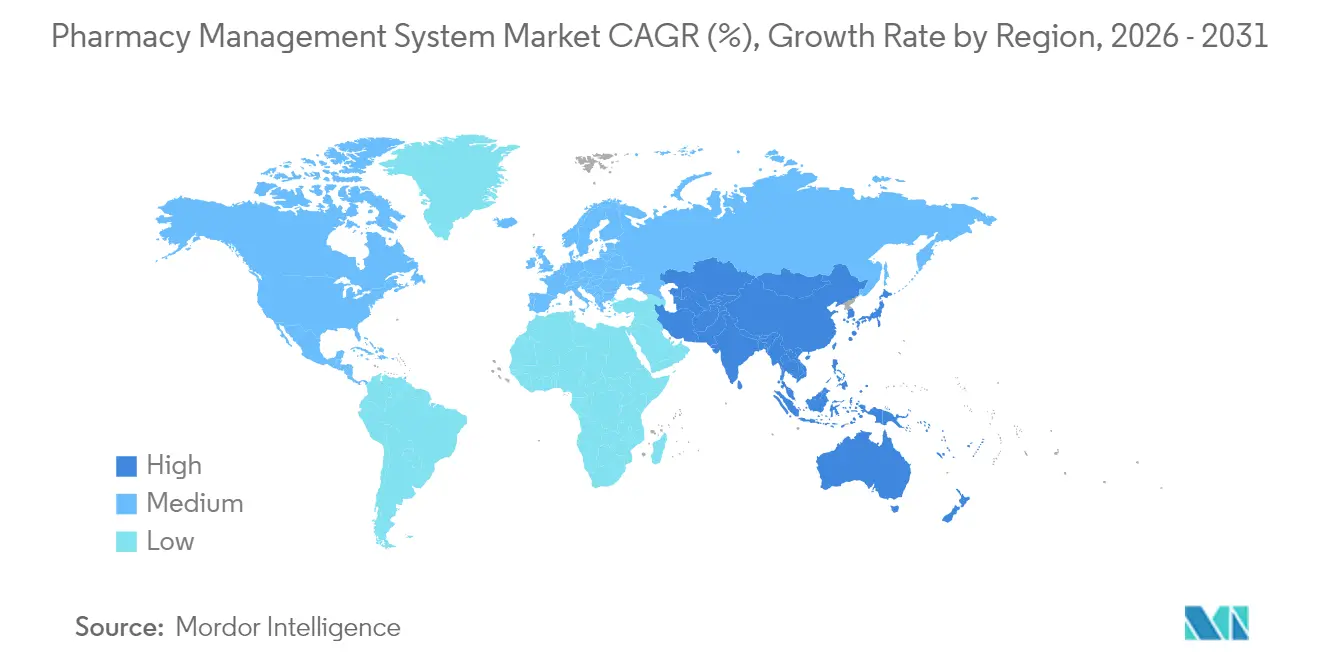
The quick rise mirrors a wider transformation in which pharmacies evolve from product-dispensing outlets into digitally connected care hubs. Demand is escalating for cloud platforms that scale easily, for integrated modules that meet tightening safety rules, and for analytics that offset thin margins by lifting operational efficiency. Competition now revolves around technology depth instead of store count, while patient expectations for clinical services push every provider to modernize workflows. North America supplies the largest revenue base, yet Asia-Pacific provides the steepest growth curve as governments fund new digital infrastructure.
Key Report Takeaways
- By cloud deployment held 62.85% of the pharmacy management system market share in 2025 and is on track to expand at a 17.18% CAGR through 2031.
- By solutions captured 66.90% of the pharmacy management system market size in 2025, while services will post a 16.05% CAGR between 2026 and 2031.
- By independent pharmacies controlled 56.20% of the pharmacy management system market share in 2025; chained pharmacies are poised for 16.84% CAGR to 2031.
- By retail and community locations led with 43.95% revenue share in 2025, whereas long-term-care and specialty outlets will rise at a 14.96% CAGR through 2031.
- By North America accounted for 40.55% of 2025 revenue, but Asia-Pacific is forecast to post the quickest 17.72% CAGR over the period to 2031.
Note: Market size and forecast figures in this report are generated using Mordor Intelligence’s proprietary estimation framework, updated with the latest available data and insights as of 2026.
Market Trends and Insights
Drivers Impact Analysis of Pharmacy Management System Market*
| Driver | (~) % Impact on CAGR Forecast | Geographic Relevance | Impact Timeline |
|---|---|---|---|
| Rising prescription volumes burdening pharmacists | +2.8% | North America and Europe, spreading globally | Medium term (2-4 years) |
| Rapid shift toward cloud-hosted pharmacy platforms | +3.2% | North America and Asia-Pacific | Short term (≤2 years) |
| Stringent global medication-safety regulations | +2.1% | Global | Long term (≥4 years) |
| Cost-savings from AI-led inventory optimisation | +1.9% | Developed markets first | Medium term (2-4 years) |
| Integration of pharmacogenomics modules | +1.4% | North America and Europe | Long term (≥4 years) |
| Expansion of tele-pharmacy services | +1.8% | Rural and underserved areas | Short term (≤2 years) |
| Source: Mordor Intelligence | |||
Rising Prescription Volumes Burdening Pharmacists
Prescription drug spend in the United States rose at 10–12% during 2024, with GLP-1 anti-obesity agents responsible for more than 80% of incremental revenue, intensifying daily dispensing pressure. Surveys show 61% of Americans now consider pharmacies appropriate sites for primary care, stretching pharmacist duties into counseling and vaccination. Independent outlets feel the strain most, with one closing each day in 2023 because reimbursement cuts and manual workflows eroded profits. Automated dispensing and clinical documentation modules inside the pharmacy management system market remove repetitive tasks, letting pharmacists focus on higher-value services. Providers that adopt advanced workflow engines report fewer errors and shorter wait times, improving patient loyalty.
Rapid Shift Toward Cloud-Hosted Pharmacy Platforms
Eighty-three percent of pharmaceutical organizations already keep core workloads in the cloud, and the sector’s cloud spending is forecast to climb to USD 59.37 billion by 2030. Cloud architectures support real-time data synchronization across chains with thousands of branches, a feat that on-premise servers struggle to match. Demand intensified during the COVID-19 pandemic when remote log-ons and elastic capacity became operational necessities, not optional perks. Modern cloud vendors also certify against regional privacy frameworks, lowering concerns over data sovereignty that once delayed adoption. As subscription pricing aligns IT cost with prescription volume, even single-site independents enter the pharmacy management system market to access enterprise-grade analytics without capital outlays.
Stringent Global Medication-Safety Regulations
The U.S. Drug Enforcement Administration warns that hackers now steal DEA numbers and fabricate thousands of orders, forcing pharmacies to tighten controlled-substance oversight.The Office of the National Coordinator formed a Pharmacy Interoperability Task Force to make audit trails and data-exchange standards mandatory for every dispensing system. Parallel moves by the European Medicines Agency and Japan’s PMDA favor platforms that harmonize safeguards across borders. These aligned mandates accelerate spending on secure e-prescription, barcode verification, and real-time diversion monitoring inside the pharmacy management system market. Specialty and long-term-care operators adopt compliance dashboards because their high-alert medication mix exposes them to heavier penalties.
Cost-Savings from AI-Led Inventory Optimisation
Artificial-intelligence engines help pharmacies cut inventory holdings by 20% through smarter demand forecasts and optimal reorder triggers. By illuminating rebate flows and contract tiers, AI tools also deflate the USD 356 billion spread between list and net drug prices reported for 2024. Walgreens now routes 40% of its prescriptions through automated micro-fulfillment hubs, trimming labor cost while raising accuracy. Early adopters gain a hedge against technician shortages and reimbursement pressure, prompting rivals to embed predictive modules quickly. As AI matures, performance gaps widen between pharmacies that mine data and those stuck on batch-based reporting.
Restraints Impact Analysis of Pharmacy Management System Market*
| Restraint | (~) % Impact on CAGR Forecast | Geographic Relevance | Impact Timeline |
|---|---|---|---|
| Vendor lock-in with legacy vendors | -2.4% | Global, entrenched installations | Medium term (2-4 years) |
| Escalating cyber-security and privacy concerns | -1.9% | Highly regulated markets | Short term (≤2 years) |
| High upfront automation capital cost | -1.6% | Emerging economies and independents | Short term (≤2 years) |
| FHIR interoperability gaps with next-gen EHRs | -1.3% | Developed multi-system regions | Long term (≥4 years) |
| Source: Mordor Intelligence | |||
Vendor Lock-in with Legacy Vendors
Large health systems often rely on bespoke builds that weave dispensing, billing, and formulary data into proprietary formats; switching vendors can cost millions and demand months of retraining [1]NEXTDC, “When Sustaining Growth is the Highest Business Priority,” nextdc.com . Independent outlets face different barriers, such as limited IT staff and fear of downtime that threaten fragile cash flows. Consolidation can deepen lock-in when an acquirer phases out open APIs, as observers noted after BD paid USD 1.548 billion for Parata Systems in 2024. Cloud newcomers gradually erode these obstacles by offering migration utilities and pay-as-you-grow terms, yet full transition remains protracted while legacy contracts run their course.
Escalating Cyber-Security and Privacy Concerns
Pharmaceutical firms endured some of the world’s most expensive data breaches in 2024, and every compromise raises legal exposure for dispensing sites that transmit protected health information. Independent pharmacies hesitate to pool data in the cloud because they doubt they can oversee vendor security. HIPAA rules oblige owners to document every AI inference tied to patient care, adding governance layers that slow rollouts. Vendors respond with on-shore data centers, zero-trust frameworks, and continual penetration tests, but many buyers still opt for hybrid deployments that trade efficiency for perceived control.
*Our forecasts treat driver/restraint impacts as directional, not additive. The impact forecasts reflect baseline growth, mix effects, and variable interactions.
Pharmacy Management System Market Segment Analysis
By Component – Solutions Anchor Core Operations
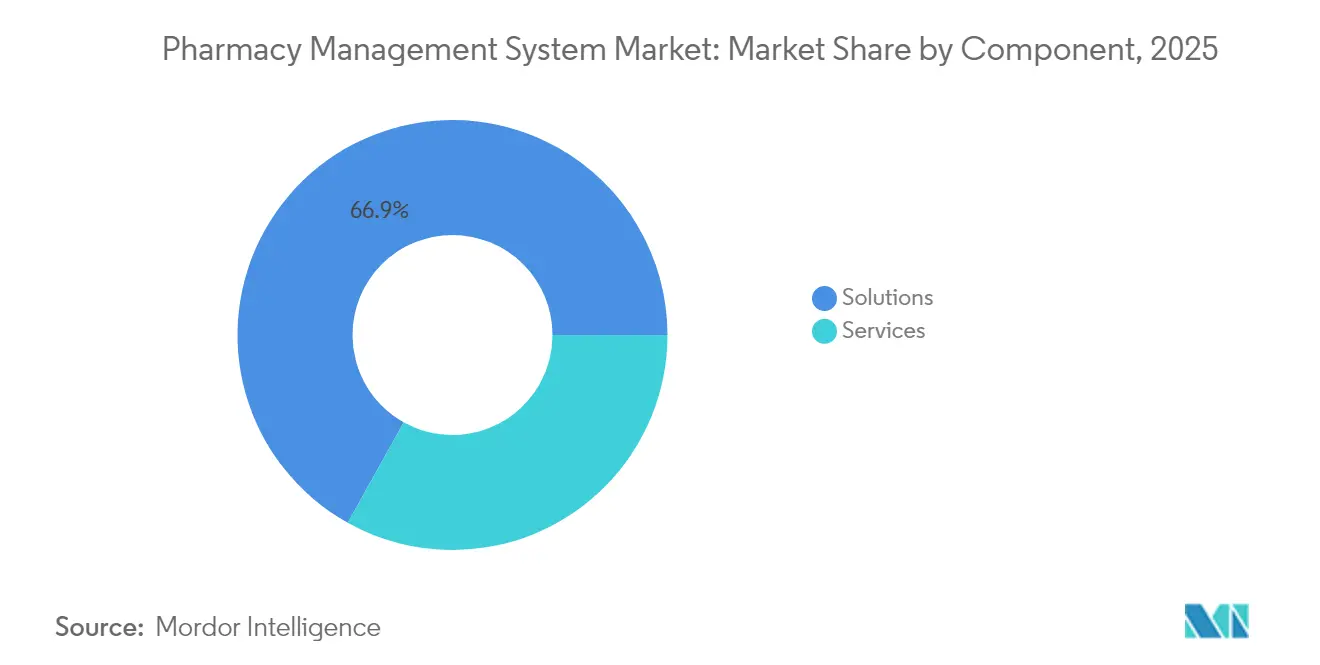
Solutions products generated 66.90% of the pharmacy management system market size in 2025, reflecting the non-negotiable need for e-prescription processing, inventory control, and compliance tracking. The segment’s built-in clinical checks and automated financial reconciliation guard against errors that can spark regulatory fines. Hospitals and chains deploy multi-module suites so pharmacists practice at the top of license while systems handle repetitive inputs. Growth in services, expected at 16.05% CAGR to 2031, shows users increasingly seek configuration, staff training, and managed hosting once the base software is live.
The services wave signals a maturing marketplace in which optimization extends long after go-live. Pharmacies demand analytics tuning, security patching, and workflow redesign as new reimbursement rules arrive. Consultants embed benchmark dashboards that compare fill rates, wait times, and payer mix across branches, helping operators defend margin. Vendors that blend software and advisory support position themselves for stickier revenue streams, deepening share within the pharmacy management system market.



By Deployment – Cloud Leads Modern Infrastructure
Cloud installations owned 62.85% share in 2025 and will post the fastest 17.18% CAGR through 2031, underscoring how elasticity, lower upfront cost, and seamless updates outweigh the comfort of on-premise hardware. Chains favor cloud to standardize data across hundreds of outlets, while independents welcome subscription models that convert capital expenditure into operating cost.
On-premise footprints shrink as cyber-risk mitigation, redundancy, and maintenance demand skills that small IT teams cannot supply. Compliance auditors now rate cloud systems higher because vendors maintain hardened environments certified under multiple frameworks. The pivot enhances real-time collaboration among prescribers, payers, and pharmacists, deepening adoption of the pharmacy management system market across geographies.
By Organisation Size – Independents Retain Scale but Chains Outpace Growth
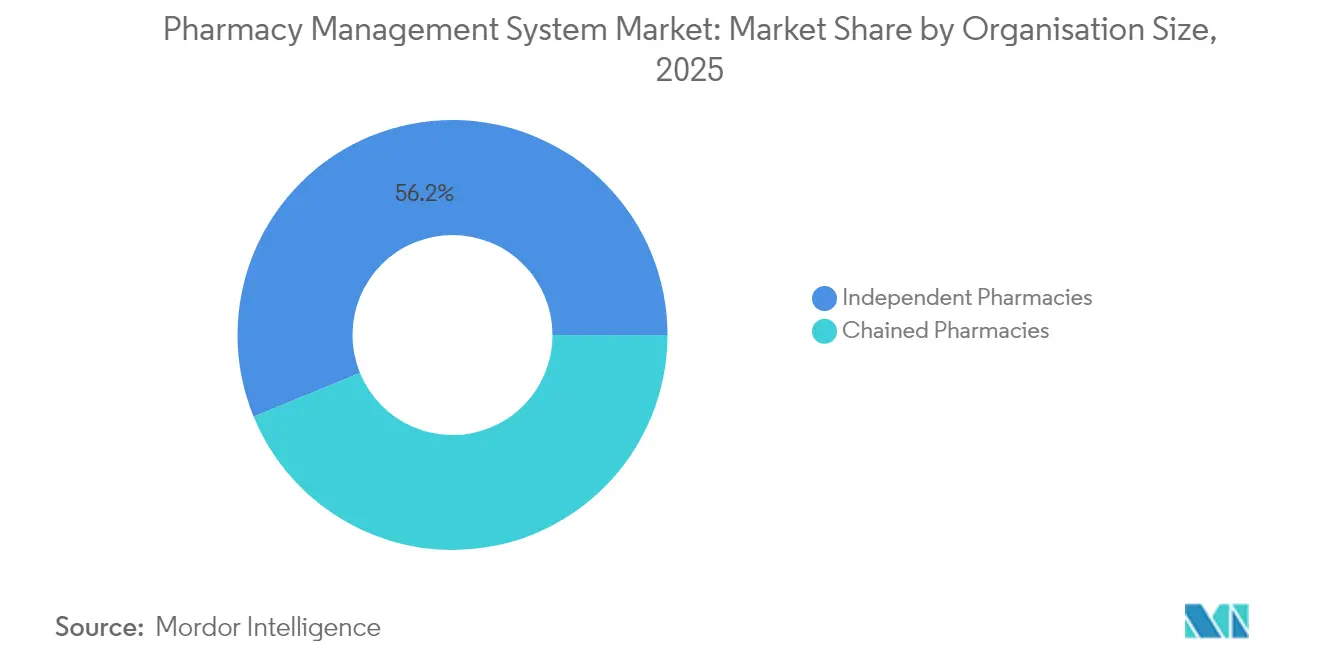
Independents commanded 56.20% of 2025 revenue, yet consolidation is unavoidable while payer reimbursement lags cost inflation and manual tasks drain margin. One proprietor shuttered daily in 2023, revealing fragile economics. Chains counter the headwinds through bulk purchasing and shared services, helping them register a 16.84% CAGR to 2031.
Co-operatives and buying groups equip single-site owners with shared cloud instances, lowering entry barriers to the pharmacy management system market. Chain operators meanwhile pour capital into robotics, predictive staffing, and preventive care programs that elevate brand perception. The divide pressures software vendors to craft tiered offerings—lightweight for small shops and enterprise-grade for multi-state networks.
By End-User Industries – Retail Still Rules, Specialty Surges
Retail and community locations produced 43.95% of 2025 turnover, confirming that corner stores remain the first touchpoint for everyday ailments . They require point-of-sale, OTC catalog, and vaccination modules in a single interface so staff can pivot swiftly between tasks. Long-term-care and specialty providers, advancing at a 14.96% CAGR, demand regimented dosing schedules, cold-chain monitoring, and payer-specific adherence reports.
Higher-acuity therapies invite tighter oversight and clinical note capture inside the pharmacy management system market. Vendors now integrate medication administration records with patient education and courier routing to ensure temperature control. Hospital pharmacies focus on closed-loop medication administration that mates with electronic health records, cutting adverse events and shortening stays .
Geography Analysis
North America Pharmacy Management System Market
North America’s dominance rests on mature insurance markets, sizable chain footprints, and regulators that mandate electronic checks at every dispense. U.S. initiatives to combat opioid misuse spur uptake of real-time prescription monitoring, while Canada’s universal coverage highlights the need for cost-efficient refill coordination. Recent DEA alerts about EHR fraud accelerate investments in audit trails and multifactor authentication. Venture funding also flows into AI start-ups that promise workflow relief, widening the technology gap between modern and legacy stores.
APAC Pharmacy Management System Market
Asia-Pacific records the fastest trajectory as China, India, and Indonesia upgrade primary-care delivery and digitize supply chains. National e-health blueprints channel subsidies into cloud-ready software so rural clinics share records with urban hospitals. Japan’s rapidly aging population sharpens focus on medication adherence apps that integrate with dispensing platforms. Multinational chains entering Southeast Asia insist on enterprise systems that mirror their Western operations, fueling demand within the pharmacy management system market.
Europe Pharmacy Management System Market
Europe sits between these extremes. Harmonized EMA guidelines push pharmacies to track serial numbers and report adverse events uniformly across borders. Brexit introduces extra customs documentation, encouraging British outlets to automate replenishment and regulatory filings. Scandinavian markets, long early adopters of e-prescription, now upgrade to AI-enabled forecasting that offsets higher labor costs. Throughout the continent, privacy regulations such as GDPR favor vendors that offer fine-grained consent management.

Regulatory Landscape
Regulation for pharmacy management systems centers on electronic records integrity, controlled-substance e-prescribing, and interoperability requirements that make audit trails, identity controls, and secure data exchange core product features. In the United States, systems that support electronic controlled-substance prescriptions align to DEA e-prescribing requirements (21 CFR Part 1311), while broader electronic record and signature controls are shaped by frameworks such as 21 CFR Part 11. These controls raise the bar for time-stamping, access management, and tamper-evident logging across dispensing workflows. Payer-driven e-prescribing specifications also influence configuration, with CMS e-prescribing standards commonly implemented through NCPDP SCRIPT alongside formulary and benefit transactions.
Across other major regions, governments and regulators are tightening digital pharmacy and traceability requirements that feed directly into PMS data models and integrations. The UK updated pharmacy services regulations through the NHS-related Miscellaneous Amendments that came into force on October 1, 2025, increasing emphasis on compliant digital dispensing and service delivery reporting. China issued a revised set of Regulations on the Implementation of the Drug Administration Law (State Council Decree No. 828), effective May 15, 2026, which includes unified drug traceability requirements and pushes dispensers and their software vendors toward standardized tracking and reporting. Nigeria also launched Electronic Pharmacy (e-Pharmacy) Regulations, 2026, creating a formal compliance framework for licensed digital pharmacy operations, prescription management, and data security. In Europe, the medicines network continues shifting toward structured medicinal product data and interoperability via ISO IDMP-aligned initiatives, raising expectations for standardized master data handling and exchange.
Value Chain Analysis
The pharmacy management system value chain begins with software design and productization (workflow, claims, inventory, e-prescribing, compliance modules) and extends to cloud infrastructure providers and security tooling that support hosting, identity, monitoring, and data retention. Implementation partners and internal IT teams then carry out configuration, data migration, validation, and integrations to upstream and downstream parties such as EHRs, prescribers, wholesalers, and payer/PBM systems. Pharmacies (independent, chain, hospital, long-term-care, and specialty) operationalize the platform across dispensing, billing, and clinical documentation after go-live. Ongoing value creation shifts to upgrades, managed services, analytics tuning, cybersecurity hardening, and interoperability maintenance as standards and payer requirements change.
Distribution and supply connectivity are critical because drug procurement and availability influence pharmacy workflow and inventory decisions. In the United States, distributors are a dominant channel for prescription pharmaceutical flow, which makes integration to distributor catalogs, contract pricing, and ordering systems central to PMS performance. Common friction points include complex data migration from legacy deployments, proprietary integration patterns that increase switching costs, alert fatigue from excessive clinical and operational notifications, and affordability constraints for small independents. Traceability compliance also propagates through the chain as dispensers prepare for DSCSA-driven interoperable electronic workflows through November 2026, encouraging more native serialization, EPCIS-oriented data exchange, and fewer middleware reconciliation steps. Recent vendor activity in adjacent pharmacy ERP and supply intelligence tools, including RxERP releasing serialized ERP capabilities (April 2026) and SureCost updating a centralized supply intelligence workflow integrating purchasing, inventory, and shortage insights (June 2026), points to tighter PMS-to-procurement-to-traceability linkage.
Competitive Landscape
Competition remains moderately fragmented. Large healthcare IT players McKesson, Omnicell, and Oracle Health bundle dispensing, supply chain, and analytics features to hold enterprise contracts. Mid-tier specialists such as ScriptPro focus on robotics, while RedSail Technologies courts independents with cloud POS and adherence modules. Technology edge now outweighs storefront count; buyers prioritize AI decision support, open APIs, and cybersecurity credentials when selecting platforms.
Consolidation is quickening as incumbents grab niche innovators. BD’s USD 1.548 billion take-over of Parata Systems brought robotic fulfillment under its medication management umbrella [4]Becton, Dickinson and Company, “10-K 2024,” bd.com. Innovaccer’s purchase of Pharmacy Quality Solutions delivered performance metrics covering 95% of community outlets, expanding value-based care analytics. Private-equity group Sycamore Partners agreed to acquire Walgreens Boots Alliance for USD 23.7 billion, a move expected to pump capital into automation across thousands of stores.
AI and cloud newcomers challenge long-standing brands. Asepha drew USD 4 million in July 2025 to refine machine-learning models that cut verification time by 40%. PQS launched EQUIPP Copilot to surface performance gaps in real time, giving community pharmacies insights typically reserved for larger chains. Vendors able to interoperate with payer portals, telehealth apps, and smart-device sensors win share as healthcare delivery converges.
Pharmacy Management System Industry Leaders
McKesson Corporation
Cerner Corporation
Becton Dickinson and Co.
GE Healthcare Inc.
Omnicell, Inc.
- *Disclaimer: Major Players sorted in no particular order

Pharmacy Management System Market Companies Covered in this Report
- McKesson Corporation
- Omnicell, Inc.
- Cerner Corporation
- Becton, Dickinson and Company
- GE HealthCare Technologies Inc.
- Talyst Systems, LLC
- Epicor Software Corporation
- Allscripts Healthcare Solutions, Inc.
- ACG Infotech Ltd.
- Clanwilliam Health Ltd.
- DATASCAN (DCS Pharmacy, Inc.)
- GlobeMed Ltd.
- Health Business Systems, Inc.
- Idhasoft Ltd.
- MedHOK, Inc.
- PioneerRx, LLC
- QS/1 Data Systems, LLC (RedSail Technologies)
- ScriptPro LLC
- Liberty Software, Inc.
- Computer-Rx, Inc.

Market Opportunities and Future Outlook
Compliance-driven interoperability and traceability create near-term whitespace for platforms that reduce integration burden while meeting audit requirements across dispensing, procurement, and reporting. In the United States, DSCSA milestones extending through November 2026 raise demand for interoperable electronic traceability workflows, pushing pharmacies to connect PMS, wholesaler ordering, and serialized inventory data using standards-oriented exchange (for example, EPCIS-aligned data sharing). Vendors that package migration utilities, validation tooling, and prebuilt connectors to EHR and wholesaler ecosystems address persistent blockers such as legacy lock-in and fragmented interfaces, particularly for independents that need subscription deployment models and managed security.
Enterprise cloud and AI programs are also translating into real buying and build activity, especially in specialty pharmacy, hospital networks, and multi-site operators that need unified medication data and scalable infrastructure. In February 2026, Inovalon expanded collaboration with Oracle to scale its ScriptMed specialty pharmacy software on Oracle Cloud Infrastructure using Oracle Autonomous AI Database, highlighting a push toward cloud-native performance and data unification for complex pharmacy operations. In June 2026, System C advanced a national agreement to deploy CareFlow Pharmacy across Republic of Ireland hospitals, with a 2026 rollout plan spanning multiple sites, which underscores opportunities in national or multi-hospital standardization where integration, change management, and ongoing optimization services are part of the purchase. Investment in AI-enabled pharmacy operations is also visible in initiatives such as Evernorths Pharmacy Forward for Accredo Specialty Pharmacy (announced June 2026 with a USD 100 million investment through 2028), reinforcing demand for PMS-adjacent analytics and workflow automation that can be operationalized at scale rather than limited to pilots.
Recent Industry Developments in Pharmacy Management System Market
- May 2026: BD partnered with Wellstar Health System to connect BD Pyxis Pro medication dispensing with BD Alaris infusion systems as part of a more integrated pharmacy-to-bedside medication workflow. The move reinforces demand for pharmacy platforms that can unify data across dispensing and infusion devices and support closed-loop medication management initiatives within health systems.
- December 2025: Omnicell launched Titan XT, an enterprise-scale automated dispensing system powered by the OmniSphere cloud-based platform, extending medication inventory control into nursing care areas. This broadens the addressable scope for pharmacy management platforms from central pharmacy operations to decentralized care settings where real-time inventory visibility and governance are required.
- December 2024: Omnicell introduced OmniSphere, a cloud-native software and data platform designed to integrate pharmacy robotics and smart devices for end-to-end medication management. The platform direction signaled a shift toward cloud-first architecture and data-layer consolidation, raising competitive emphasis on interoperability, device connectivity, and analytics across multi-site deployments.


Pharmacy Management System Market Report Scope and Research Methodology
Market Definition and Coverage
This market covers the revenue generated from pharmacy management system software and related services used to run day to day pharmacy workflows, like prescription processing, inventory control, billing, reporting, and compliance support, across retail and hospital pharmacy settings.
Scope exclusions: It excludes general hospital electronic health record systems that do not include pharmacy management functionality, and it also excludes pure drug distribution and wholesaling revenue.
Segments Covered in This Report
- By Component
- Solutions
- Inventory Management
- Purchase Order Management
- Supply-Chain Management
- Regulatory and Compliance Information
- Clinical and Administrative Performance
- Other Solutions
- Services
- Solutions
- By Deployment
- Cloud-based
- On-premise
- By Organisation Size
- Independent Pharmacies
- Chained Pharmacies
- By End-User Industries
- Hospital Pharmacies
- Retail/Community Pharmacies
- Long-term-care and Specialty Pharmacies
- By Geography
- North America
- United States
- Canada
- Mexico
- Europe
- United Kingdom
- Germany
- France
- Italy
- Rest of Europe
- Asia-Pacific
- China
- Japan
- India
- South Korea
- Rest of Asia-Pacific
- Middle East
- Israel
- Saudi Arabia
- United Arab Emirates
- Turkey
- Rest of Middle East
- Africa
- South Africa
- Egypt
- Rest of Africa
- South America
- Brazil
- Argentina
- Rest of South America
- North America
Data Sources, Market Sizing, and Validation
Desk Research
Desk work starts with building a clean fact base on pharmacies, prescriptions, and health IT adoption, because these are the demand anchors for pharmacy software spend. We usually lean on public sources such as the US Centers for Medicare and Medicaid Services, the US Food and Drug Administration drug databases and safety notices, the Centers for Disease Control and Prevention, and national statistics portals that publish health expenditure and provider counts.
To ground the commercial side, we also review company annual reports, earnings call transcripts, and investor presentations, followed by pharmacy and health IT association sites and reputable press coverage. For cross checks on company footprints, product launches, and patent activity, we also use a paid subscription for company financials and intelligence plus a patent database, which helps avoid double counting when vendors bundle modules. This list is not exhaustive, and many other public and paid sources were also referenced for data collection, validation, and clarification.
Primary Interviews and Surveys
Primary work focuses on speaking with software suppliers, channel partners, and pharmacy operators to confirm what is actually purchased, how contracts are priced, and where module adoption is accelerating. We also use these discussions to test assumptions on cloud migration, service attach rates, and replacement cycles across APAC, EMEA, and the Americas, so the model reflects real buying behavior.
Distribution of primary research fieldwork respondents
| Company type | Respondent position | Region |
|---|---|---|
| Top tier: 30% | CXOs: 18% | APAC: 46% |
| Mid tier: 52% | Functional/Unit leaders: 35% | EMEA: 36% |
| Smaller Players: 18% | Managers: 47% | Americas: 18% |
Market-Sizing & Forecasting
The sizing model uses a top-down approach, where pharmacy and healthcare IT spending signals are reconstructed into an addressable pool for pharmacy management workflows, and then filtered by adoption and replacement behavior. After that, we corroborate totals with selective bottom-up approximations, such as sampled vendor revenue disclosures, channel checks on average contract values, and volume based logic linked to pharmacy locations and prescription throughput.
Key inputs include the number of retail and hospital pharmacies, prescription volume trends, the share of pharmacies using integrated dispensing and billing software, cloud deployment penetration, average software and service price progression, and typical renewal and upgrade cycles. When a data point is missing for a country, the gap is handled through proxy ratios from similar markets, and then adjusted after interviews confirm whether operations and pricing are comparable.
For forecasting, scenario analysis is used so we can separately test the impact of cloud migration speed, regulatory and compliance workload, and labor pressure that pushes automation. The final trajectory is then aligned to what practitioners expect for budget growth and refresh timing, keeping the forecast anchored in observable purchase patterns rather than only extrapolating trends.
Data Validation & Update Cycle
Validation checks whether the implied spend per pharmacy and spend per prescription looks reasonable across regions, and then compares the outputs with independent indicators like healthcare IT budgets and software subscription growth patterns. If any country level output shows a sharp jump or a flatline that is not supported by the signals, the assumption set is rechecked, and a follow up call is triggered to confirm what changed.
Before sign off, the model goes through multiple analyst reviews to ensure calculation logic, currency conversions, and scope boundaries are consistent across years. The study is refreshed annually, and interim updates are added when material events occur, such as major reimbursement policy changes or large scale technology rollouts. Right before delivery, we run a final review pass so clients receive the most current view.
Mordor Intelligence's Pharmacy Management System Market Sizing Compared With Other Published Estimates
It is normal to see different market sizes for pharmacy management systems because publishers do not always count the same products, end users, or contract revenue lines. Differences also come from how fast cloud subscriptions are assumed to replace on-premise licenses, and how service revenue is treated inside multi-year agreements.
By tracking module level inclusion rules and refreshing currency timing assumptions, Mordor Intelligence keeps the count focused on pharmacy workflow software plus related services, while some estimates also fold in broader hospital IT or adjacent revenue cycle tools that sit outside a pharmacy system. We also see gaps when one source uses aggressive cloud penetration curves without validating renewal behavior, which can lift the near-term value.
Benchmark comparison
| Source | Market Size | Gaps in Research Methodology |
|---|---|---|
| Mordor Intelligence | USD 116.45 B (2026) | |
| Industry Publisher A | USD 73.50 B (2023) | Uses an earlier base year and a slower growth path, and its scope appears to group deployment and end-user mixes differently, which can understate cloud subscription uplift in later years. |
| Research Publisher B | USD 72.56 B (2023) | Includes a wider set of pharmacy related software types and support items, and it applies a different CAGR window, which shifts how quickly pricing and adoption are assumed to rise. |
The comparison shows that the spread is mainly explained by the year used for anchoring, what is counted as a pharmacy system versus adjacent tools, and the growth curve used for cloud and services. Our estimate stays traceable because each step ties back to pharmacy activity signals, pricing logic, and interview checks that make assumptions easier to audit and repeat.


Key Questions Answered in the Report
What is the current pharmacy management system market size and its expected growth?
The pharmacy management system market size is USD 116.45 billion in 2026 and is forecast to reach USD 236.28 billion by 2031 at a 15.22% CAGR.
Which deployment model leads the market?
Cloud platforms lead with 62.85% share in 2025 and are expanding fastest at a 17.18% CAGR thanks to scalability and lower upfront cost.
Why are independent pharmacies investing in management systems despite tight margins?
They need automation to counter reimbursement cuts and workload spikes; without technology, independents risk closure as seen in the 2023 shutdown rate of one store per day in the United States.
What role does AI play in pharmacy operations?
AI cuts inventory investment by around 20%, automates fulfillment hubs, and surfaces adherence risks, producing measurable cost savings and service improvements.
Page last updated on:


 Your data is secure and never sold or shared.


