Pharmaceutical Cartridges Market Size and Share
Market Overview
| Study Period | 2020 - 2031 |
|---|---|
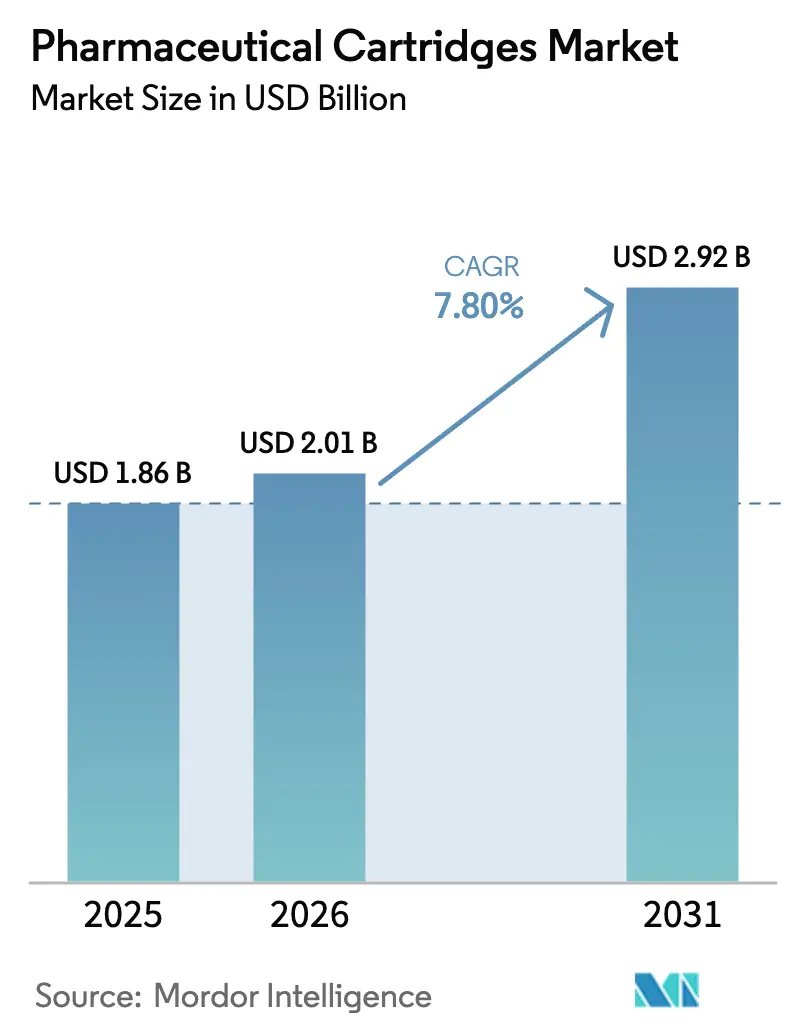
| Market Size (2026) | USD 2.01 Billion |
| Market Size (2031) | USD 2.92 Billion |
| Growth Rate (2026 - 2031) | 7.80% CAGR |
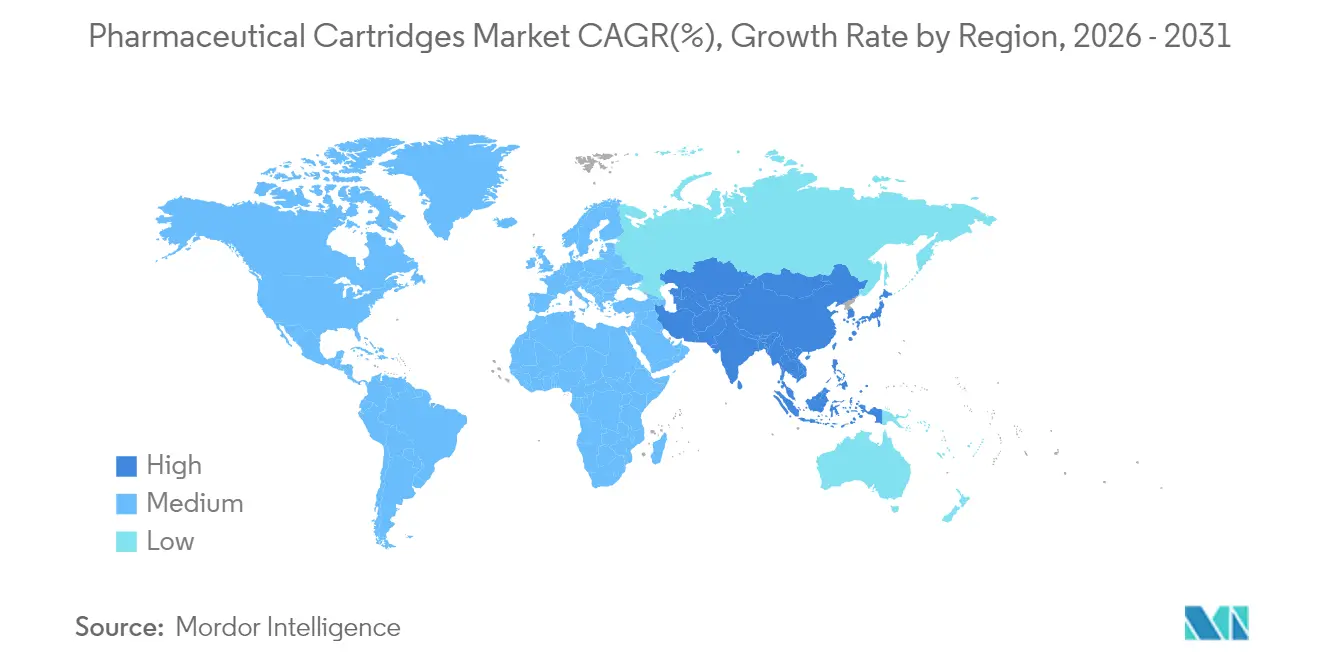
| Fastest Growing Market | Asia Pacific |
| Largest Market | North America |
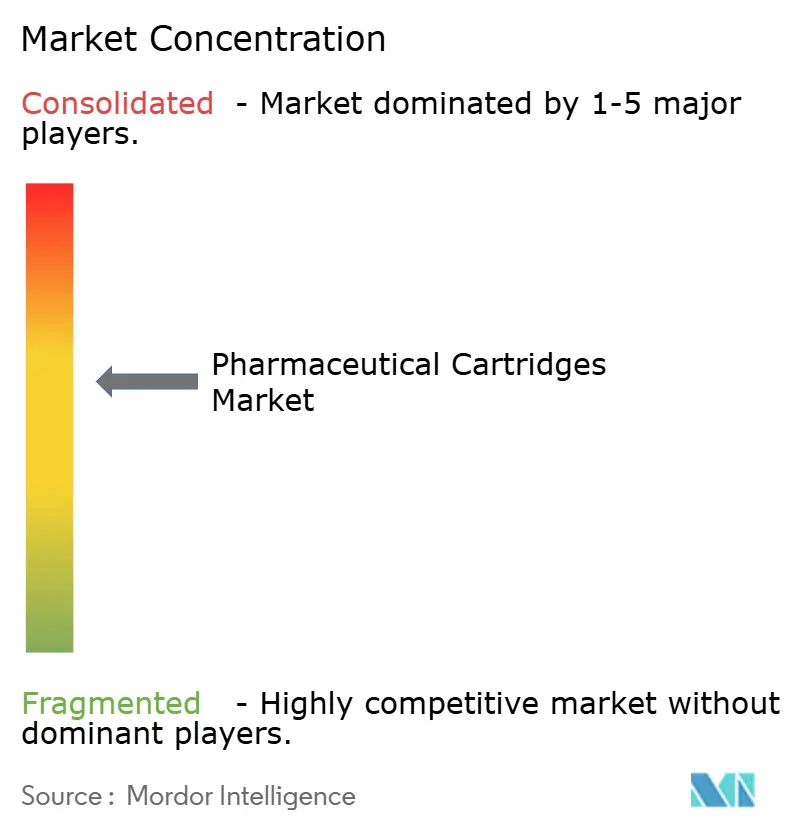
| Market Concentration | Medium |
Major Players
*Disclaimer: Major Players sorted in no particular order Image © Mordor Intelligence. Reuse requires attribution under CC BY 4.0. |
|
Pharmaceutical Cartridges Market Analysis by Mordor Intelligence
The pharmaceutical cartridge market size is expected to grow from USD 1.86 billion in 2025 to USD 2.01 billion in 2026 and is forecast to reach USD 2.92 billion by 2031 at 7.80% CAGR over 2026-2031. Growth rests on a decisive shift toward self-administered biologics, high-viscosity GLP-1 therapies, and the wider use of large-volume subcutaneous delivery devices that let patients treat chronic diseases at home. Regulatory convergence, especially the European Union’s revised Annex 1 sterility rules, is steering manufacturers toward ready-to-use (RTU) cartridges that remove costly washing and depyrogenation stages, while AI-driven fill-finish automation cuts glass breakage and halves false rejects. Glass remains the preferred material, yet engineering plastics such as COC and COP are advancing fastest thanks to break resistance and chemical compatibility. Demand is strongest in diabetes but oncology now posts the quickest rise as antibody-drug conjugates migrate to cartridge formats, and North America continues to hold the largest regional share, buoyed by multibillion-dollar capacity expansions.
Key Report Takeaways
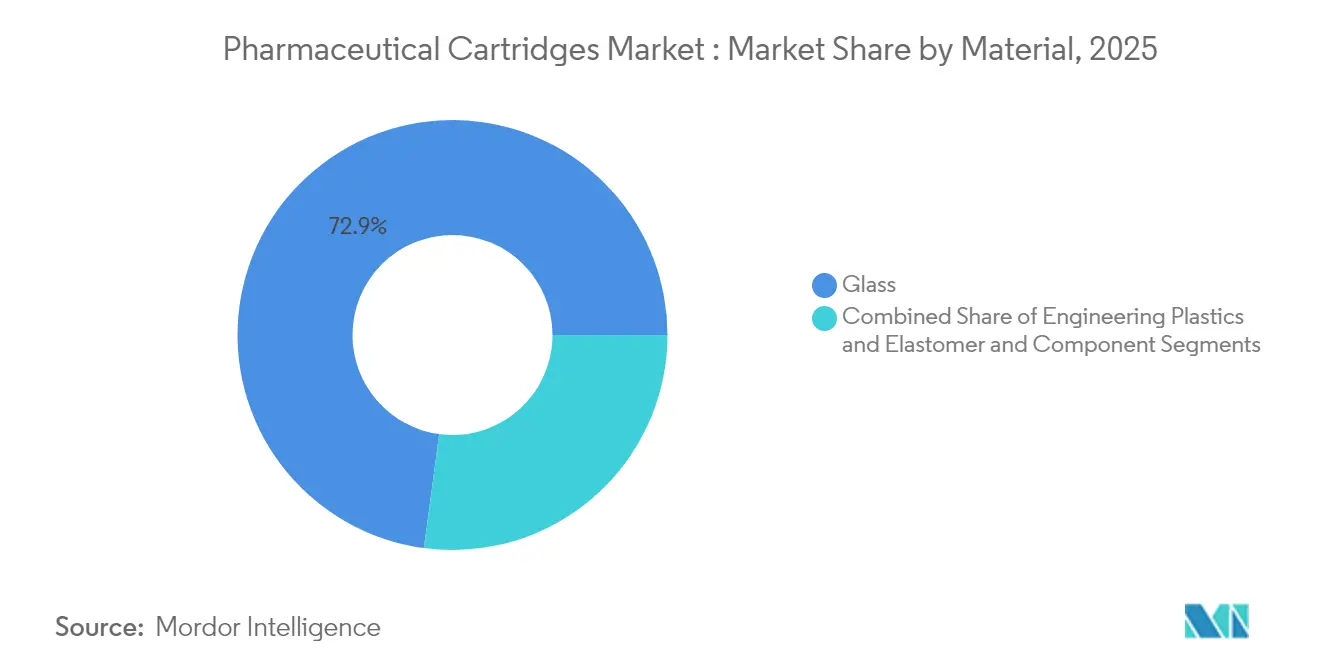
- By material, glass held 72.88% of pharmaceutical cartridge market share in 2025, while engineering plastics are forecast to record a 11.71% CAGR through 2031.
- By delivery-device compatibility, reusable pen injectors led with 43.55% revenue share in 2025; wearable on-body pumps are expected to scale at an 10.98% CAGR to 2031.
- By capacity, cartridges below 3 mL accounted for 40.92% of pharmaceutical cartridge market size in 2025, whereas devices above 10 mL are projected to grow at a 9.86% CAGR during 2026-2031.
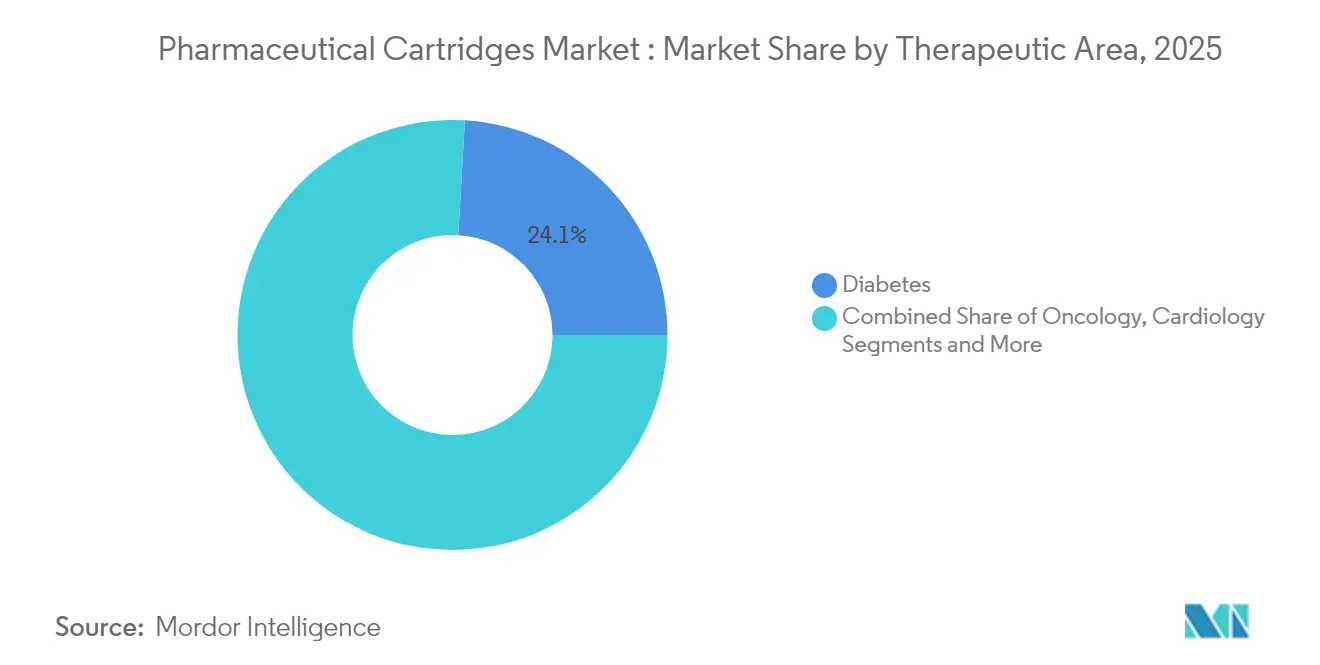
- By therapeutic area, diabetes dominated with 24.08% share of pharmaceutical cartridge market size in 2025; oncology is anticipated to expand at 14.12% CAGR through 2031.
- By end user, pharmaceutical companies represented 59.05% of demand in 2025, yet CMOs/CDMOs are forecast to post the highest 11.32% CAGR to 2031.
- By geography, North America captured 38.21% pharmaceutical cartridge market share in 2025, while Asia Pacific is set to increase the fastest at 9.84% CAGR to 2031.
Note: Market size and forecast figures in this report are generated using Mordor Intelligence’s proprietary estimation framework, updated with the latest available data and insights as of 2026.
Global Pharmaceutical Cartridges Market Trends and Insights
Drivers Impact Analysis*
| Driver | (~) % Impact on CAGR Forecast | Geographic Relevance | Impact Timeline |
|---|---|---|---|
| Rising demand for self-injection pen and wearable injector formats | +1.8% | Global, most pronounced in North America and Europe | Medium term (2-4 years) |
| Shift of GLP-1 obesity and high-viscosity biologics to cartridge delivery | +2.1% | Global, led by North America, spreading to Asia Pacific | Short term (≤ 2 years) |
| Emergence of large-volume wearable on-body injector cartridges (≥ 10 mL) | +1.2% | North America and Europe, early uptake in Asia Pacific | Medium term (2-4 years) |
| EU MDR Annex 1 sterility rules spurring RTU cartridge adoption | +0.9% | Primarily Europe, with global regulatory spillover | Short term (≤ 2 years) |
| AI-driven fill-finish automation cutting glass breakage and scrap | +0.7% | Global, focused in advanced manufacturing hubs | Long term (≥ 4 years) |
| UDI-enabled smart laser-marked glass for traceability | +0.5% | Global, regulation-driven | Medium term (2-4 years) |
| Source: Mordor Intelligence | |||
Rising Demand for Self-Injection Pen and Wearable Injector Formats
Pen injectors and wearable pumps now anchor patient-centred treatment, letting individuals administer chronic therapies without clinic visits. Ypsomed sold over 12 million reusable pens and 1.7 billion prefilled pens in 2024, underscoring adoption scale. With roughly 500 million people living with type 2 diabetes and 1 billion affected by obesity, user-friendly devices that support frequent dosing have become essential. Clinical work shows subcutaneous injections up to 10 mL win 79% patient acceptance and pain returns to baseline within 30 minutes, so expanding cartridge volumes meets consumer comfort thresholds.[1]Wendy D. Woodley, “Clinical Evaluation of Large Volume Subcutaneous Injection Tissue Effects, Pain, and Acceptability in Healthy Adults,” Clinical and Translational Science, ascpt.onlinelibrary.wiley.comConnected pens now log dosing data for adherence monitoring, turning delivery hardware into real-world evidence tools that strengthen pharma value propositions. The trend adds steady volume to the pharmaceutical cartridge market as home therapy shifts from exception to norm.
Shift of GLP-1 Obesity and High-Viscosity Biologics to Cartridge Delivery
GLP-1 receptor agonists have become the fastest-growing pharmaceutical class and their migration from diabetes into obesity care drives new cartridge orders. West Pharmaceutical Services secured multiyear elastomer deals chiefly aimed at this vertical, with self-injection products already forming 73% of its proprietary segment sales. To handle formulations thicker than 15 cP, BD partnered with Ypsomed to pair Neopak XtraFlow glass syringes with autoinjectors, ensuring smooth subcutaneous delivery. Patent reviews show 57% of GLP-1 filings address delivery mechanisms rather than molecules, revealing competitive moats that could slow generic erosion while keeping cartridge demand high. Reloadable autoinjectors are surfacing as greener, lower-cost alternatives, but they still rely on rugged cartridges engineered for multiple actuations. These developments are injecting urgency into capacity build-outs across the pharmaceutical cartridge market.
Emergence of Large-Volume Wearable On-Body Injector Cartridges (≥ 10 mL)
Wearable injectors unlock subcutaneous delivery of biologics previously relegated to intravenous infusions. Stevanato Group’s Vertiva 10 mL platform exemplifies this direction, matching extended delivery windows for high-dose therapeutics. Trials show 5 mL wearables achieve 93.2% localization in target tissue with strong user acceptance. Ultra-thin cannulas that widen the lumen by 30% cut delivery times for thick solutions, addressing viscosity challenges.[2]Bruce C. Roberts, “Novel Cannula Design Improves Large Volume Auto-Injection Rates for High Viscosity Solutions,” PubMed, pubmed.ncbi.nlm.nih.gov Pipeline reviews list 182 large-volume subcutaneous biologics, with oncology doses often spanning 5-20 mL versus ≤ 5 mL for non-cancer use. Different dose bands demand specific cartridge geometries, reinforcing the need for versatile manufacturing lines within the pharmaceutical cartridge market.
EU MDR Annex 1 Sterility Rules Spurring RTU Cartridge Adoption
The 2023 Annex 1 revision broadened sterile-manufacturing guidance from 16 to 58 pages. Requirements for barrier technologies and Pre-Use Post-Sterilization Integrity Testing (PUPSIT) increase complexity for traditional wash-sterilize lines, prompting a shift to RTU cartridges that arrive sterile and ready for filling. RTU systems eliminate multiple processing stages, cut contamination risk, and boost line throughput.[3]Tina Morris, “PUPSIT and the Annex 1 Revision,” PDA, pda.org A consortium between SCHOTT Pharma, Gerresheimer, and Stevanato Group aims to standardize RTU formats, reflecting collective recognition that regulatory pressure now favours pre-sterilized containers. As firms standardize global production on the most stringent rules, Annex 1 is indirectly lifting RTU adoption rates worldwide, adding premium value to the pharmaceutical cartridge market.
Restraints Impact Analysis*
| Restraint | (~) % Impact on CAGR Forecast | Geographic Relevance | Impact Timeline |
|---|---|---|---|
| Complex multi-step manufacturing and stringent cGMP validation | -1.4% | Global, accentuated in strict jurisdictions | Long term (≥ 4 years) |
| Substitution risk from pre-filled syringes in ≤ 3 mL range | -0.8% | Global, notably in well-established therapies | Medium term (2-4 years) |
| Global borosilicate tubing shortages tied to solar-glass demand | -0.6% | Worldwide supply chains, acute in Asia Pacific | Short term (≤ 2 years) |
| Rising investment in needle-free micro-array patches | -0.4% | North America and Europe R&D hubs, global diffusion | Long term (≥ 4 years) |
| Source: Mordor Intelligence | |||
Complex Multi-Step Manufacturing and Stringent cGMP Validation
Cartridge fabrication requires precision tolerances for break-loose force, glide force, and plunger travel. USP <382> now mandates container-closure system testing rather than individual component checks, adding fresh validation layers. Development cycles can lengthen 12-18 months as each variable undergoes statistical validation. AI tools add transparency demands because regulators want algorithm logic alongside performance metrics. High-grade cleanrooms, barrier isolators, and validated depyrogenation ovens raise capital thresholds, deterring new entrants and slowing capacity additions within the pharmaceutical cartridge market.
Substitution Risk from Pre-Filled Syringes in ≤ 3 mL Range
Small-volume drugs may stay with syringes that offer lower unit costs and turnkey filling solutions. Therapies such as anticoagulants and growth hormones already use 1-3 mL syringes, and switching to cartridges offers limited clinical upside. Drug sponsors often prefer to leverage existing syringe lines rather than invest in fresh cartridge tooling unless viscosity or patient-centric features demand change, tempering growth for that capacity band.
*Our forecasts treat driver/restraint impacts as directional, not additive. The impact forecasts reflect baseline growth, mix effects, and variable interactions.
Segment Analysis
By Material: Glass Dominance Faces Engineering Plastics Challenge
Glass held 72.88% of overall pharmaceutical cartridge market share in 2025, reflecting decades of regulatory confidence and its inert, transparent nature. The segment benefits from broad line compatibility and ample legacy tooling across fill-finish sites. Engineering plastics, notably COC and COP, are rising at a 11.71% CAGR because they resist breakage and tolerate high-pH biology, advantageous for novel oncology agents. Regulatory endorsement arrived when TOPAS Advanced Polymers secured the first USP 661.1 compliance for cyclic olefins.
Pharmaceutical cartridge industry players invest in polymer lines that match glass output speeds, but glass suppliers reply with strengthened borosilicate such as SCHOTT EVERIC to cut cosmetic rejects. Oncology pipelines that require cryogenic storage lean toward polymer because its seal integrity outperforms glass at low temperatures. Sustainability debates add tension; polymers allow energy-lite molding, while glass touts proven recyclability. Competition will intensify as both camps market advanced coatings and siliconization upgrades to capture share within the pharmaceutical cartridge market.


By Delivery-Device Compatibility: Wearable Systems Disrupt Pen Dominance
Reusable pen injectors secured 43.55% of pharmaceutical cartridge market size in 2025, entrenched by decades of insulin therapy familiarity. Yet wearable on-body pumps are forecast to grow 10.98% CAGR through 2031 because they house 5–10 mL cartridges that deliver weekly GLP-1 or oncology biologics at home. BD Libertas wearable injectors proved subcutaneous delivery for agents up to 50 cP, confirming technical readiness.
Device makers now forge multi-supplier networks ensuring glass and elastomer fit across platforms, as Ypsomed coordinates more than 15 partners to secure global inventory. Gas-driven drivers and AI-monitored actuation force replace traditional springs to handle viscous drugs safely. Autoinjectors targeting 5.5 mL volumes arrive from Aktiv Medical Systems, pointing to higher-dose standards. These changes expand choice and lift the overall pharmaceutical cartridge market.
By Capacity: Large-Volume Cartridges Drive Innovation
Cartridges under 3 mL held 40.92% pharmaceutical cartridge market share in 2025 owing to long-standing diabetes and hormone products. The pharmaceutical cartridge market size for containers above 10 mL is predicted to rise at 9.86% CAGR because high-dose biologics now shift to subcutaneous wearables. Stevanato Group’s portfolio spans 5–50 mL, proving scale flexibility.
Clinical data show 10 mL injections meet tolerance thresholds when delivered over several minutes, so device makers optimize flow via ultra-thin cannulas. Larger cartridges demand stronger glass and refined silicon layers to prevent breakage during shipping. Filling lines adjust stopper insertion force and venting parameters for bigger internal volumes. These technical revisions support broader therapy scope and deepen penetration of large-format segments across the pharmaceutical cartridge market.
By Therapeutic Area: Oncology Growth Challenges Diabetes Leadership
Diabetes represented 24.08% of pharmaceutical cartridge market size in 2025, propelled by insulin and, increasingly, dual usage of GLP-1 agents for weight control. Oncology is poised for 14.12% CAGR, the fastest among all segments. Antibody-drug conjugates and checkpoint inhibitors now launch in high-concentration forms suitable for 5–10 mL cartridges, letting patients avoid infusion suites.
Immunology remains sizeable as adalimumab biosimilars reinforce self-administered models. Respiratory biologics targeting severe asthma, ophthalmic anti-VEGF treatments, and novel neurology injections further extend cartridge use. Polymer containers that tolerate cryogenic storage address gene and cell therapy vectors. As personalized medicine grows, precision-filled cartridges support micro-batch production, enhancing the pharmaceutical cartridge market outlook.
By End User: CMO Outsourcing Reshapes Manufacturing
Pharmaceutical companies commanded 59.05% of demand in 2025 through direct oversight of proprietary products and capacity investments. CMOs/CDMOs, however, show the strongest 11.32% CAGR as drug developers outsource sterile assembly to specialized partners. PCI Pharma Services allocated USD 365 million across US and EU sites for drug-device packaging.
Resilience plans to fill up to 200 million cartridges yearly by 2025 after its USD 225 million Cincinnati upgrade. Asia Pacific CDMOs attract volume through cost advantages and PIC/S GMP alignment, with Terumo expanding its cartridge assembly services. This outsourcing trend boosts flexibility, lifts smaller biotech launches, and supports sustained growth of the pharmaceutical cartridge market.
Geography Analysis
North America held 38.21% pharmaceutical cartridge market share in 2025 backed by heavy capital projects such as Novo Nordisk’s USD 4.1 billion fill-finish campus and SCHOTT Pharma’s USD 371 million polymer syringe plant in North Carolina. FDA encouragement of advanced manufacturing accelerates AI and modular isolator uptake, positioning the region as a global benchmark for next-gen production.
Europe follows closely owing to Annex 1 sterility reforms that push RTU adoption. Stevanato Group’s new Cisterna di Latina facility adds regional capacity for EZ-fill cartridges, aligning with the EU Critical Medicines Act that seeks supply-security via local output. Joint clinical-assessment rules and the forthcoming Health Technology Assessment Regulation unify demand, favouring suppliers with proven conformity across multiple markets.
Asia Pacific is forecast to grow 9.84% CAGR through 2031, the fastest worldwide. India’s Kapoor Glass exports 90% of its cartridge output to Western clients, underpinning the region’s cost-efficient manufacturing base. Regulatory harmonization through the Asia Partnership Conference of Pharmaceutical Associations sparks smoother cross-border approvals. Countries like South Korea and Singapore nurture biotech hubs, while China’s expanding biologics sector heightens need for high-quality containment. Collectively these initiatives cement Asia Pacific as a pivotal growth engine for the pharmaceutical cartridge market.

Competitive Landscape
The pharmaceutical cartridge market remains moderately fragmented. Stevanato Group, SCHOTT AG, and West Pharmaceutical Services anchor the top tier through vertical integration that merges cartridge manufacture, filling, and device assembly. Their alliance on RTU standards unites expertise and accelerates regulatory acceptance. Glass suppliers pursue coating and laser-marking innovations, whereas plastics specialists extend cleanroom molding capacity to win oncology contracts.
Patents cluster around delivery mechanisms, especially GLP-1 autoinjectors, which safeguards incumbents and impedes new entrants. Disruptors include microneedle patch developers that promise needle-free biologic dosing, and engineering-plastics firms targeting break-proof oncology vials. BD’s integration of RFID chips into smart cartridges highlights differentiation via traceability. As pharma clients seek single-source partners, suppliers offering turnkey solutions enjoy a strategic edge, yet rising demand leaves room for niche specialists focusing on sustainability or smart packaging.
Pharmaceutical Cartridges Industry Leaders
-
Nipro Corporation
-
Gerresheimer AG
-
Stevanato Group
-
Schott AG
-
West Pharmaceutical Services
- *Disclaimer: Major Players sorted in no particular order

Recent Industry Developments
- January 2025: Aktiv Medical Systems entered a development agreement with a global pharmaceutical company to co-develop a high-concentration, large-dose autoinjector using its PenPal platform and a 5.5 mL glass cartridge.
- October 2024: BD and Ypsomed agreed to integrate the BD Neopak XtraFlow syringe with YpsoMate 2.25 autoinjector to deliver biologics thicker than 15 cP.
- September 2024: PCI Pharma Services committed USD 365 million to expand drug-device packaging capacity across Illinois and Ireland.
- June 2024: Novo Nordisk announced a USD 4.1 billion fill-finish expansion in Clayton, North Carolina, adding 1.4 million sq ft for injectable GLP-1 products.


Research Methodology Framework and Report Scope
Market Definitions and Key Coverage
Our study defines the pharmaceutical cartridges market as the global sales of pre-fillable cylindrical containers, primarily glass Type I or cyclic olefin polymer, that are integrated into pen injectors, autoinjectors, wearable pumps, and dental syringes to deliver precise doses of human medicines. These containers are treated as finished primary packaging and include associated plungers and seals when supplied as ready-to-use units.
Scope exclusion: veterinary drug, diagnostic reagent, and industrial adhesive cartridges remain outside the estimate.
Segmentation Overview
-
By Material
-
Glass
- Type I (Borosilicate)
- Type II (Soda-lime treated)
- Type III (Soda-lime)
-
Engineering Plastics
- COP/COC (Cyclic Olefin)
- PETG/Other Polymers
- Elastomers & Rubber Components
-
Glass
-
By Delivery-Device Compatibility
- Reusable pen injectors
- Disposable pen injectors
- Wearable on-body pumps
- Dental local-anaesthesia syringes
- Autoinjectors
-
By Capacity (mL)
- < 3
- 3 – 5
- 5 – 10
- > 10 (large-volume)
-
By Therapeutic Area
- Ophthalmology
- Respiratory
- Neurology
- Oncology
- Immunology (incl. mAbs)
- Cardiology
- Diabetes (insulins, GLP-1)
- Dental Anaesthesia
- Other Therapies
-
By End User
- Pharmaceutical Companies
- Biotechnology Firms
- CMOs / CDMOs
- Other End-users (animal health, dental clinics)
-
By Geography
-
North America
- United States
- Canada
- Mexico
-
Europe
- Germany
- United Kingdom
- France
- Italy
- Spain
- Rest of Europe
-
Asia-Pacific
- China
- Japan
- India
- Australia
- South Korea
- Rest of Asia-Pacific
-
Middle East and Africa
- GCC
- South Africa
- Rest of Middle East and Africa
-
South America
- Brazil
- Argentina
- Rest of South America
-
North America
Detailed Research Methodology and Data Validation
Primary Research
Structured interviews with cartridge converters, device engineers, CMOs, and hospital pharmacy heads across North America, Europe, and Asia clarified run-rate utilization, biologic viscosity limits, and emerging large-volume specifications. Survey feedback from endocrinologists and patient-advocacy nurses helped us calibrate adoption curves for GLP-1 pens and dual-chamber oncology injectors, reinforcing assumptions derived from desk findings.
Desk Research
Mordor analysts mapped demand drivers through open data from agencies such as the IDF (diabetes prevalence), WHO biologics pipeline dashboards, and Eurostat production indices, which clarify regional manufacturing footprints. Trade flows for HS codes 701090 and 392330 were gathered from UN Comtrade and Volza to size cross-border cartridge movements, while FDA 510(k) device clearances and EMA safety notices highlighted regulatory inflection points that sway material mix. Company 10-Ks and D&B Hoovers snapshots supplied pricing ranges and capacity additions. These examples illustrate only a part of the wider secondary source set consulted during desk work.
Continued desk work followed press releases, patent clusters flagged in Questel, and association white papers from PDA and ISPE that describe sterility shifts toward ready-to-use formats. The breadth of evidence ensures every variable is grounded in publicly traceable facts; however, numerous additional sources were also tapped for validation and gap filling.
Market-Sizing & Forecasting
A top-down construct began with regional insulin and biologic patient pools, overlaid with dose frequency to build a demand reservoir, which is then reconciled with sampled average selling price × volume roll-ups from leading converters to create a selective bottom-up cross-check. Key variables include Type I glass conversion yield, share of plastic COC formats, pen injector installed base, diabetes prevalence growth, and GLP-1 prescription volumes; each was trended through 2030. Forecasts employ multivariate regression blended with ARIMA smoothing, with elasticities vetted by our primary-research panel. Where supplier data were scarce, ranges were bridged using median ASP differentials observed in customs lines.
Data Validation & Update Cycle
Outputs pass variance screens versus historical trade, revenue, and prevalence series, followed by two-step peer review before sign-off. Reports refresh annually, and material events such as a major capacity shutdown trigger interim model tweaks so clients receive the up-to-date view.
Why Mordor's Pharmaceutical Cartridges Baseline Commands Reliability
Published figures often diverge because firms adopt different container scopes, therapeutic inclusions, and refresh cadences.
Key gap drivers include some publishers folding vials, ampoules, or veterinary cartridges into totals, others applying uniform ASP inflation without validating glass-to-polymer mix, and a few projecting demand straight from biologic revenues rather than physical dose counts. Mordor's disciplined variable selection and yearly refresh narrow these biases, giving decision-makers a balanced yardstick.
Benchmark comparison
| Market Size | Anonymized source | Primary gap driver |
|---|---|---|
| USD 1.86 B (2025) | Mordor Intelligence | - |
| USD 1.52 B (2024) | Regional Consultancy A | Excludes wearable pump cartridges and >10 mL formats |
| USD 1.61 B (2024) | Global Consultancy B | Uses list pricing, not transaction ASPs, inflating value |
| USD 2.25 B (2024) | Industry Association C | Bundles veterinary and diagnostic cartridges into scope |
These contrasts underline that Mordor's stepwise model, anchored to dose-level demand and validated by industry voices, delivers the most transparent and dependable baseline for strategic planning.


Key Questions Answered in the Report
What is the current size of the pharmaceutical cartridge market?
The pharmaceutical cartridge market size stood at USD 2.01 billion in 2026 and is on track to reach USD 2.92 billion by 2031 (2026-2031).
Which therapeutic area is growing fastest for cartridge demand?
Oncology shows the highest growth, with a 14.12% CAGR forecast through 2031 (2026-2031) as high-concentration antibody therapies migrate to subcutaneous formats.
Why are engineering plastics gaining traction against glass?
COC and COP plastics resist breakage, tolerate high-pH biologics, and meet new USP 661.1 standards, which makes them attractive for next-generation drugs.
How do EU Annex 1 changes affect cartridge selection?
Stricter sterility rules favor ready-to-use cartridges that arrive pre-sterilized, reducing washing steps and contamination risk.
What role do CMOs/CDMOs play in cartridge supply?
CMOs/CDMOs are the fastest-growing end-user group with an 11.32% CAGR to 2031 (2026-2031), expanding sterile fill-finish capacity so pharma companies can focus on R&D.
Page last updated on:


