PFAS Filtration Market Size and Share
Market Overview
| Study Period | 2021 - 2031 |
|---|---|
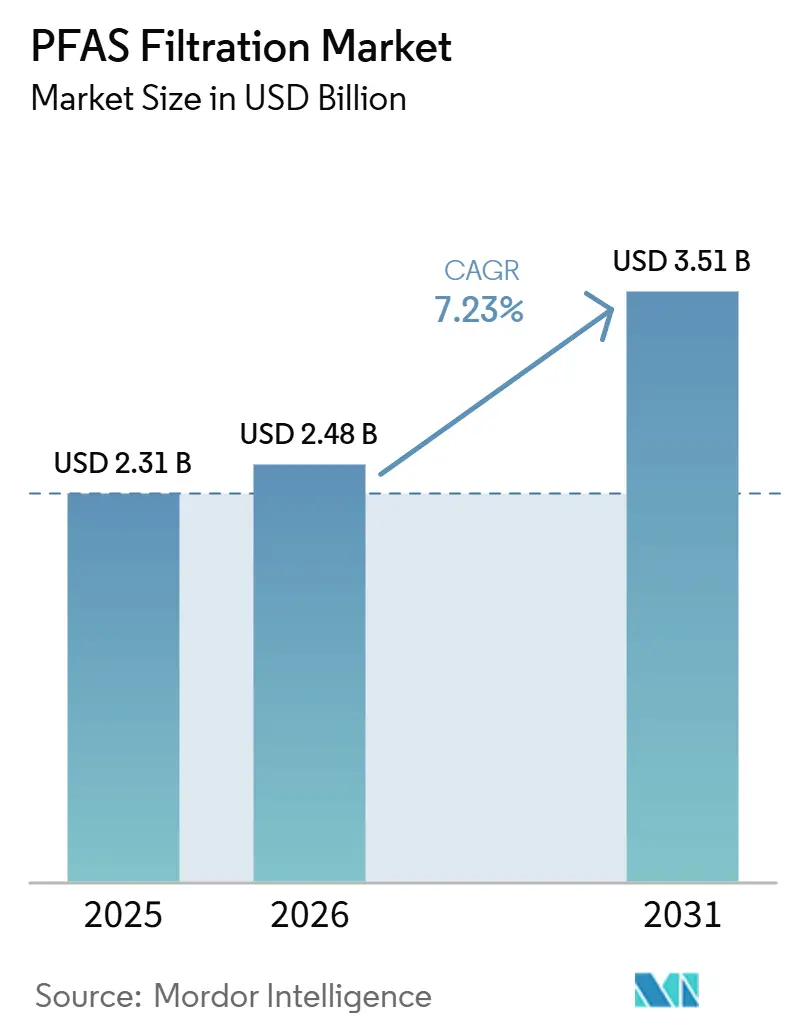
| Market Size (2026) | USD 2.48 Billion |
| Market Size (2031) | USD 3.51 Billion |
| Growth Rate (2026 - 2031) | 7.23% CAGR |
| Fastest Growing Market | Asia Pacific |
| Largest Market | Asia Pacific |
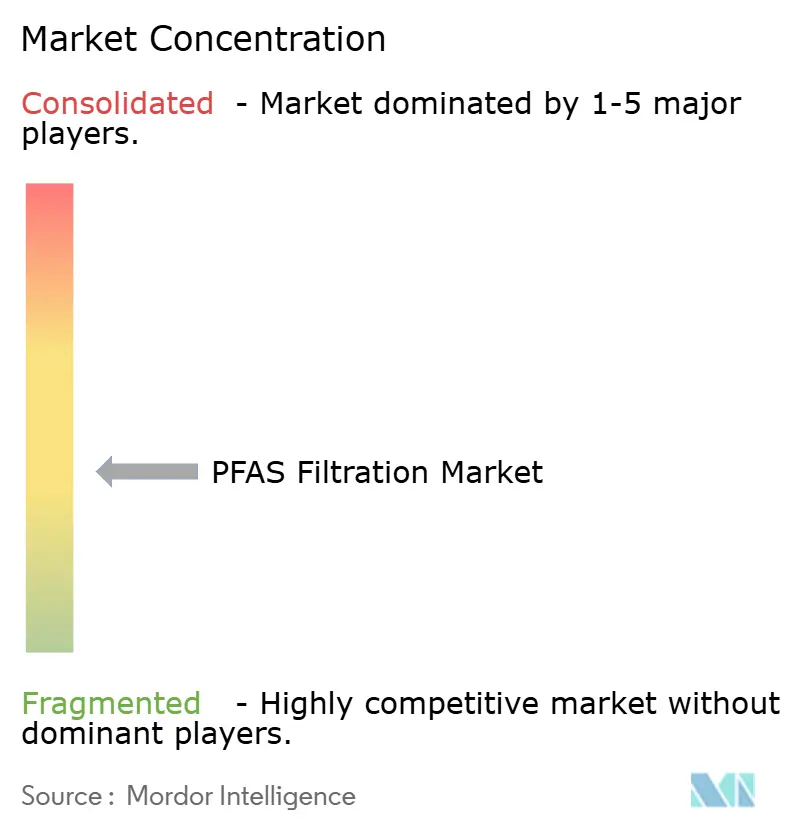
| Market Concentration | Medium |
Major Players *Disclaimer: Major Players sorted in no particular order Image © Mordor Intelligence. Reuse requires attribution under CC BY 4.0. | |
PFAS Filtration Market Analysis by Mordor Intelligence
The PFAS Filtration Market size is expected to grow from USD 2.31 billion in 2025 to USD 2.48 billion in 2026 and is forecast to reach USD 3.51 billion by 2031 at 7.23% CAGR over 2026-2031. Increased regulatory pressure in the United States, the European Union, and Asia-Pacific keeps utilities on an accelerated retrofit schedule, while infrastructure funds lower financing hurdles and tighten bid timelines. In parallel, utilities are weighing capture-and-destroy platforms that promise on-site mineralization of per- and polyfluoroalkyl substances (PFAS). The PFAS filtration market continues to benefit from legacy GAC installations and from emergent regenerable ion-exchange media that lower disposal costs. However, mounting interest in destruction technologies and raw-material shortages for premium GAC restrain near-term revenue upside.
Key Report Takeaways
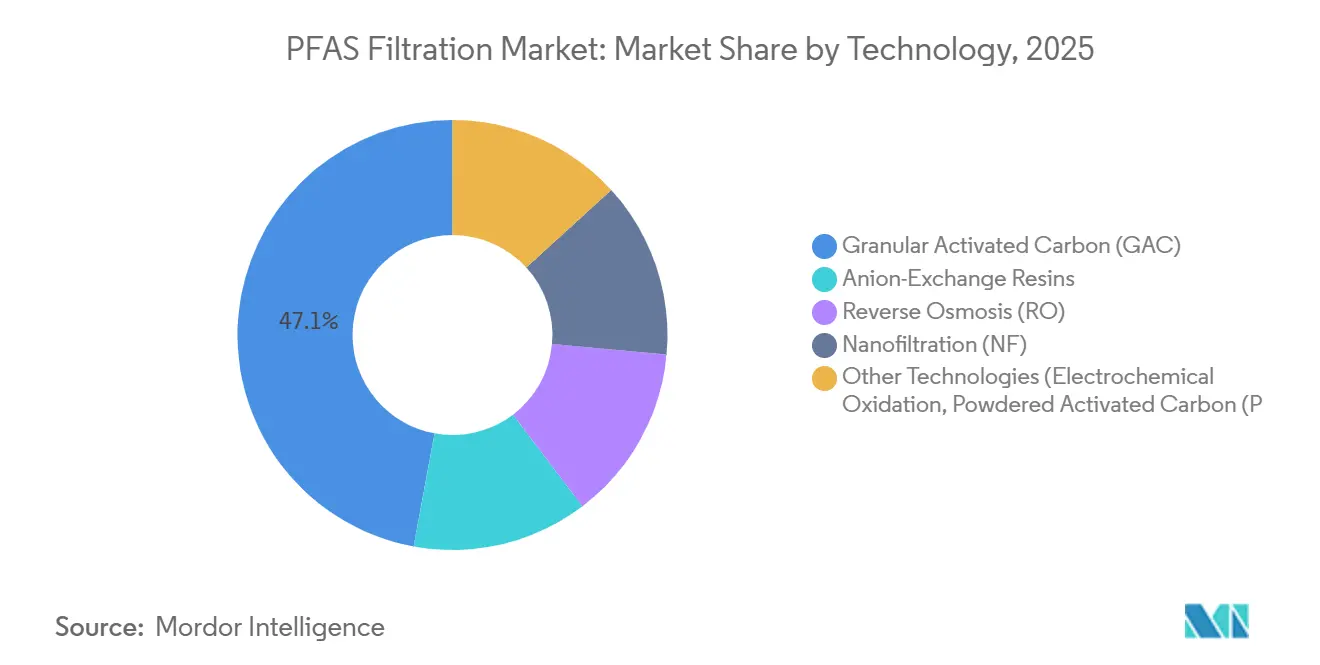
- By technology, granular activated carbon commanded 47.11% of PFAS filtration market share in 2025, while anion-exchange resins are projected to expand at 7.56% CAGR from 2026 to 2031.
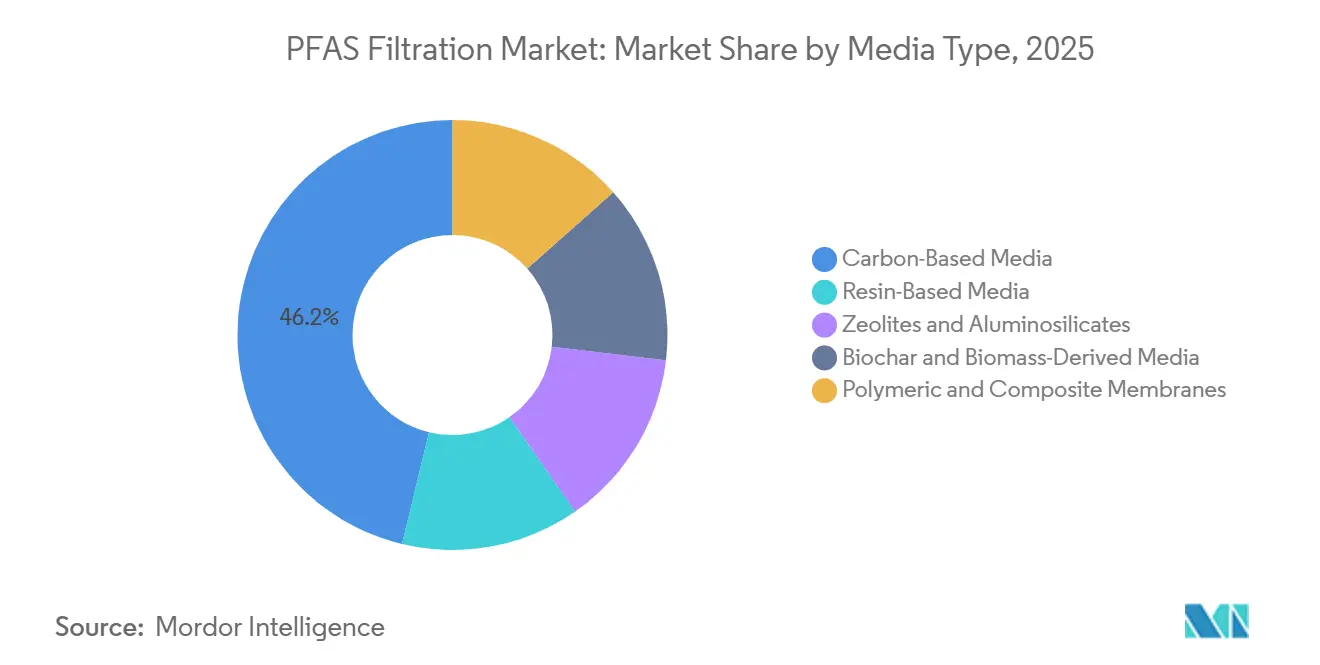
- By media type, carbon-based media held 46.23% share of the PFAS filtration market size in 2025, and resin-based media is forecast to rise at 7.91% CAGR from 2026 to 2031.
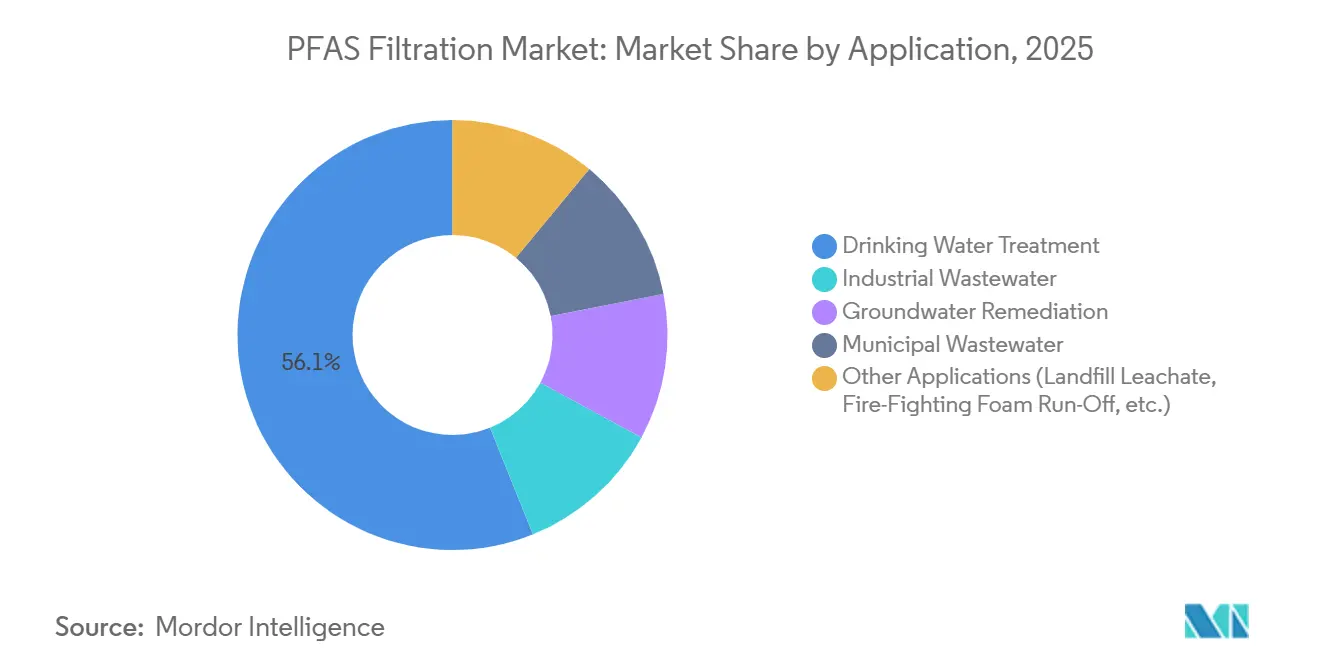
- By application, drinking-water treatment accounted for 56.11% share of the PFAS filtration market size in 2025 and is advancing at a 7.98% CAGR from 2026 to 2031.
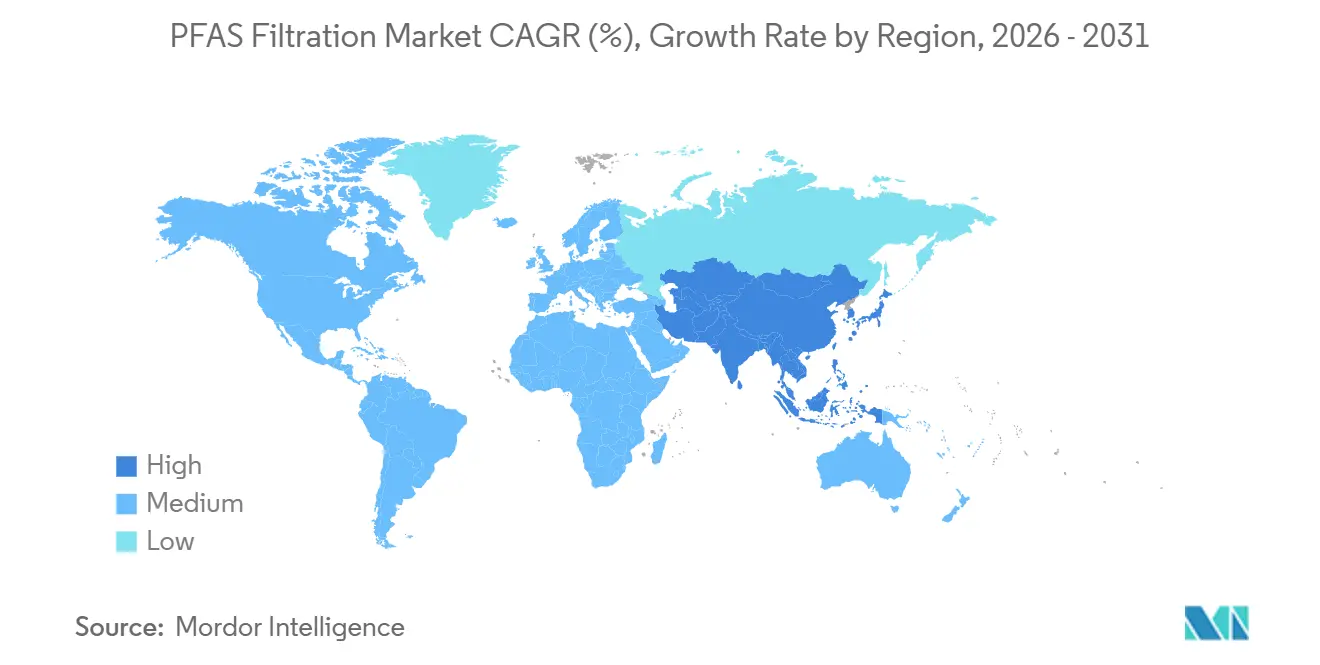
- By geography, Asia-Pacific led with 42.25% revenue share in 2025; the region is set to post the fastest 7.95% CAGR between 2026 and 2031.
Note: Market size and forecast figures in this report are generated using Mordor Intelligence’s proprietary estimation framework, updated with the latest available data and insights as of January 2026.
Global PFAS Filtration Market Trends and Insights
Drivers Impact Analysis*
| Driver | (~) % Impact on CAGR Forecast | Geographic Relevance | Impact Timeline |
|---|---|---|---|
| Infrastructure-bill funding for utilities | +2.1% | North America; spillover to EU | Medium term (2-4 years) |
| PFAS-free certifications by F&B and textile firms | +0.9% | Global, led by North America and EU | Short term (≤ 2 years) |
| Emergence of regenerable adsorbents | +1.4% | Global, early adoption in North America & APAC | Medium term (2-4 years) |
| Hybrid capture-to-destruction skids at military and remote sites | +0.7% | North America, Australia, limited EU | Long term (≥ 4 years) |
| Real-time PFAS sensors enabling proactive media changeouts | +1.0% | North America, EU, pilots in Japan & South Korea | Medium term (2-4 years) |
| Source: Mordor Intelligence | |||
Infrastructure-Bill Funding for Utilities
The U.S. Bipartisan Infrastructure Law allocated USD 10 billion for PFAS and emerging-contaminant remediation through the Drinking Water and Clean Water State Revolving Funds, which has accelerated project approvals in several states[1]U.S. Environmental Protection Agency, “Bipartisan Infrastructure Law – Emerging Contaminants,” epa.gov. North Carolina directed USD 133.7 million toward a GAC retrofit in Fayetteville, planned for 2026-2029. Similarly, Calhoun County in Alabama secured USD 288.3 million for a reverse-osmosis (RO) system, with an 80-year lifecycle value of USD 1.25 billion. In Europe, cohesion-fund grants in Germany and France have reduced procurement timelines, requiring vendors to maintain larger inventories. This consistent capital inflow is driving demand in the PFAS filtration market, although shorter bid cycles are creating challenges for supplier margins.
PFAS-Free Certifications by F&B and Textile Firms
Private-label suppliers now rely on NSF International’s P537 protocol and Intertek’s PFAS-Free seal as essential gateways to major U.S. retailers. In a bid to meet 2026 audit mandates, textile mills in Bangladesh and Vietnam are proactively installing point-of-use GAC skids. This move not only fortifies the PFAS filtration market against the fluctuations of municipal budgets but also underscores the growing importance of certifications. While these certification-driven orders may be smaller in scale, they exhibit resilience against legislative holdups, ensuring a consistent revenue stream for equipment manufacturers throughout market cycles.
Emergence of Regenerable Adsorbents
Cyclopure’s DEXSORB polymer, Kurita Water Industries’ pilot launches in Japan, and ECT2’s SORBIX RePURE resin, all boasting a regeneration capability of 10-20 times, assert an impressive 99.9% efficiency in PFAS removal. Meanwhile, Puraffinity’s hydrogel adsorbent adeptly binds short-chain compounds, effectively addressing a regulatory gap as agencies shift focus from C8 to the C4-C6 chemistries. Despite utilities grappling with uncertainties surrounding regeneration longevity, the allure of a reduced total cost of ownership is driving adoption, steering the PFAS filtration market closer to circular-economy alignment.
Hybrid Capture-to-Destruction Skids at Military and Remote Sites
At Joint Base Cape Cod (state-designated joint base created by the Commonwealth of Massachusetts and the United States Department of Defense), Department of Defense pilots report that supercritical water oxidation skids achieve 95% PFAS destruction, with treatment costs remaining below USD 10 for every 1,000 gallons. Aquagga's HALT unit, a containerized system, integrates GAC with electrochemical oxidation, offering a mobile solution for sites with PFAS concentrations above 10,000 ng/L. If these technologies demonstrate commercial reliability by 2028, projects addressing high-concentration groundwater could reduce reliance on traditional media, influencing long-term demand in the PFAS filtration market.
Restraints Impact Analysis*
| Restraint | (~) % Impact on CAGR Forecast | Geographic Relevance | Impact Timeline |
|---|---|---|---|
| Supply shortages of premium GAC and specialty resins | -1.2% | Global; acute in North America | Short term (≤ 2 years) |
| Regulatory shift toward destruction eroding filtration demand | -1.8% | North America, Australia, nascent EU uptake | Long term (≥ 4 years) |
| Rapid switch to fluorine-free chemistries reducing retrofit demand | -0.9% | EU, North America | Medium term (2-4 years) |
| Source: Mordor Intelligence | |||
Supply Shortages of Premium GAC and Specialty Resins
Arq's Alabama plant is the only source of virgin GAC in North America, producing 170 million lbs annually, while demand is expected to surpass 300 million lbs by 2025[2]Arq Inc., “North American Activated Carbon Capacity Expansion,” arq.com. Coconut-shell media is priced at USD 1,800-2,500 per ton, compared to USD 800-1,200 per ton for coal-based carbon. Typhoon-related port disruptions in the Philippines have increased lead times to 20 weeks in 2024. For anion-exchange beads such as Purolite A694E and Lanxess TP 109, logistics delays of 12 to 20 weeks are prompting utilities to secure two-year inventories in advance. These supply chain challenges are creating advantages for established vertically integrated players, while discouraging new entrants, which is likely to limit short-term growth in the PFAS filtration market.
Regulatory Shift Toward Destruction Eroding Filtration Demand
In 2025, the EPA identified destruction methods such as electrochemical oxidation, plasma, and supercritical water oxidation as preferred approaches for groundwater remediation. The Department of Defense is conducting trials with a focus on achieving lifecycle costs below USD 10 per 1,000 gallons. This cost target could drive a 10-15% reduction in the adoption of conventional media by 2028. In Europe, adoption remains slower due to the energy requirements of 1.5-2.5 kWh per gallon, while Australia's defense sector is testing similar systems. The increasing adoption of destruction methods is expected to limit the growth potential of the PFAS filtration market.
*Our forecasts treat driver/restraint impacts as directional, not additive. The impact forecasts reflect baseline growth, mix effects, and variable interactions.
Segment Analysis
By Technology: Regeneration Economics Favor Ion Exchange
Anion-exchange resins are set to grow at a 7.56% CAGR, outpacing the broader PFAS filtration market. Utilities are increasingly favoring media that can be regenerated using methanol, sodium chloride, or UV-sulfite processes, leading to a notable 40-60% reduction in disposal costs. Highlighting the municipal push for these regenerable systems, Eau Claire, Wisconsin, is set to launch a USD 20 million, 16-vessel ion-exchange plant in late spring 2026. While granular activated carbon commands a dominant 47.11% of the revenue, thanks to its legacy installations and simpler O&M protocols, rising landfill tipping fees, now exceeding USD 200/t, are diminishing its cost edge in coastal regions.
Reverse-osmosis and nanofiltration membranes, boasting a 95%+ rejection rate for short-chain PFAS, are gaining traction as regulators shift focus from C8 to the C4-C6 spectrum. In a strategic move, DuPont’s 2025 acquisition of Sinochem is poised to amplify FilmTec's production across the Asia-Pacific, with a keen eye on semiconductor fabs discharging PFAS-laden concentrates. Technologies like electrochemical oxidation, Axine’s electraCLEAR, E2METRIX’s Obreak, and Bioionix’s reactor boast a 95-99.99% destruction rate. However, they come with an energy cost of 1-2.5 kWh/gal, which may hinder immediate adoption. Meanwhile, powdered activated carbon finds its niche in treating batch landfill leachate, especially where capital budgets are tight.


By Media Type: Carbon Alternatives Gain Momentum
Carbon-based media's, are projected to be the largest segment with 46.23% share in 2025, with resin-based media expected to rise at 7.91% until 2031. In 2024, shortages of coconut-shell GAC highlighted the vulnerabilities of single-source supply chains, prompting operators to pivot towards synthetic polymers. Trials at the University of Rhode Island revealed that pyrolyzed wood biochar can achieve 80-85% PFAS removal at just a third of the cost of virgin GAC, although data on its 10-year stability is still awaited. While zeolites, enhanced with quaternary ammonium groups, and graphene-oxide composite membranes show promise, they remain a few years shy of commercialization, targeting a window before 2028.
Polymeric thin-film composite RO elements boast a 95-99% rejection rate for perfluorobutanoic acid. However, they face a 15-25% flux reduction due to natural-organic-matter fouling within 18 months. Operators routinely clean with citric acid or sodium hydroxide, accepting this compromise to achieve sub-10 ng/L effluent targets, a benchmark not met by GAC. Tests from MIT's lab on graphene-oxide membranes indicated a 99.5% PFAS rejection rate with a 30% boost in flux, suggesting a significant leap for next-generation solutions, pending scale-up.
By Application: Drinking Water Treatment Leads Across Metrics
Drinking-water treatment, accounting for 56.11% of 2025's revenue, is set to grow by 7.98%. This growth is driven by the EPA's October 2024 imposition of a 4 ng/L limit for PFOA/PFOS and a 10 ng/L threshold for four other substances. Multi-year capital expenditures, such as Fayetteville’s USD 133.7 million GAC facility and Plainville’s USD 26.3 million retrofit, underscore the forecasted growth of the PFAS filtration market.
While industrial wastewater commands a smaller share, its importance is rising as multinational corporations enforce PFAS-free audits on their suppliers. In 2025, Samsung’s Pyeongtaek fab implemented a reverse osmosis (RO) system to achieve a discharge of less than 10 ng/L, a move in line with audit requirements from industry giants Apple and Intel. Groundwater remediation efforts, highlighted by Calhoun County’s USD 288.3 million RO asset and South Adams County’s ion-exchange plant, grapple with challenges like diffused site ownership and extended permitting processes, leading to slower order velocities. With landfill leachate and AFFF runoff surpassing 10,000 ng/L, hybrid capture-and-destroy skids emerge as a financially attractive solution, especially post-2028.
Geography Analysis
Asia-Pacific, accounting for 42.25% of 2025's revenue, is set to lead with a projected CAGR of 7.95%. Following Japan's April 2026 ban on 138 compounds, cities like Tokyo, Osaka, and Nagoya are now retrofitting to meet the stringent 50 ng/L PFOS/PFOA target. In 2025, China broadened its PFAS monitoring to encompass 300 cities, with provincial regulators advocating for sub-20 ng/L caps on industrial effluents. This regulatory wave coincides with DuPont's strategic timing of its Ningbo membrane plant. While South Korea, Vietnam, and Thailand lag in legislation, the demand for point-of-use GAC, driven by supplier audits, carves out fragmented growth pockets in the PFAS filtration market.
North America stands as the second largest region. The EPA's final rule, supported by a USD 10 billion allocation from the Infrastructure Law, is set to fuel a surge in GAC, ion-exchange, and RO projects, extending through 2029. Canada, tightening its standards to 30 ng/L in 2024, now tracks discharges exceeding 100 kg in its National Pollutant Release Inventory. While Mexico has not established federal limits, utilities along the border are proactively treating PFAS in shared waters, indirectly boosting regional expenditures.
Europe's Drinking Water Directive, effective 1 January 2026, sets a cap of 100 ng/L for Total PFAS and 500 ng/L for the sum, leading to a EUR 450 million retrofit expenditure across Germany, France, and the Netherlands. The U.K., maintaining a 100 ng/L threshold, is also backing GAC-ozone regeneration research at Swansea University through Ofwat's innovation funds. In South America and the Middle East-Africa, the landscape is still nascent; while Brazil and Saudi Arabia have conducted baseline assessments, they are yet to establish enforceable standards, hinting at potential growth once regulations take shape.

Competitive Landscape
The PFAS filtration market exhibits partially fragmented nature, the leading supplier commands less than 15% of the projected 2025 revenue. Veolia, Xylem, and Pentair are capitalizing on their established municipal bases, bundling PFAS modules with clarifiers and UV disinfection. This strategy not only discourages customer switching but also places a ceiling on profit margins. With regulators tightening limits on short-chain substances, DuPont's acquisition of Sinochem's RO Memtech in 2025 positions the company for a significant gain in the membrane-centric market.
While Cyclopure, Puraffinity, and ECT2 carve out a niche with their regenerable adsorbents, which promise 10 to 20 cycles and are appealing in a landscape where landfill tipping exceeds USD 200/ton, utilities express hesitance. Concerns about the longevity of the media and the potential for residual PFAS breakthroughs temper widespread adoption. Following 3M's exit from production and a USD 10.3 billion settlement, Solventum finds itself dependent on third-party fluoropolymer suppliers. This situation presents an opportunity for Chemours and Daikin, who are emphasizing their vertically integrated lines. Furthermore, with the Department of Defense endorsing capture-and-destroy systems from Aquagga, Revive Environmental, and ACES, there is a potential shift on the horizon. High-concentration projects might pivot away from traditional media vendors after 2028, signaling a possible reshaping of competitive dynamics in the PFAS filtration arena.
PFAS Filtration Industry Leaders
DuPont Water Solutions
Veolia
Xylem
Pentair plc
Calgon Carbon Corporation
- *Disclaimer: Major Players sorted in no particular order

Recent Industry Developments
- January 2026: Eau Claire, WI, to commission a USD 20 million ion-exchange facility treating 8 MGD with Calgon Carbon media.
- September 2023: DuPont completed Sinochem (Ningbo) RO Memtech acquisition, expanding FilmTec membrane capacity in Asia-Pacific.


Global PFAS Filtration Market Report Scope
PFAS filtration is the process of removing per- and polyfluoroalkyl substances (PFAS), a group of persistent, synthetic "forever chemicals", from drinking water, wastewater, or industrial water sources using specialized separation technologies.
The market is segmented by technology, media type, and application. By technology, the market is segmented into granular activated carbon (GAC), anion-exchange resins, reverse osmosis (RO), nanofiltration (NF), and other technologies (including electrochemical oxidation and powdered activated carbon (PAC)). By media type, the market is segmented into carbon-based media, resin-based media, zeolites and aluminosilicates, biochar and biomass-derived media, and polymeric and composite membranes. By application, the market is segmented into drinking water treatment, industrial wastewater, groundwater remediation, municipal wastewater, and other applications (including landfill leachate and fire-fighting foam run-off). The report also covers the market size and forecasts for PFAS Filtration in 17 countries across the world. For each segemnt market sizing and forecasts are provided in terms of value (USD).
| Granular Activated Carbon (GAC) |
| Anion-Exchange Resins |
| Reverse Osmosis (RO) |
| Nanofiltration (NF) |
| Other Technologies (Electrochemical Oxidation, Powdered Activated Carbon (PAC), etc.) |
| Carbon-Based Media |
| Resin-Based Media |
| Zeolites and Aluminosilicates |
| Biochar and Biomass-Derived Media |
| Polymeric and Composite Membranes |
| Drinking Water Treatment |
| Industrial Wastewater |
| Groundwater Remediation |
| Municipal Wastewater |
| Other Applications (Landfill Leachate, Fire-Fighting Foam Run-Off, etc.) |
| Asia-Pacific | China |
| Japan | |
| India | |
| South Korea | |
| ASEAN Countries | |
| Rest of Asia-Pacific | |
| North America | United States |
| Canada | |
| Mexico | |
| Europe | Germany |
| United Kingdom | |
| France | |
| Italy | |
| Spain | |
| Russia | |
| NORDIC Countries | |
| Rest of Europe | |
| South America | Brazil |
| Argentina | |
| Rest of South America | |
| Middle-East and Africa | Saudi Arabia |
| South Africa | |
| Rest of Middle-East and Africa |
| By Technology | Granular Activated Carbon (GAC) | |
| Anion-Exchange Resins | ||
| Reverse Osmosis (RO) | ||
| Nanofiltration (NF) | ||
| Other Technologies (Electrochemical Oxidation, Powdered Activated Carbon (PAC), etc.) | ||
| By Media Type | Carbon-Based Media | |
| Resin-Based Media | ||
| Zeolites and Aluminosilicates | ||
| Biochar and Biomass-Derived Media | ||
| Polymeric and Composite Membranes | ||
| By Application | Drinking Water Treatment | |
| Industrial Wastewater | ||
| Groundwater Remediation | ||
| Municipal Wastewater | ||
| Other Applications (Landfill Leachate, Fire-Fighting Foam Run-Off, etc.) | ||
| By Geography | Asia-Pacific | China |
| Japan | ||
| India | ||
| South Korea | ||
| ASEAN Countries | ||
| Rest of Asia-Pacific | ||
| North America | United States | |
| Canada | ||
| Mexico | ||
| Europe | Germany | |
| United Kingdom | ||
| France | ||
| Italy | ||
| Spain | ||
| Russia | ||
| NORDIC Countries | ||
| Rest of Europe | ||
| South America | Brazil | |
| Argentina | ||
| Rest of South America | ||
| Middle-East and Africa | Saudi Arabia | |
| South Africa | ||
| Rest of Middle-East and Africa | ||


Key Questions Answered in the Report
What is the projected value of the PFAS filtration market by 2031?
The PFAS filtration market is forecast to reach USD 3.51 billion by 2031 growing from USD 2.31 billion in 2025
Which technology is expected to grow fastest in PFAS removal?
Anion-exchange resins are projected to expand at a 7.56% CAGR between 2026 and 2031.
Why is Asia-Pacific the fastest growing regional segment?
Tightening PFAS regulations in Japan, China, and South Korea and industrial upgrades across semiconductor and textile sectors spur a 7.95% regional CAGR.
How will destruction technologies affect traditional filtration demand?
Department of Defense pilots show capture-and-destroy skids could cut high-concentration filtration demand 10-15% after 2028 if costs stay below USD 10 per 1,000 gal.
Page last updated on:


