
Outcome-Based Managed Services Market Size and Share
Market Overview
| Study Period | 2021 - 2032 |
|---|---|
| Market Size (2027) | USD 13.71 Billion |
| Market Size (2032) | USD 19.48 Billion |
| Growth Rate (2027 - 2032) | 7.28 % |
| Fastest Growing Market | Asia-Pacific |
| Largest Market | North America |
| Market Concentration | Medium |
Major Players *Disclaimer: Major Players sorted in no particular order Image © Mordor Intelligence. Reuse requires attribution under CC BY 4.0. | |
Outcome-Based Managed Services Market Analysis by Mordor Intelligence
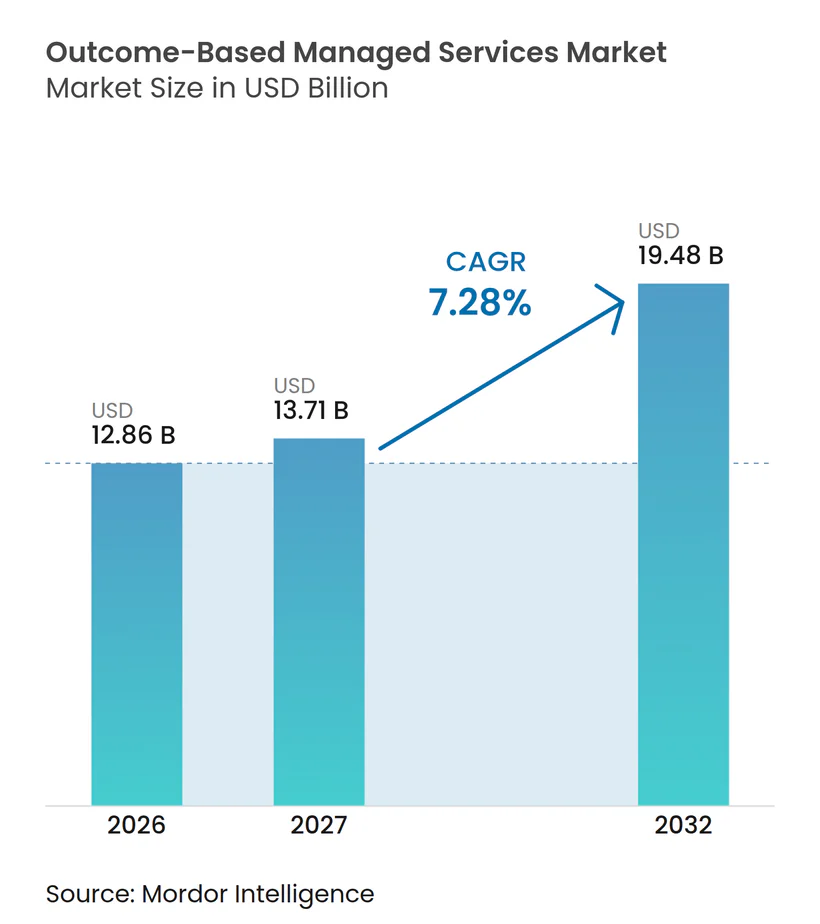
The outcome-based managed services market size was valued at USD 12.86 billion in 2026 and is estimated to grow from USD 13.71 billion in 2027 to reach USD 19.48 billion by 2032, at a CAGR of 7.28% during the forecast period (2027-2032). The outcome-based managed services market is moving away from time-and-materials agreements toward contracts that hold providers accountable for measurable business results. AI-enabled automation is changing the commercial basis of managed delivery by reducing manual effort across IT operations, finance, and customer support. This makes labor-based pricing less suitable when providers can measure productivity, resolution quality, and service performance more directly. Buyers are also transferring accountability for cloud complexity, security, compliance, and user experience to service providers that can document results. Providers with reliable data, AI platforms, and the financial capacity to accept shared risk are better positioned to compete for larger engagements.
Key Report Takeaways
- By outcome type, cost reduction and savings-share outcomes held 27.83% of the outcome-based managed services market revenue in 2026, while risk, compliance, and sustainability outcomes are projected to expand at an 8.41% CAGR through 2032.
- By service domain, managed IT services accounted for 26.34% of revenue in 2026, while managed data and AI services are expected to record the highest CAGR at 9.73% through 2032.
- By deployment mode, cloud-based services commanded 72.51% of the outcome-based managed services market revenue in 2026 and are projected to expand at an 8.64% CAGR through 2032.
- By organization size, large enterprises accounted for 71.54% of revenue in 2026, while small and medium-sized enterprises are expected to advance at a 10.21% CAGR through 2032.
- By end-user industry, BFSI held 29.86% of revenue in 2026, while healthcare and life sciences are projected to expand at an 11.32% CAGR through 2032.
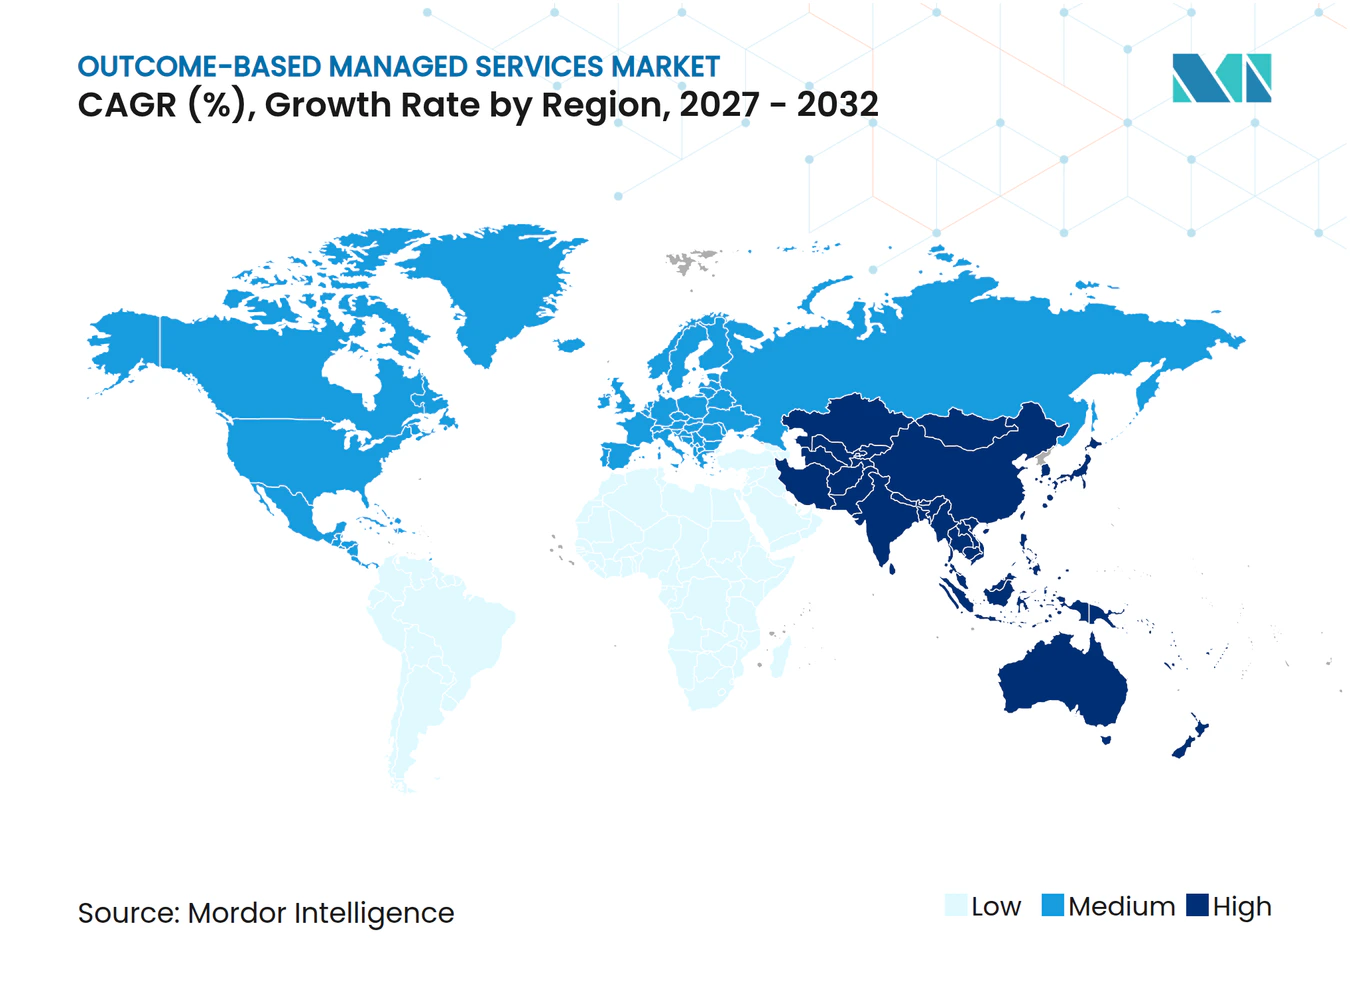
- By geography, North America held 38.64% of the global outcome-based managed services market revenue in 2026, while Asia-Pacific is expected to record the highest regional CAGR at 9.49% through 2032.
Note: Market numbers in this report are based on Mordor Intelligence's proprietary estimation framework, which combines nine months of actuals with Q4 projections for base year 2026.
Market Trends and Insights
Drivers Impact Analysis of Outcome-Based Managed Services Market*
| Driver | (~) % Impact on CAGR Forecast | Geographic Relevance | Impact Timeline |
|---|---|---|---|
| AI Operations Automation Tied to Measurable Business Results | +1.8% | Global | Medium term (2-4 years) |
| Cloud and Hybrid-Cloud Complexity Driving Accountability Transfer | +1.5% | Global, with North America and Asia-Pacific leading | Short term (≤ 2 years) |
| Cybersecurity and Continuous Compliance Requirements | +1.3% | North America and Europe, with spillover to Asia-Pacific | Medium term (2-4 years) |
| Buyer Shift From Labor Inputs to Business-Outcome Contracts | +1.0% | Global | Medium term (2-4 years) |
| Shortage of Scarce Technology and Industry Skills | +0.8% | Asia-Pacific, with spillover to North America and Europe | Long term (≥ 4 years) |
| Experience-Level Agreements Expanding Beyond Uptime Metrics | +0.6% | Europe and North America, with early gains in Australia | Medium term (2-4 years) |
| Source: Mordor Intelligence | |||
AI Operations Automation Tied to Measurable Business Results
AI operations make the outcome-based managed services market more practical because providers can observe delivery performance continuously rather than depend on periodic manual reviews. Traditional operations relied on staff-led monitoring and ticket closure, which made it difficult to connect service activity with business results or to distinguish a short-term response from a sustained service improvement. AI platforms can monitor incidents, identify recurring patterns, support automated remediation, and create a clearer record of how a service performed across a wider delivery estate. The resulting data gives both parties a stronger basis for setting targets, agreeing on exceptions, and reviewing whether the target was achieved before a contract or pricing mechanism takes effect. When automation reduces labor content, providers have a stronger reason to link fees to productivity or service outcomes instead of billing for full-time equivalents. This change favors providers that can prove repeatable gains, explain how the gains were achieved, and translate operational data into measures that procurement, business, and technology teams can all use. It also changes the conversation from the volume of work completed to the quality, speed, and consistency of the result delivered to the client.
Cloud and Hybrid-Cloud Complexity Driving Accountability Transfer
Cloud and hybrid-cloud complexity is increasing the need for managed accountability across infrastructure, applications, security, and data movement. Flexera reported that 73% of organizations operated hybrid IT estates in 2026, while estimated wasted cloud spend reached 29%.[1] A mixed environment can make ownership unclear when service quality falls, cloud costs rise, or a problem moves across several systems that are managed by different internal teams and suppliers. Buyers, therefore, seek providers that can coordinate performance across systems instead of managing isolated technology tasks with separate service measures. In regulated settings, traceability, audit readiness, and clear responsibility are increasingly embedded in outsourcing requirements, making a shared view of performance more important. The European Securities and Markets Authority sets guidelines for cloud outsourcing that reinforce these expectations for regulated financial entities. The outcome-based managed services market is better suited to providers that can make these responsibilities visible across the full technology environment.
Cybersecurity and Continuous Compliance Requirements
Cybersecurity requirements are supporting the outcome-based managed services market because buyers need evidence that controls remain active over time, not simply evidence that a control was installed at the start of an engagement. The U.S. Department of Defense final rule for CMMC 2.0 became effective on November 10, 2025, requiring covered contractors to demonstrate implementation of cybersecurity requirements. This requirement places greater value on providers that can document operating performance, preserve records, and show how they respond when a control does not operate as expected. New York’s Department of Financial Services also issued third-party risk guidance in October 2025, emphasizing due diligence, oversight, and contractual protections. Similar expectations are extending across financial services, healthcare, defense, and critical infrastructure, where failures can create financial, regulatory, and operational consequences. This encourages contracts that use measurable compliance results, incident response, reporting discipline, and agreed escalation procedures as part of normal service delivery. It also gives buyers a way to judge whether their provider is maintaining the expected standard between formal audits, regulatory reviews, and major service incidents.
Buyer Shift From Labor Inputs to Business-Outcome Contracts
Buyers are increasingly evaluating managed service contracts on measurable results rather than on the number of people assigned to an account. This reflects a wider change in buyer expectations as automation alters the amount of manual work behind a service and reduces the link between headcount and delivered value. Providers also support this transition because efficiency gains under labor-based agreements would otherwise largely benefit clients, even when the provider made the investment in tools, process redesign, and operational change. Outcome measures can include automation rates, resolution quality, service availability, business process performance, and user experience, provided that the measures are clear and within the provider’s agreed-upon area of responsibility. Contract design must still account for factors that neither party can control, particularly where several internal teams or suppliers shape the final result. The outcome-based managed services market, therefore, depends on commercial structures that allow both sides to share the value created by automation while preserving realistic responsibilities and transparent performance reviews. Clear definitions, measurement periods, exclusions, and review practices help prevent an efficiency discussion from becoming a disagreement over pricing or accountability.
Restraints Impact Analysis of Outcome-Based Managed Services Market*
| Restraint | (~) % Impact on CAGR Forecast | Geographic Relevance | Impact Timeline |
|---|---|---|---|
| Baseline Measurement and Attribution Ambiguity | -1.5% | Global | Short term (≤ 2 years) |
| Data Sovereignty and Liability Allocation Risk | -1.2% | Europe, Asia-Pacific, Middle East | Medium term (2-4 years) |
| Provider Margin Exposure Under Shared-Risk Contracts | -0.8% | Global | Medium term (2-4 years) |
| Client Procurement and Governance Inertia | -0.5% | Europe and North America | Long term (≥ 4 years) |
| Source: Mordor Intelligence | |||
Baseline Measurement and Attribution Ambiguity
Baseline measurement remains a major constraint because an outcome contract needs a trusted starting point for cost, service quality, user experience, incident performance, and the operating conditions that affect those measures. Many buyers cannot supply historical data at the detail required to define a fair baseline, especially when records are spread across separate systems or have been created for internal reporting rather than contractual measurement. The problem becomes harder in multi-vendor environments where several parties influence the same result and each party may use different tools, reporting periods, or service definitions. Providers and clients must determine which party caused an improvement or a failure before payment can be linked to performance, which can lead to lengthy debate over attribution rather than service improvement. This often leads to hybrid commercial structures that combine a base fee with outcome-linked incentives until both parties are comfortable with the data and measurement process. The outcome-based managed services market may therefore progress faster where buyers already have reliable telemetry, clear responsibility models, mature governance processes, and a practical way to resolve disputes. These capabilities allow the parties to spend more time improving delivery and less time debating the data used to determine whether a promised outcome was achieved.
Data Sovereignty and Liability Allocation Risk
Data sovereignty complicates cross-border managed engagements because legal requirements differ across the United States, Europe, Asia-Pacific, and the Middle East, and the same service may use data, people, tools, and infrastructure in more than 1 jurisdiction. Providers may process client information across jurisdictions while clients retain responsibility as data controllers, creating a gap between operational control and regulatory accountability. This raises concerns when a cost or performance target depends on centralized delivery, but local rules require data residency, stronger oversight, or different rules for handling sensitive information. The European Union’s Digital Operational Resilience Act raises the importance of managing information and communications technology risk in financial services.[2] Outcome measures must therefore be matched with jurisdiction-specific duties, operating controls, liability provisions, and practical processes for handling incidents or regulatory requests. These requirements can delay contracting when the parties cannot agree on responsibility for regulatory exposure, the location of data processing, or the level of financial risk that each side should accept. The outcome-based managed services market consequently requires commercial teams, legal teams, security specialists, and delivery leaders to align before a cross-border performance commitment can be priced with confidence.
*Our forecasts treat driver/restraint impacts as directional, not additive. The impact forecasts reflect baseline growth, mix effects, and variable interactions.
Outcome-Based Managed Services Market Segment Analysis
By Outcome Type:
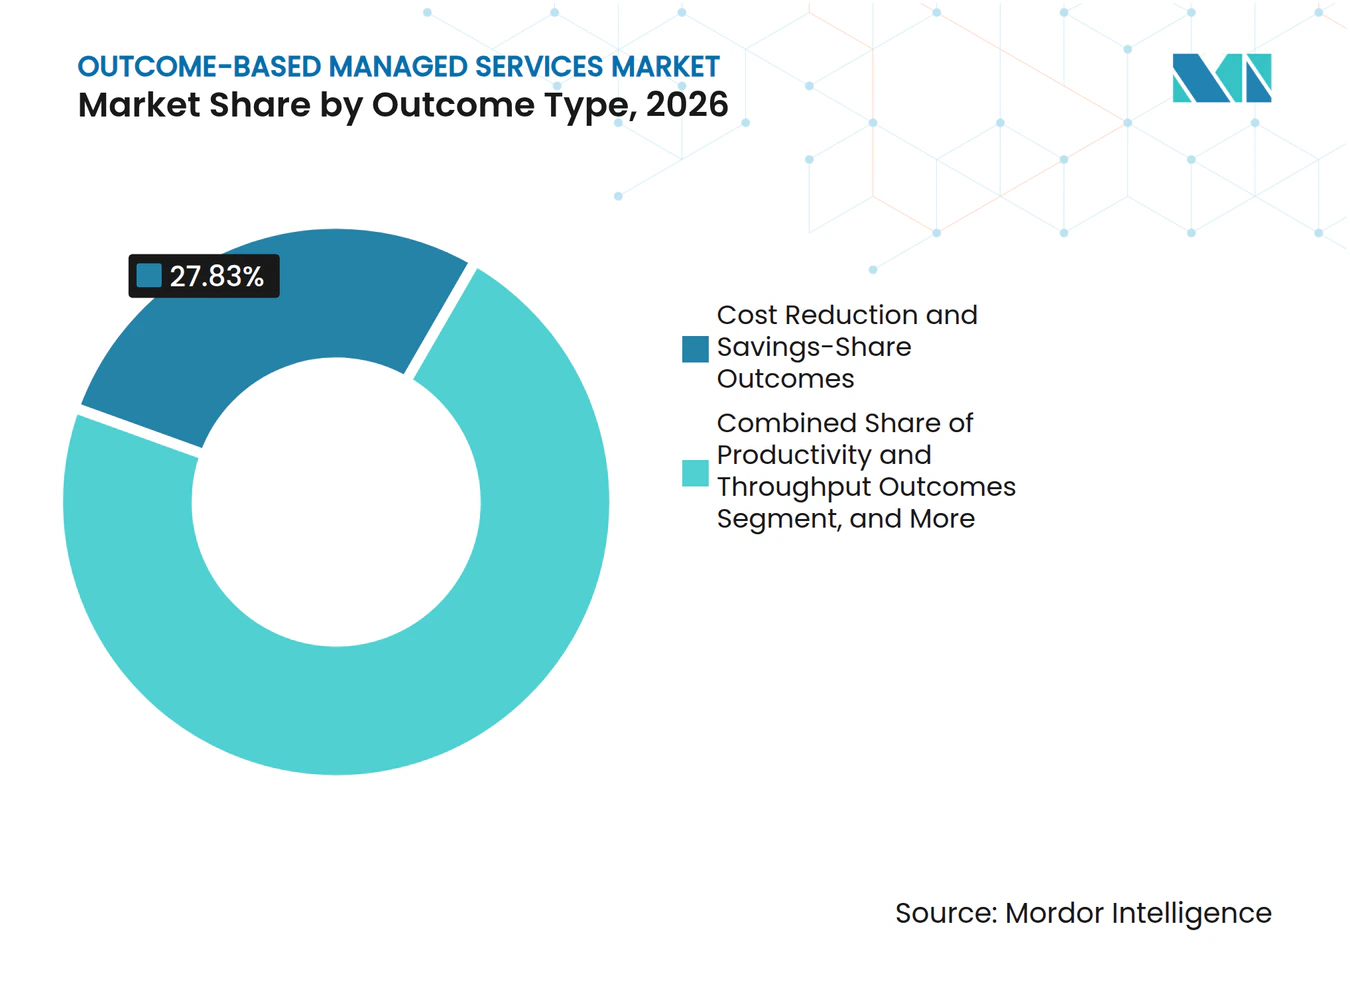
Cost Savings Remain the Main Entry Point While Compliance Broadens Contract ValueCost reduction and savings-share outcomes held 27.83% of the outcome-based managed services market share in 2026. Their lead reflects the established role of outsourcing in reducing operating costs through process redesign, automation, and delivery scale. Cost measures are generally easier to define than broader commercial or experience measures because the starting cost base can be recorded in financial terms. The client and provider can agree on which costs are in scope before the service begins. This makes savings-share arrangements a practical entry point for organizations that are still developing outcome-contract governance.
Providers can use these agreements to show how automation, workflow changes, and more efficient operating methods affect an agreed financial result. Productivity and throughput outcomes are used when buyers require more transactions, faster processing, or more consistent execution. Revenue growth and conversion outcomes demand more careful contract design because sales performance can be shaped by market conditions, customer behavior, and internal decisions. Customer experience and retention outcomes are relevant where service quality has a direct effect on user satisfaction and loyalty. Employee experience, workforce productivity, and service quality outcomes are also gaining relevance in service desk, workplace, and human resources delivery. Risk, compliance, and sustainability outcomes are projected to expand at an 8.41% CAGR through 2032 as buyers place greater value on documented, auditable operating performance.



By Service Domain:
Managed IT Services Provide Scale While Data and AI Services Lead ExpansionManaged IT services accounted for 26.34% of the outcome-based managed services market size in 2026. IT remains the largest service domain because buyers and providers already understand how to measure availability, incident handling, operational continuity, and infrastructure performance. This familiarity gives both parties a workable basis for agreeing targets and determining whether those targets have been achieved. It also reduces the effort needed to build a baseline before a contract starts. The outcome-based managed services market can therefore build on established managed IT relationships when clients want to move from service levels toward wider business measures.
Managed security services benefit from the need for continuous monitoring, evidence, response, and regulatory oversight. Managed cloud and infrastructure services are also important as organizations seek clearer accountability across complex technology estates. Managed application services become more relevant when providers accept responsibility for modernization, release velocity, defect prevention, and application performance. Managed network services retain a stable role when software-defined networking is included within broader multi-domain contracts. Managed data and AI services are projected to record the highest CAGR at 9.73% through 2032 because clients need AI-ready data platforms, generative AI governance, and validated model operations. As AI is applied across IT, security, cloud, and applications, providers that connect data quality, governance, model performance, and operational delivery in one accountable framework may gain an advantage.
By Deployment Mode:
Cloud Delivery Leads Because It Supports Continuous MeasurementCloud-based services commanded 72.51% of revenue in 2026. Their scale reflects a buyer preference for delivery environments that allow performance data to be collected continuously and reviewed without relying only on periodic account reports. Cloud environments support real-time telemetry, elastic scaling, automated policy enforcement, and centralized operational controls. These capabilities make it easier to identify an issue, document the response, and show whether the agreed service result was achieved. The outcome-based managed services market relies on these features because measurable performance is central to the commercial model.
Cloud-based delivery is projected to expand at an 8.64% CAGR through 2032, making it the largest and fastest-growing deployment mode. On-premises delivery remains relevant in defense, critical infrastructure, government, and other settings where public cloud hosting may not meet data, security, or operating requirements.[3] Hybrid models are gaining attention because they combine local infrastructure control with cloud-based analytics and automation. Flexera’s 2026 research identified hybrid cloud as the dominant overall IT architecture, with 73% adoption. Some hybrid engagements are classified as cloud-based when the primary tools are cloud delivered, even when important workloads remain on premises. This means the outcome-based managed services market may contain more hybrid delivery activity than formal deployment labels indicate.
By Organization Size:
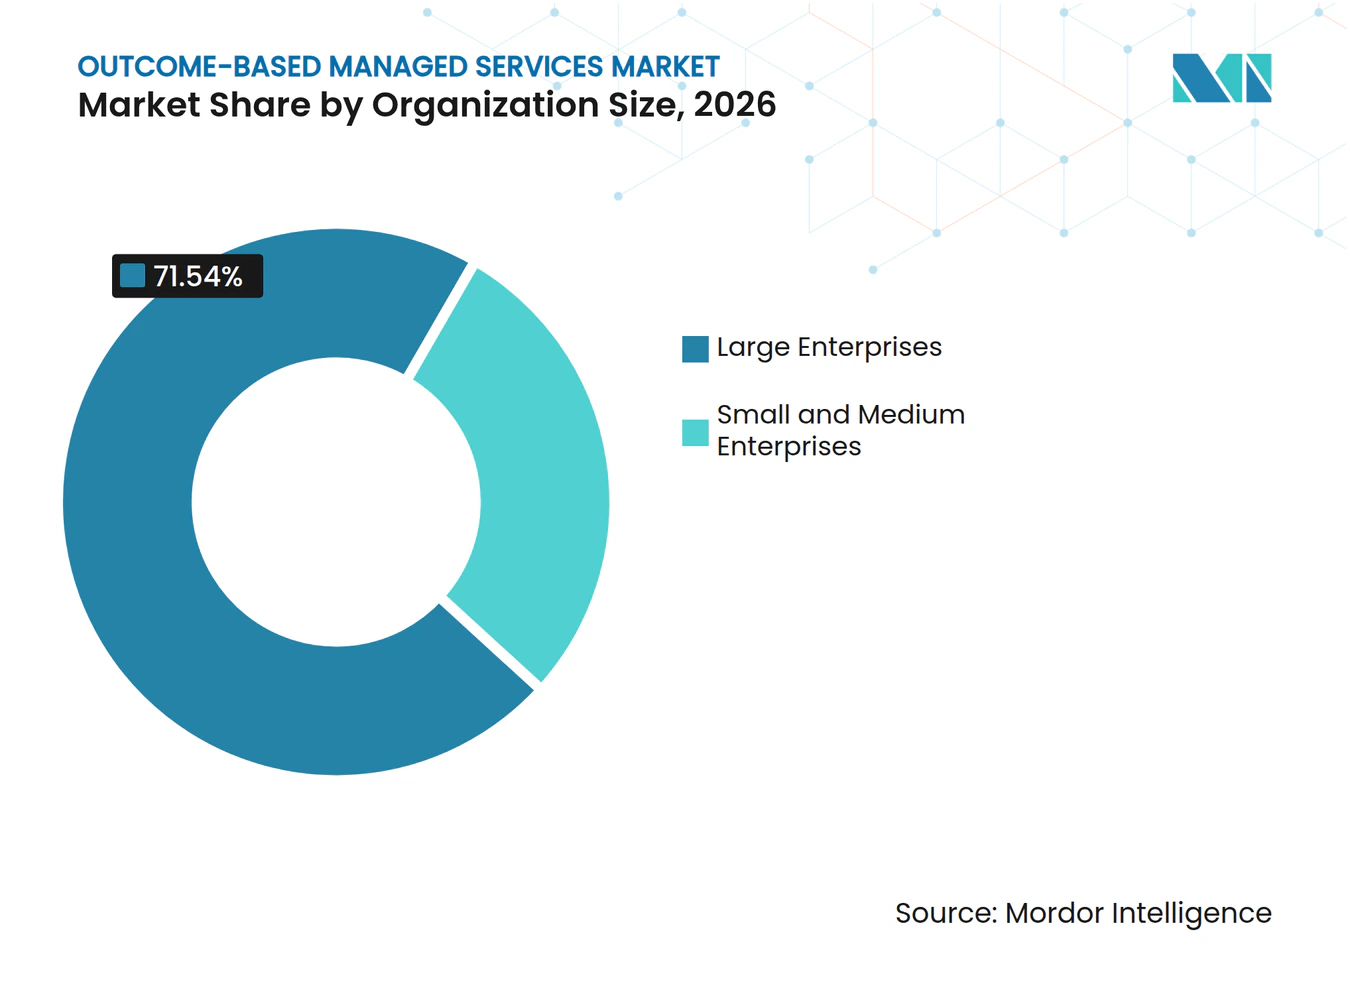
Large Enterprises Hold the Base While Smaller Firms Increase AdoptionLarge enterprises accounted for 71.54% of revenue in 2026. They have the contract scale, outsourcing experience, and governance capacity needed to define detailed performance measures and oversee shared-risk agreements. These buyers can invest in the collection of baseline data, the design of responsibility models, and the systems needed to monitor performance over time. Their multi-year engagements also give providers time to make investments in automation and service instrumentation. Large enterprises have therefore been the main testing ground for bespoke outcome structures.
Small and medium-sized enterprises are projected to expand at a 10.21% CAGR through 2032. Cloud-native delivery can lower the entry threshold because smaller organizations can use standardized services without creating large internal technology teams. These buyers may seek the same accountability as large enterprises, but may lack the resources to negotiate and oversee complex customized metrics. Providers must therefore offer clear service tiers, repeatable measures, and simple reporting that clients can understand. Standardization can reduce contracting time while preserving a direct link between delivery and the agreed result. The outcome-based managed services industry can expand in this segment when providers balance accountability with manageable contract administration.

By End-User Industry:
BFSI Leads Spending While Healthcare and Life Sciences Expand FastestBFSI held 29.86% of revenue in 2026. Financial institutions have a long history with managed services and face high compliance costs across security, data, payments, infrastructure, and operational controls. This makes documented service performance especially valuable, since a provider must show not only that an activity was completed but also that the required control remained effective. The sector also has established practices for vendor oversight, audit, and third-party governance. These conditions make BFSI a strong base for outcome-linked managed delivery.
Government and public sector, IT and telecommunications, industrial manufacturing, and retail and e-commerce are also important end-user groups. Each group uses managed delivery to modernize operations while seeking clearer responsibility for service performance and business results. Healthcare and life sciences are projected to expand at an 11.32% CAGR through 2032. Demand is linked to clinical data modernization, AI-ready data platforms, regulated AI use, and application management, all of which can be evaluated against agreed-upon outcomes. Providers serving these organizations must connect domain knowledge with accountable technology operations, data controls, privacy requirements, and AI governance. The outcome-based managed services market has an opportunity where a single delivery model can meet these overlapping operating needs.
Geography Analysis
North America Outcome-Based Managed Services Market
North America held 38.64% of the outcome-based managed services market share in 2026. The region benefits from large enterprise buyers, mature procurement practices, and a dense base of global service providers. The United States generates most regional revenue because many large organizations already have established outsourcing programs and the ability to support performance-based contracts. These buyers also have the legal, procurement, and governance resources required to evaluate complex shared-risk proposals. CMMC 2.0 adds a compliance driver for covered defense contractors and their providers. Canada’s public sector digitization activity supports demand in healthcare IT and government infrastructure. Mexico is an emerging demand center as nearshoring supports enterprise technology investment.
APAC Outcome-Based Managed Services Market
Asia-Pacific is projected to record the highest regional CAGR at 9.49% through 2032. Expansion is supported by digital infrastructure investment, cloud adoption, and shortages of technology skills in high-growth economies. China, India, Japan, and Australia are the largest managed services markets in the region. India and Southeast Asia are building adoption through cloud migration and broader digital transformation programs. Japan and Australia are moving toward more advanced AI-enabled outcome models. Data localization requirements in India, China, and Indonesia favor providers with local delivery infrastructure and compliance capabilities. These requirements can limit the use of one cross-border contract model across the region. They also make local knowledge, data controls, and delivery capacity important competitive factors.
EMEA and South America Outcome-Based Managed Services Market
Europe represents a significant share of global revenue because GDPR, NIS2, and DORA increase the specification requirements for managed service contracts. These rules can support demand, but they also raise the operational and legal standard that providers must meet. South America remains a developing region, with Brazil and Argentina as primary demand centers in financial services and telecommunications. The Middle East and Africa are supported by digital infrastructure programs in Saudi Arabia and the United Arab Emirates. Local data handling and compliance needs are increasing the value of providers with regional delivery capacity. Regional differences in buyer maturity, regulation, cloud adoption, and skilled delivery resources shape how the outcome-based managed services market develops. Providers therefore need to adjust commercial terms, operating controls, and delivery methods to local conditions.
Competitive Landscape
Market Concentration
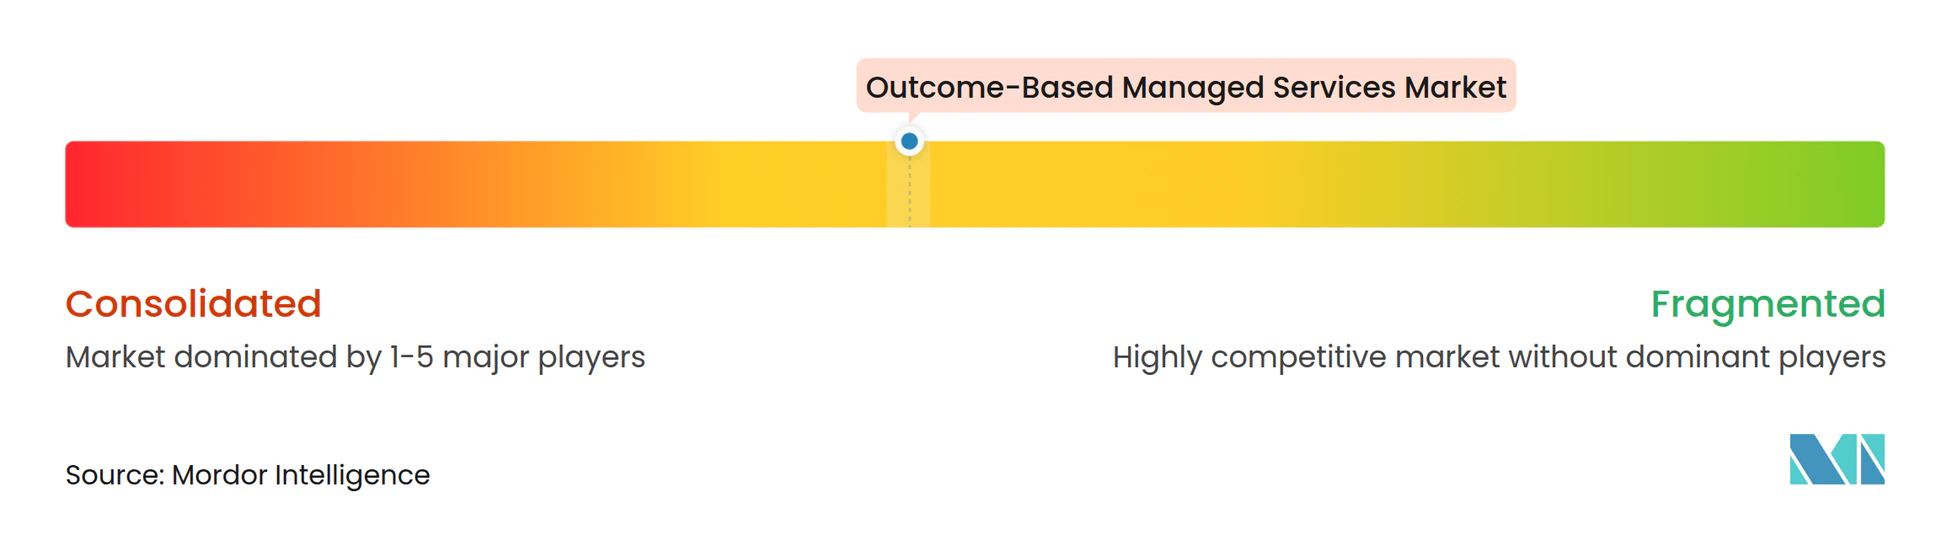
The outcome-based managed services market is moderately consolidated among global providers that have the scale to support large, complex, multi-year contracts. Accenture, TCS, IBM, Capgemini, Infosys, HCL Technologies, Wipro, and Kyndryl compete through AI platforms, delivery automation, domain experience, and the financial capacity to accept performance risk. Their position in the outcome-based managed services market depends on whether they can connect technical operations with business results that clients recognize and can measure. Large providers can invest in data platforms, reusable tools, delivery centers, and specialized talent across regions. That investment matters because shared-risk agreements require reliable data, governance processes, and operating controls before a provider can commit to a result.
The outcome-based managed services market also rewards providers that can manage the commercial implications of automation. When a provider improves efficiency through AI, it needs a contract structure that recognizes the value of that improvement rather than simply reducing the amount of billable labor. TCS uses WisdomNext, IBM uses watsonx Orchestrate, Wipro uses WINGS, Kyndryl uses Agentic Service Management, and DXC Technology uses OASIS to position AI within managed delivery. These platforms combine automation, monitoring, and service management within a more consistent operating model. They are intended to help providers establish a baseline, observe delivery changes, and document whether agreed measures have been met. The outcome-based managed services market therefore increasingly treats AI instrumentation as part of the evidence behind a contractual commitment, not only as a productivity tool.
LTIMindtree, Tech Mahindra, NTT DATA, Genpact, and Fujitsu compete through vertical knowledge and regional delivery density. The outcome-based managed services market gives these firms opportunities in healthcare, manufacturing, and telecommunications, where process knowledge can be as important as a global platform. Cloud infrastructure providers also influence the landscape by enabling partner-delivered services, even when they do not directly accept business-outcome accountability. Healthcare IT and Asia-Pacific government modernization remain areas where demand may exceed the outcome-contract experience of local providers. European market access requires providers to address cloud outsourcing, incident reporting, and data governance expectations. The outcome-based managed services market favors firms that can balance reusable global methods with local regulatory, contractual, and operating needs. This balance becomes more important when a service is delivered across several jurisdictions but the expected result is measured locally. Smaller providers can remain competitive when their industry expertise, regional relationships, and delivery model address requirements that larger competitors cannot meet as closely.
Outcome-Based Managed Services Industry Leaders
-
Accenture plc
-
International Business Machines Corporation
-
Capgemini SE
-
Tata Consultancy Services Limited
-
Cognizant Technology Solutions Corporation
- *Disclaimer: Major Players sorted in no particular order
Outcome-Based Managed Services Market Companies Covered in this Report
- Accenture plc
- International Business Machines Corporation
- Capgemini SE
- Tata Consultancy Services Limited
- Cognizant Technology Solutions Corporation
- HCL Technologies Limited
- Infosys Limited
- Wipro Limited
- DXC Technology Company
- Fujitsu Limited
- NTT DATA Corporation
- Atos SE
- Hewlett Packard Enterprise Company
- Microsoft Corporation
- Amazon Web Services, Inc.
- Cisco Systems, Inc.
- CGI Inc.
- LTIMindtree Limited
- Tech Mahindra Limited
- Genpact Limited
- Kyndryl, Inc.
Recent Industry Developments in Outcome-Based Managed Services Market
- October 2026: Kyndryl and WPP expanded their strategic partnership to drive enterprise transformation, with WPP committing to leveraging Kyndryl's Agentic AI Framework across its operations and Kyndryl naming WPP as its preferred global marketing partner. The expanded agreement also initiates joint go-to-market initiatives targeting core business platform transformation for shared enterprise clients.
- September 2026: Kyndryl was awarded a 10-year NASPO ValuePoint contract, ID LS5006, to provide cloud, software, and modernization services to state and local government agencies across the United States, covering cybersecurity resilience, digital service delivery, and multi-phase technology transformation.
- March 2026: Kyndryl was awarded a Texas Department of Information Resources contract, DIR-CPO-6161, to provide deliverables-based IT services to state and local government agencies, covering security, cloud, AI, and application modernization in a structure that directly embeds outcome accountability into public-sector procurement.
- March 2026: Atos SE reported full-year 2025 orders of EUR 7,084 million (USD 7.94 million), with a contract renewal rate of 92%, up from 89% in 2024, including a cybersecurity contract with the European Commission and a cloud and infrastructure contract with a leading North American insurer.
Global Outcome-Based Managed Services Market Report Scope
Outcome-based managed services are a commercial and delivery model in which providers are accountable for achieving predefined, measurable business results such as cost reduction, improved availability, risk reduction, productivity gains, or customer satisfaction rather than simply supplying staff, effort, or technology. Pricing and incentives are commonly linked to the achievement of agreed key performance indicators or business outcomes.
The Outcome-Based Managed Services Market Report is Segmented by Outcome Type (Cost Reduction and Savings-Share Outcomes, Productivity and Throughput Outcomes, Revenue Growth and Conversion Outcomes, Customer Experience and Retention Outcomes, Employee Experience and Workforce Productivity Outcomes, Service Quality and Resolution Outcomes, and Other Outcome Types), Service Domain (Managed IT Services, Managed Security Services, Managed Cloud and Infrastructure Services, Managed Application Services, Managed Data and AI Services, Managed Network Services, and Other Service Domains), Deployment Mode (Cloud-Based, On-Premises, and Hybrid), Organization Size (Large Enterprises, and Small and Medium-Sized Enterprises), End-User Industry (Banking, Financial Services and Insurance (BFSI), IT and Telecommunications, Healthcare and Life Sciences, Government and Public Sector, Industrial Manufacturing, Retail and E-Commerce, and Other End-User Industries), and Geography (North America, South America, Europe, Asia-Pacific, Middle East, and Africa). The Market Forecasts are Provided in Terms of Value (USD).
Segmentation Overview
| Cost Reduction and Savings-Share Outcomes |
| Productivity and Throughput Outcomes |
| Revenue Growth and Conversion Outcomes |
| Customer Experience and Retention Outcomes |
| Employee Experience and Workforce Productivity Outcomes |
| Service Quality and Resolution Outcomes |
| Other Outcome Types |
| Managed IT Services |
| Managed Security Services |
| Managed Cloud and Infrastructure Services |
| Managed Application Services |
| Managed Data and AI Services |
| Managed Network Services |
| Other Service Domains |
| Cloud-Based |
| On-Premises |
| Hybrid |
| Large Enterprises |
| Small and Medium Enterprises |
| Banking, Financial Services and Insurance (BFSI) |
| IT and Telecommunications |
| Healthcare and Life Sciences |
| Government and Public Sector |
| Industrial Manufacturing |
| Retail and E-Commerce |
| Other End-User Industries |
| North America | United States |
| Canada | |
| Mexico | |
| South America | Brazil |
| Argentina | |
| Rest of South America | |
| Europe | United Kingdom |
| Germany | |
| France | |
| Italy | |
| Spain | |
| Rest of Europe | |
| Asia-Pacific | China |
| Japan | |
| India | |
| Australia | |
| Rest of Asia-Pacific | |
| Middle East | Saudi Arabia |
| United Arab Emirates | |
| Rest of Middle East | |
| Africa | South Africa |
| Rest of Africa |
| By Outcome Type | Cost Reduction and Savings-Share Outcomes | |
| Productivity and Throughput Outcomes | ||
| Revenue Growth and Conversion Outcomes | ||
| Customer Experience and Retention Outcomes | ||
| Employee Experience and Workforce Productivity Outcomes | ||
| Service Quality and Resolution Outcomes | ||
| Other Outcome Types | ||
| By Service Domain | Managed IT Services | |
| Managed Security Services | ||
| Managed Cloud and Infrastructure Services | ||
| Managed Application Services | ||
| Managed Data and AI Services | ||
| Managed Network Services | ||
| Other Service Domains | ||
| By Deployment Mode | Cloud-Based | |
| On-Premises | ||
| Hybrid | ||
| By Organization Size | Large Enterprises | |
| Small and Medium Enterprises | ||
| By End-User Industry | Banking, Financial Services and Insurance (BFSI) | |
| IT and Telecommunications | ||
| Healthcare and Life Sciences | ||
| Government and Public Sector | ||
| Industrial Manufacturing | ||
| Retail and E-Commerce | ||
| Other End-User Industries | ||
| By Geography | North America | United States |
| Canada | ||
| Mexico | ||
| South America | Brazil | |
| Argentina | ||
| Rest of South America | ||
| Europe | United Kingdom | |
| Germany | ||
| France | ||
| Italy | ||
| Spain | ||
| Rest of Europe | ||
| Asia-Pacific | China | |
| Japan | ||
| India | ||
| Australia | ||
| Rest of Asia-Pacific | ||
| Middle East | Saudi Arabia | |
| United Arab Emirates | ||
| Rest of Middle East | ||
| Africa | South Africa | |
| Rest of Africa | ||
Key Questions Answered in the Report
What is the size of the outcome-based managed services market?
The outcome-based managed services market size was valued at USD 12.86 billion in 2026 and is estimated to grow from USD 13.71 billion in 2027 to reach USD 19.48 billion by 2032, at a CAGR of 7.28% during the forecast period (2027-2032).
Which outcome category leads managed services demand?
Cost reduction and savings-share outcomes lead with 27.83% of revenue in 2026. They remain the most common entry point because the starting cost base and the resulting savings can usually be defined more clearly than broader measures such as customer retention or revenue conversion. Buyers can use these agreements to test performance-based pricing before applying it to outcomes that depend on a wider range of business, operational, or customer factors.
Which service domain is expected to expand fastest?
Managed data and AI services are projected to advance at a 9.73% CAGR through 2032. Buyers are seeking AI-ready data platforms, generative AI governance, and operating models that can validate whether AI tools are producing the agreed result in day-to-day delivery. The service domain is also becoming more important because AI capabilities are being applied across IT, cloud, security, applications, and business processes. Providers must show that their data and governance practices can support those capabilities without weakening accountability for results.
Why are cloud-based services important to outcome contracts?
Cloud-based services held 72.51% of revenue in 2026 because telemetry, scaling, and policy automation support continuous performance measurement. These features help providers report results, identify service issues, and apply consistent controls across a distributed technology estate.
Which buyer group is expanding fastest?
Small and medium-sized enterprises are projected to expand at a 10.21% CAGR through 2032. Cloud-native delivery can reduce the cost and complexity of adoption, although providers must offer clear and repeatable measures that smaller organizations can monitor without extensive internal governance teams. Standard service tiers, simple reporting, and defined accountability are particularly important for these buyers because bespoke contract administration may be difficult to maintain.
Which region is projected to lead regional expansion?
Asia-Pacific is expected to record the highest regional CAGR at 9.49% through 2032. The region combines investment in digital infrastructure with cloud adoption and technology skill shortages, while local data requirements increase demand for providers that can deliver and govern services within individual markets.