
Experience-Level Agreement (XLA) Managed Service Desk Market Size and Share
Market Overview
| Study Period | 2021 - 2032 |
|---|---|
| Market Size (2027) | USD 5.48 Billion |
| Market Size (2032) | USD 10.04 Billion |
| Growth Rate (2027 - 2032) | 12.87 % |
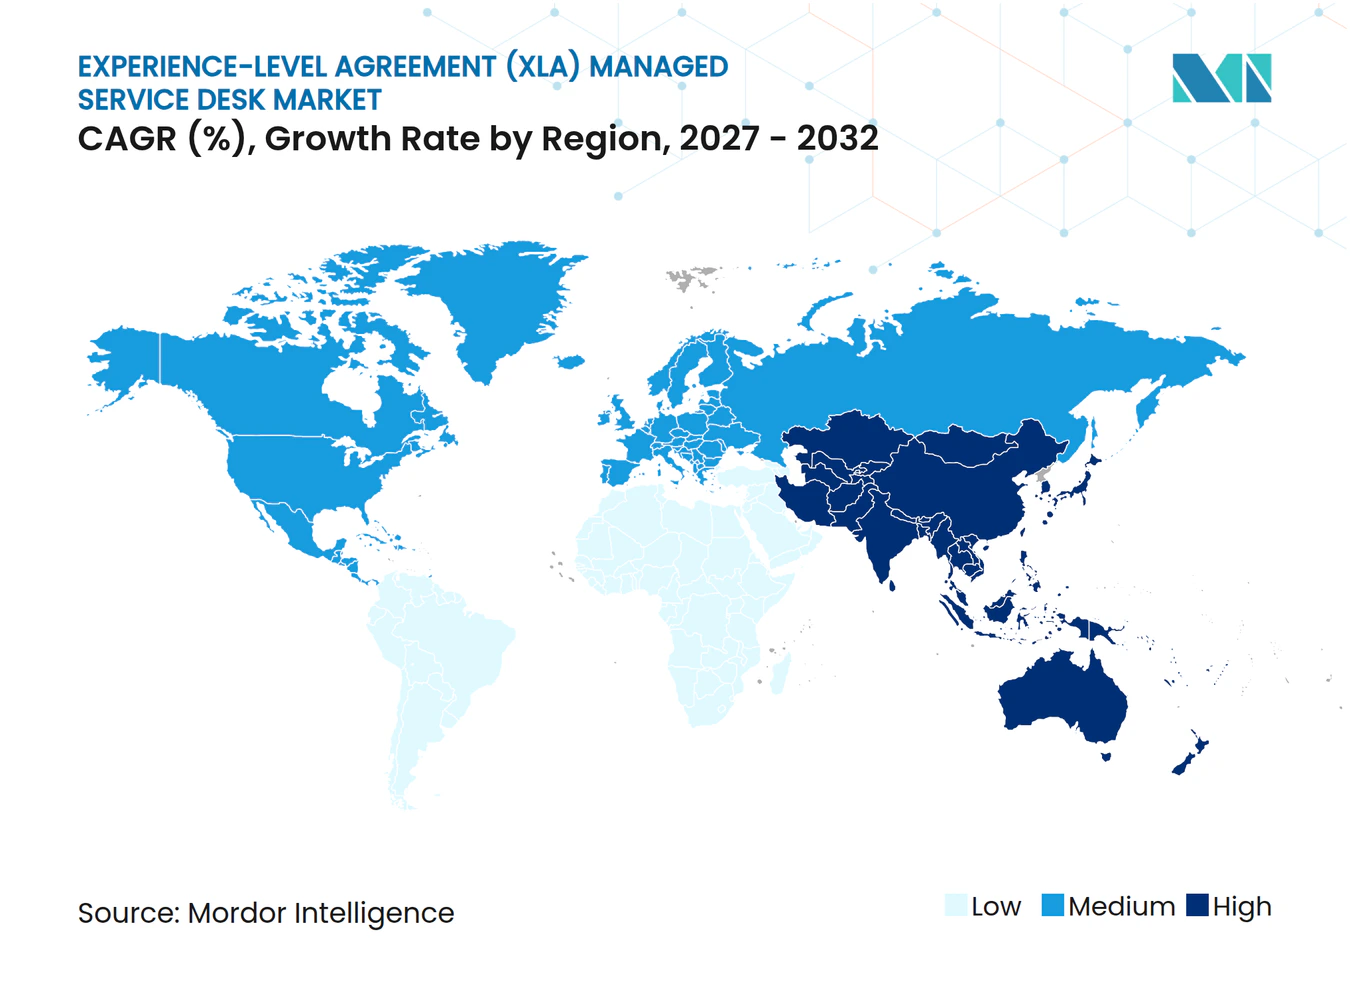
| Fastest Growing Market | Asia-Pacific |
| Largest Market | North America |
| Market Concentration | Medium |
Major Players *Disclaimer: Major Players sorted in no particular order Image © Mordor Intelligence. Reuse requires attribution under CC BY 4.0. | |
Experience-Level Agreement (XLA) Managed Service Desk Market Analysis by Mordor Intelligence
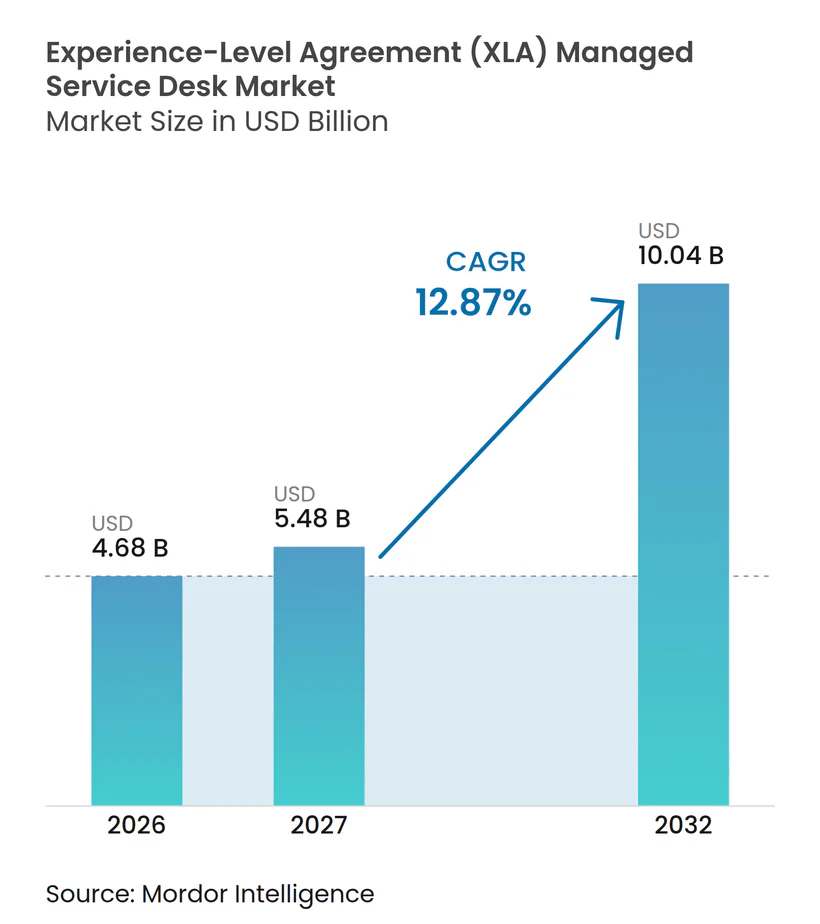
The Experience-Level Agreement (XLA) managed service desk market size is projected to expand from USD 4.68 billion in 2026 to USD 10.04 billion by 2032, registering a CAGR of 12.87% between 2027 to 2032. The XLA managed service desk market is moving toward contracts that measure the quality of employees' digital experience rather than only system availability and ticket volumes. This change is making experience measurement, service governance, and remediation capability part of the core managed service proposition. Providers are responding by combining automation, endpoint monitoring, and analytics with traditional service desk delivery. Buyers are also seeking clearer accountability across multi-vendor technology environments, especially where poor device, application, or network performance interrupts work. The XLA managed service desk market, therefore, favors suppliers that can turn experience data into timely service action and contractual reporting.
Key Report Takeaways
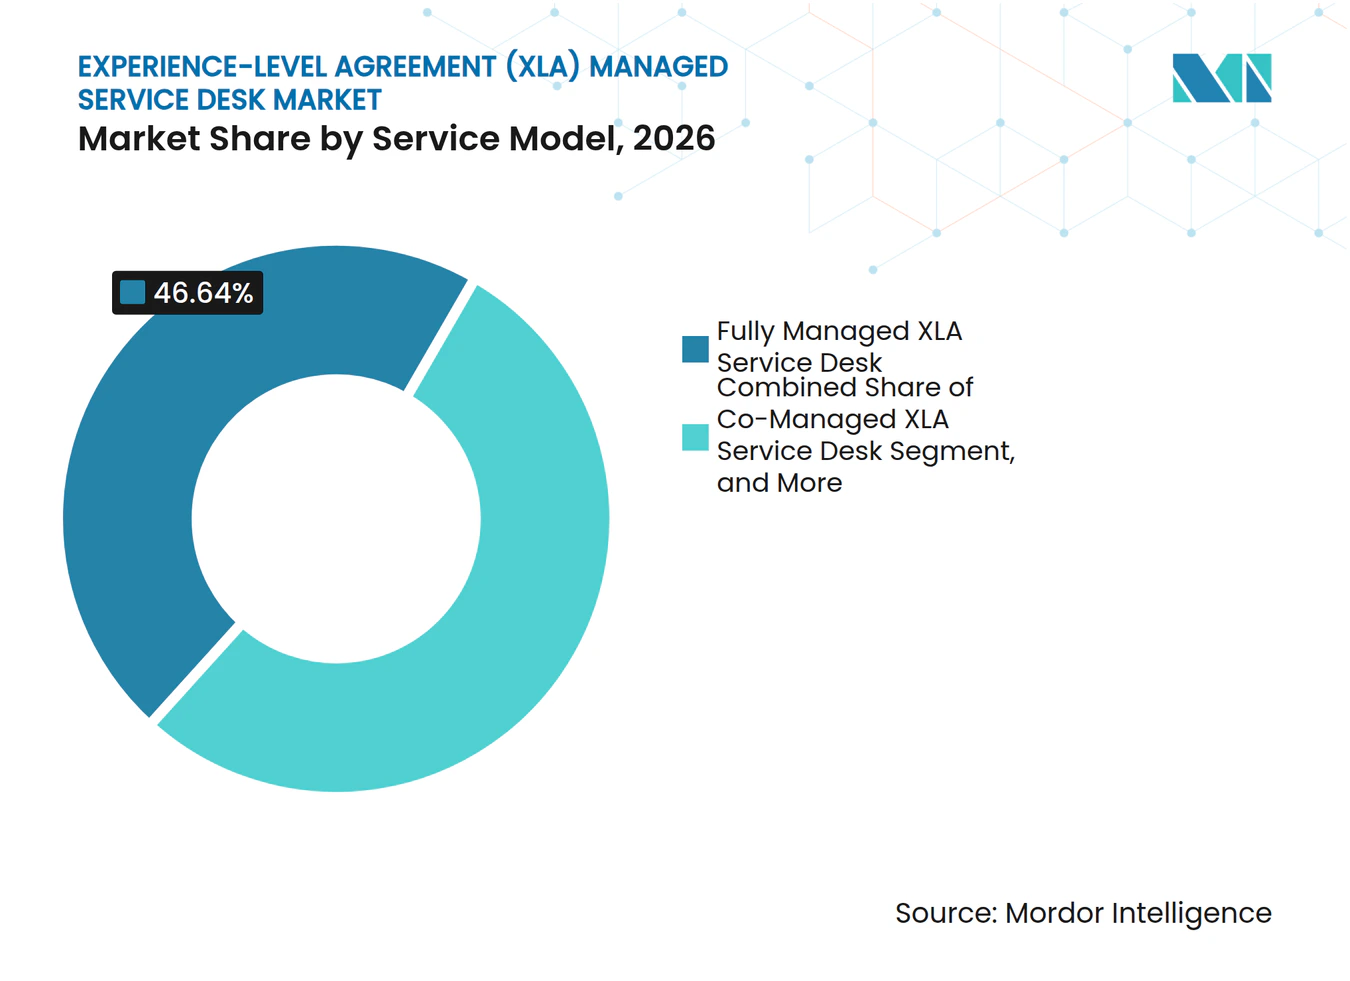
- By service model, Fully Managed XLA Service Desk held 46.64% of the Experience-Level Agreement (XLA) managed service desk market share in 2026, while XLA Measurement and Analytics as a Service is projected to expand at a 13.14% CAGR through 2032.
- By service scope, Level 1 Service Desk Support accounted for 33.26% of the Experience-Level Agreement (XLA) managed service desk market size in 2026, while Level 0 and Self-Service Support is projected to expand at a 12.99% CAGR through 2032.
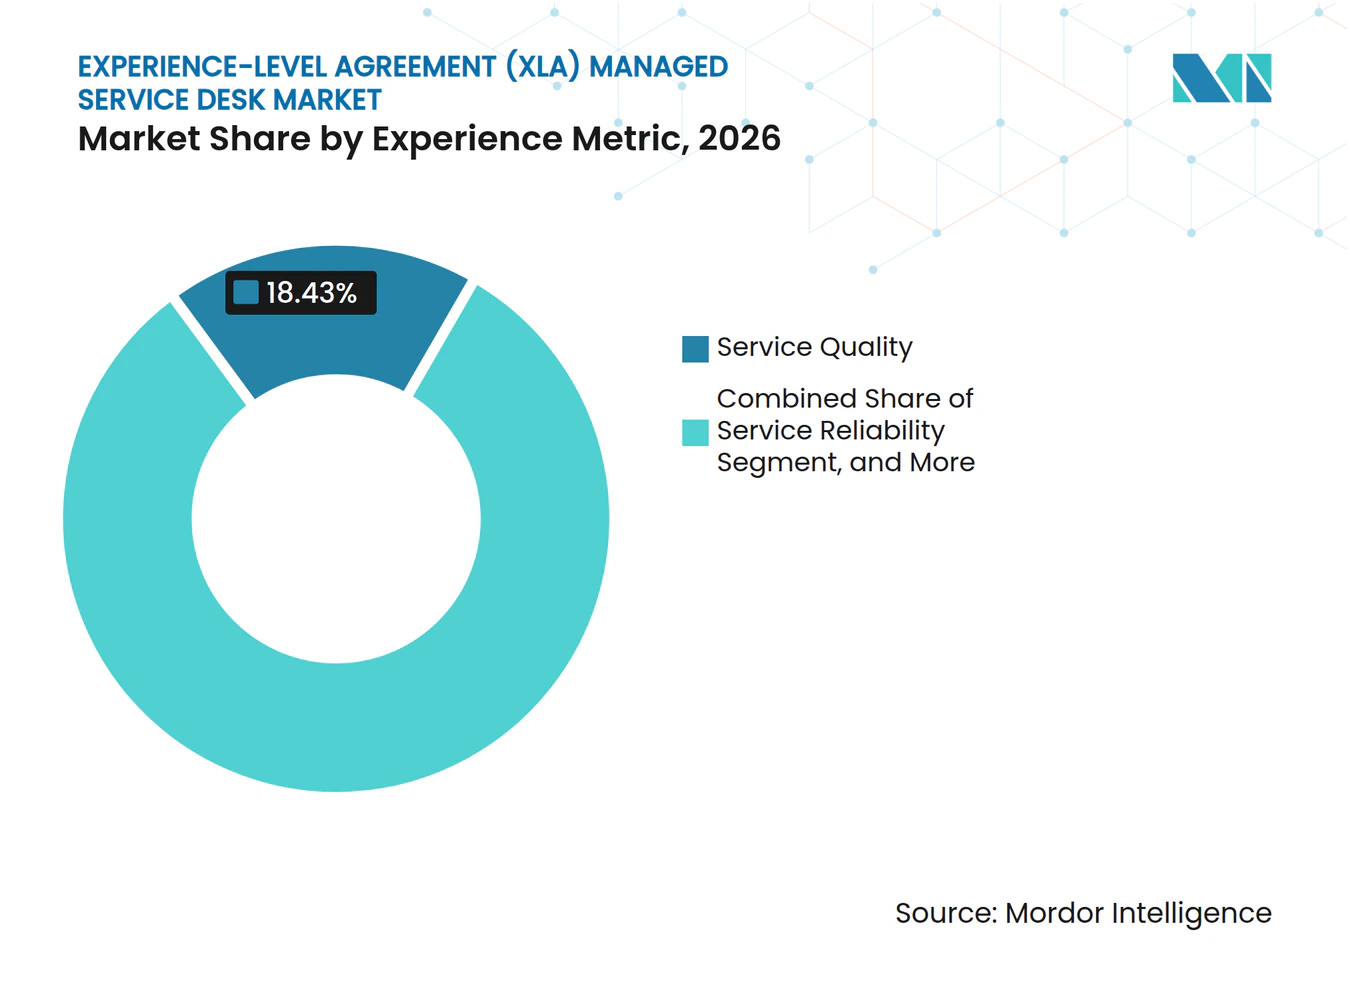
- By experience metric, Service Quality held 18.43% share in 2026, while Productivity and Workflow Interruption is projected to expand at a 13.16% CAGR through 2032.
- By end-user industry, BFSI held 25.82% share in 2026, while Healthcare and Life Sciences is projected to expand at a 13.27% CAGR through 2032.
- By geography, North America held 38.37% share in 2026, while Asia-Pacific is projected to expand at a 13.28% CAGR through 2032.
Note: Market numbers in this report are based on Mordor Intelligence's proprietary estimation framework, which combines nine months of actuals with Q4 projections for base year 2026.
Market Trends and Insights
Drivers Impact Analysis of Experience-Level Agreement (XLA) Managed Service Desk Market*
| Driver | (~) % Impact on CAGR Forecast | Geographic Relevance | Impact Timeline |
|---|---|---|---|
| Hybrid Work Makes Experience Outcomes Contractual | +3.2% | Global, strongest in North America and Europe | Short term (≤ 2 years) |
| AI-Powered Self-Service and Agent Assist Reduce Friction | +2.9% | Global, Asia-Pacific scaling rapidly | Short term (≤ 2 years) |
| Endpoint and Application Telemetry Enables Proactive Support | +2.1% | North America and EU | Medium term (2-4 years) |
| Outcome-Based MSP Procurement Expands XLA Adoption | +1.8% | Global | Medium term (2-4 years) |
| Frontline and Mobile Workforce Digitization | +1.3% | Asia-Pacific, Middle East and Africa, South America | Medium term (2-4 years) |
| Channel-Specific Experience Measurement Improves Service Governance | +0.8% | North America and EU | Long term (≥ 4 years) |
| Source: Mordor Intelligence | |||
Hybrid Work Makes Experience Outcomes Contractual
Hybrid work has made the employee technology experience a contractual concern for organizations that rely on distributed teams. Traditional service-level measures can show that systems are available even when employees cannot complete work without friction. This gap is increasing interest in XLAs that combine operational data with employee experience measures. Computacenter reported in June 2025 that 43% of surveyed organizations had implemented XLAs, while 68% of organizations that had not implemented them planned to do so within 18 months. The same work found that 77% of European respondents planned adoption within 18 months, which points to procurement activity rather than isolated testing.[1] The Experience-Level Agreement (XLA) managed service desk market benefits when providers can report on technical performance, user sentiment, and service outcomes in a single governance model.
AI-Powered Self-Service and Agent Assist Reduce Friction
AI-enabled self-service is changing where service desk work is completed and how users experience support. Autonomous tools can classify, diagnose, and address some incidents before a ticket reaches an agent. Riverbed reported in 2025 that employees spent 42% of their workweek using unified communications tools, 43% of organizations reported performance issues with those tools, and an average service desk ticket required 43 minutes to resolve.[2] These conditions place greater value on preventing disruption rather than only resolving tickets after they are created. ServiceNow launched Flow in October 2026 as an AI-native conversational service desk that works within Slack and Microsoft Teams without a separate implementation project or training requirement. The XLA managed service desk market is consequently shifting toward providers that can measure whether automation has reduced employee effort and restored work quickly.
Endpoint and Application Telemetry Enables Proactive Support
Endpoint and application telemetry provides the evidence base for experience-led service delivery. Device health, application response, and network quality data help providers find emerging issues before they become visible to employees. ManageEngine added digital employee experience capabilities to Endpoint Central in August 2025, including monitoring for more than 20 predefined experience metrics, root-cause analytics, automated remediation, scoring, and benchmarking. DXC Technology describes an employee experience analytics approach that brings together device performance and external data to identify patterns and anomalies. This evidence allows a provider to establish baselines, select realistic XLA thresholds, and show whether remediation has improved the employee experience. The Experience-Level Agreement (XLA) managed service desk market gains from telemetry when the data is linked to a service action rather than retained as a passive dashboard.
Outcome-Based MSP Procurement Expands XLA Adoption
Large organizations are increasingly assessing managed service desk partners on measurable experience and business results. This procurement approach gives providers a reason to integrate measurement, service delivery, and continuous improvement into a single contract. Tata Consultancy Services received a EUR 140 million (USD 156.84 million) contract for service desk, operational service integration, and workplace management from NS Groep in December 2025. Shared Services Canada awarded Kyndryl Canada a contract for enterprise service desk, end-user service desk, and enterprise command center professional services in February 2025.[3] Such purchases show that large buyers can select broad service desk arrangements with defined delivery expectations. The Experience-Level Agreement (XLA) managed service desk market is more accessible to providers that can document performance, explain causes of poor experiences, and connect improvement plans to contract governance.
Restraints Impact Analysis of Experience-Level Agreement (XLA) Managed Service Desk Market*
| Restraint | (~) % Impact on CAGR Forecast | Geographic Relevance | Impact Timeline |
|---|---|---|---|
| Employee Telemetry Privacy and Consent Requirements | -2.2% | EU, United Kingdom, North America | Short term (≤ 2 years) |
| Ambiguous Ownership of Experience Outcomes | -1.5% | Global | Medium term (2-4 years) |
| Tool Overlap With Existing ITSM and DEX Platforms | -1.1% | North America and EU | Short term (≤ 2 years) |
| Difficult Attribution of Productivity and Business Impact | -0.7% | Global | Long term (≥ 4 years) |
| Source: Mordor Intelligence | |||
Employee Telemetry Privacy and Consent Requirements
Experience measurement data can also raise concerns about employee monitoring. Detailed information on application usage, device activity, location, and home network conditions requires a clear and proportionate purpose. The United Kingdom Information Commissioner's Office states that employers must consider data protection requirements when monitoring workers and conduct a data protection impact assessment for high-risk processing. The European Data Protection Board reported an Italian enforcement action involving a fine related to the tracking of employees using company vehicles. These requirements can restrict the data fields that managed service providers use for XLA programs. The XLA managed service desk market must therefore support transparent data practices, limited data collection, and service designs that distinguish experience measurement from unnecessary employee surveillance.
Ambiguous Ownership of Experience Outcomes
A single employee experience often depends on several technology providers. One company may run the network, another may manage endpoint devices, and a third may support applications or collaboration platforms. This division makes it difficult to decide who owns a fall in an experience score or who should fund corrective work. In multi-vendor settings, each supplier may provide evidence that its own service metric was met even though the employee could not complete a task. Contract negotiations can become longer when clients seek a lead provider that will coordinate causes across the technology environment. The Experience-Level Agreement (XLA) managed service desk market faces slower adoption in these situations because experience accountability must be agreed before performance commitments can be priced and delivered.
*Our forecasts treat driver/restraint impacts as directional, not additive. The impact forecasts reflect baseline growth, mix effects, and variable interactions.
Experience-Level Agreement (XLA) Managed Service Desk Market Segment Analysis
By Service Model:
Analytics Services Expand the XLA Delivery ModelFully Managed XLA Service Desk held 46.64% of the Experience-Level Agreement (XLA) managed service desk market share in 2026. Large enterprises often prefer one partner to handle service delivery, experience measurement, reporting, and improvement planning. A unified model limits the need to reconcile data across different delivery organizations. It also gives the provider direct responsibility for operational performance and the employee experience. Kyndryl positions Experience Management as a Service as a structured offer that covers journey mapping, XLA design, measurement, and experience improvement. Co-managed contracts remain relevant where internal IT teams retain control over sensitive infrastructure or specific service processes. These arrangements are particularly suitable for buyers who need external expertise without fully outsourcing day-to-day operations.
XLA Measurement and Analytics as a Service is projected to expand at a 13.14% CAGR through 2032. Its momentum shows that buyers increasingly view experience analytics as a distinct procurement need rather than only a feature of a broader service desk agreement. Modular analytics can complement existing IT service management systems and help clients avoid replacing established platforms. This approach can also allow smaller service providers to offer experience measurement without building every tool in-house. Advisory and transformation services serve buyers that are still defining experience measures, governance structures, and baselines. The XLA managed service desk industry is likely to use these services as an entry point before a client commits to a fully managed operating model. Providers with interoperable analytics and practical transition support can address both early-stage and mature XLA programs.



By Service Scope:
Self-Service Automation Changes the Value of Level 1 SupportLevel 1 Service Desk Support accounted for 33.26% of the Experience-Level Agreement (XLA) managed service desk market size in 2026. Human-assisted first-contact resolution remains important for issues that are complex, unclear, or unsuitable for automation. This scope includes employee contact through phone, chat, portals, and integrated collaboration channels. It remains the common entry point for unresolved issues across many enterprise environments. Level 2 and specialized support provide deeper technical expertise for incidents that require escalation. Deskside and field support also remain essential in manufacturing and healthcare settings where equipment, devices, and local workflows need physical assistance. Major incident and problem management add further value because business disruption can require coordinated support across several teams.
Level 0 and Self-Service Support is projected to expand at a 12.99% CAGR through 2032. The segment includes automated support that resolves straightforward issues before employees interact with a service desk agent. Riverbed introduced Aternity Self-Service in October 2025 to triage, diagnose, and remediate endpoint and unified communications issues autonomously, while creating context-rich tickets for issues that require escalation. ControlUp introduced a frontline-worker offering in August 2025 that extended device analytics to Android devices used in retail, logistics, field services, and manufacturing. Automation does not remove the need for Level 1 support because difficult cases still require skilled agents. Instead, it changes the Level 1 mix toward exceptions, higher-value cases, and coordination work where the quality of the employee experience is most visible.
By Experience Metric:
Productivity Becomes a Central Business MeasureService Quality held 18.43% share of the Experience-Level Agreement (XLA) managed service desk market size in 2026. It is often the first experience measure used in an XLA because organizations can combine satisfaction, resolution quality, and channel performance into a trackable baseline. Service Quality can be reviewed regularly and compared over time as providers, tools, or workflows change. Employee Satisfaction and Sentiment are closely related measures that help service leaders understand how staff experience support interactions. Service Reliability remains important because digital services must be stable before broader experience promises can be credible. Requester Effort, Adoption, and Successful Outcome measures expand the discussion from the service interaction to whether employees can use technology effectively.
Productivity and workflow interruption are projected to expand at a 13.16% CAGR through 2032. This measure links technology disruption to the time employees lose when devices, applications, or communications tools do not work as required. Riverbed reported that an average service desk ticket took 43 minutes to resolve in its 2025 research. This type of evidence helps finance and operations leaders assess IT issues in terms of workforce output rather than only service desk throughput. It also gives providers a stronger reason to identify recurring causes and prevent interruptions. The Experience-Level Agreement (XLA) managed service desk market will continue to prioritize metrics that explain whether an employee completed a task without unnecessary effort. A broader scorecard can help clients avoid relying on a single satisfaction or availability measure.

By End-User Industry:
Healthcare Demand Advances Alongside BFSI LeadershipBFSI held 25.82% of the Experience-Level Agreement (XLA) managed service desk market size in 2026. Banking and insurance organizations manage large technology environments that extend across branches, trading locations, remote workforces, and corporate offices. Their operating models require clear documentation, controlled processes, and reliable escalation paths. This environment makes structured experience measurement relevant alongside existing operational resilience and security requirements. BFSI buyers also have the procurement maturity to set formal performance expectations for managed service providers. Information technology and telecommunications organizations remain sophisticated buyers because they often modernize their workplace and support systems early. Manufacturing, retail, and e-commerce organizations are showing increasing interest as frontline workers use more connected devices and applications.
Healthcare and Life Sciences are projected to expand at a 13.27% CAGR through 2032. Clinical teams experience direct workflow disruption when access to systems, devices, or communication tools fails. These disruptions can affect administrative work, care coordination, and the practical use of digital health systems. Healthcare buyers therefore have a strong reason to ask providers to identify issues before they interrupt users. The sector also needs service designs that respect data protection and security requirements. Experience measurement can support operational resilience when it is designed around work context rather than simple ticket counts. The Experience-Level Agreement (XLA) managed service desk market has an opportunity where providers can combine technical support with a clear understanding of clinical and life sciences workflows.
Geography Analysis
North America Experience-Level Agreement (XLA) Managed Service Desk Market
North America held 38.37% of the Experience-Level Agreement (XLA) managed service desk market share in 2026. The region has a large base of enterprise technology buyers with established outsourced service desk relationships. Many buyers have moved beyond basic service-level reporting and now seek more detailed evidence of the employee experience. Public-sector procurement also supports this direction. Kyndryl received a Texas Department of Information Resources contract in March 2026 that gives state and local government agencies access to deliverables-based technology services. Canada also awarded Kyndryl a federal service desk contract in February 2025. Mexico remains at an earlier stage but may benefit as nearshore delivery models gain traction among United States enterprises.
Europe Experience-Level Agreement (XLA) Managed Service Desk Market
Europe is advancing through procurement reform and data protection requirements. In 2025, Computacenter found that 77% of surveyed European respondents planned to adopt XLAs within 18 months. Germany and the United Kingdom have established service-management communities that support structured approaches to experience governance. European buyers also need to consider employee monitoring rules when using endpoint and application telemetry. This constraint can make program design more deliberate and improve clarity around the purpose of data and consent. The Experience-Level Agreement (XLA) managed service desk market in Europe benefits when providers can align experience measurement with contractual accountability and data protection expectations. Large infrastructure and public service organizations provide a visible foundation for long-duration managed technology partnerships.
APAC, MEA and South America Experience-Level Agreement (XLA) Managed Service Desk Market
Asia-Pacific is projected to expand at a 13.28% CAGR through 2032. Cloud-first managed services, enterprise digitalization, and workplace modernization support demand across the region. Japan illustrates this shift through Kyndryl's September 2025 engagement with Murata Manufacturing to provide managed services for 1,000 servers and use the Kyndryl Bridge platform for operational visibility, automation, and AI-derived insights. India combines a large IT services delivery base with increasing domestic enterprise modernization activity. Southeast Asia and South Korea also have expanding digital workplace needs. The Middle East, Africa, and South America remain earlier-stage XLA markets. Multinational buyers may accelerate adoption by applying consistent global service governance requirements.
Competitive Landscape
Market Concentration
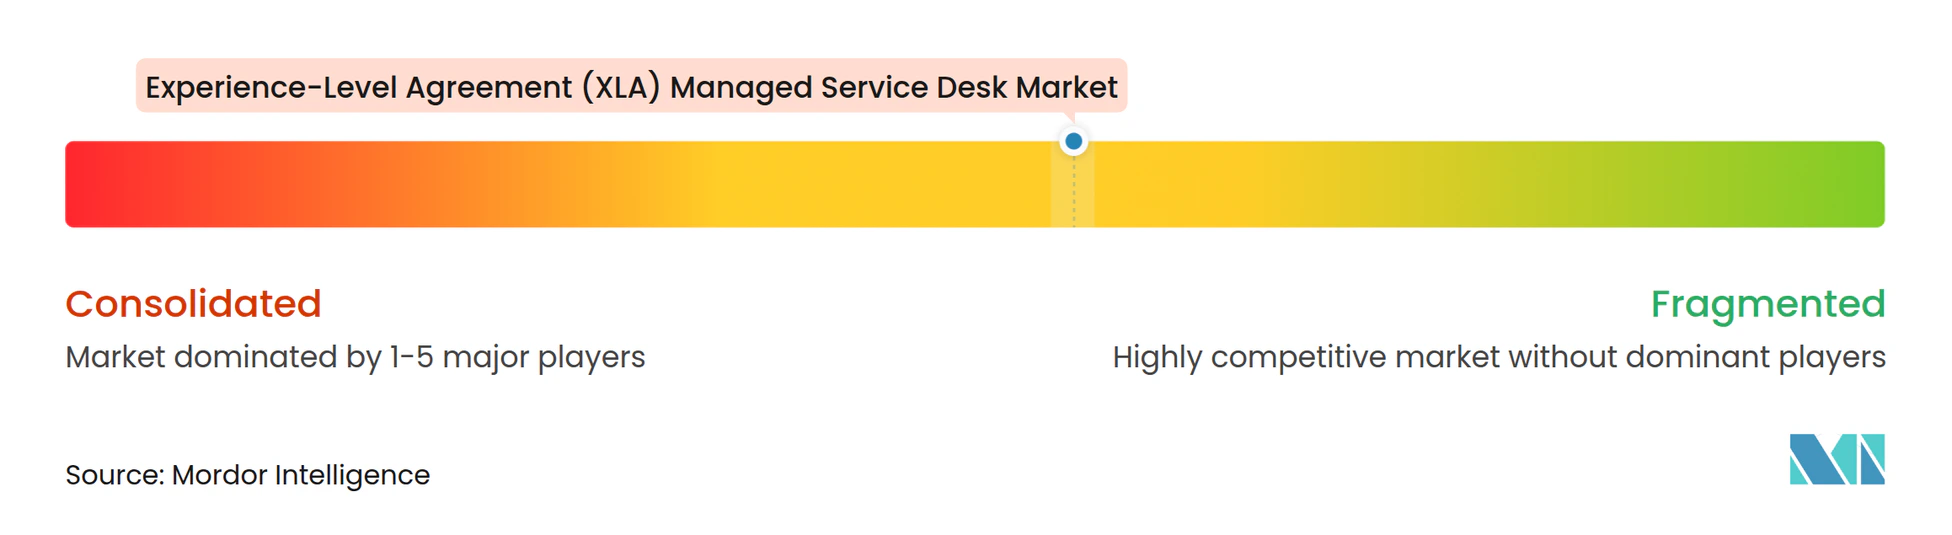
The Experience-Level Agreement (XLA) managed service desk market has a moderately consolidated group of global service providers that compete for large enterprise contracts. Kyndryl, Accenture, TCS, HCLTech, Capgemini, DXC Technology, and Wipro have broad delivery reach and established digital workplace capabilities. Their scale helps them support clients across regions and integrate service desk, workplace, cloud, and security services. Kyndryl has positioned its Experience Management as a Service offer around journey mapping, XLA design, measurement, and improvement. DXC Technology uses employee experience analytics and account-level experience management roles to translate operational data into service governance. These moves show that leading providers are treating experience measurement as a delivery capability rather than a separate reporting feature.
Competitive differentiation increasingly depends on the ability to connect automation, analytics, and managed service delivery. Wipro expanded its Google Cloud partnership in August 2026 to deploy Gemini Enterprise internally and certify more than 10,000 AI specialists, including 1,500 Forward Deployed Engineers. This investment supports the firm's ability to apply AI in core service workflows. ServiceNow launched Flow in October 2026, providing an AI-native conversational service desk that can be deployed in existing Slack and Microsoft Teams environments. Software-led entrants can place pressure on traditional providers by offering faster deployment and accessible automation. Traditional managed service providers respond by embedding those technologies into larger delivery and governance models. The XLA managed service desk market therefore rewards providers that can combine technology flexibility with accountable operating support.
There is space for providers that serve mid-sized enterprises or specialized vertical needs. Some buyers may consider large global contracts too extensive or rigid for their operating model. Healthcare clients may require support tied to clinical workflows, while financial institutions may require experience measurement for critical applications and tightly controlled environments. Modular pricing and outcome-based service structures can help providers address these requirements without forcing a fully standardized contract. Compliance credentials and established service-management practices can also shape selection in regulated sectors. The competitive narrative remains consistent with moderate concentration because global providers have strong capabilities, but specialized providers and technology platforms still have room to address defined gaps. No combined market share for the largest suppliers was provided, so a quantitative concentration score cannot be supported from the available evidence.
Experience-Level Agreement (XLA) Managed Service Desk Industry Leaders
-
Accenture plc
-
NTT DATA Corporation
-
Unisys Corporation
-
DXC Technology Company
-
HCLTech
- *Disclaimer: Major Players sorted in no particular order
Experience-Level Agreement (XLA) Managed Service Desk Market Companies Covered in this Report
- Accenture plc
- Atos SE
- Capgemini SE
- CGI Inc.
- Cognizant Technology Solutions Corporation
- DXC Technology Company
- Fujitsu Limited
- HCLTech
- Hewlett Packard Enterprise Company
- International Business Machines Corporation
- Kyndryl Holdings, Inc.
- LTIMindtree Limited
- NTT DATA Corporation
- Orange Business
- Rackspace Technology, Inc.
- Tata Consultancy Services Limited
- Tech Mahindra Limited
- Unisys Corporation
- Wipro Limited
- Atento S.A.
- Freshworks Inc.
- ServiceNow, Inc.
- BMC Software, Inc.
- Nexthink SA
- Lakeside Software, LLC
- Riverbed Technology, Inc.
Recent Industry Developments in Experience-Level Agreement (XLA) Managed Service Desk Market
- October 2026: ServiceNow launched Flow by ServiceNow, an AI-native conversational service desk designed to deploy within existing Slack and Microsoft Teams environments, with no implementation project or training required. The service was available to existing customers on AI-capable pricing plans, with general availability for North America and Europe expected in Q4 2026.
- August 2026: Wipro Limited expanded its partnership with Google Cloud to scale internal deployment of Gemini Enterprise and certify more than 10,000 AI specialists, including 1,500 Forward Deployed Engineers. The partnership included the LIFT framework and Wipro's WINGS and WEGA platforms for embedded autonomous AI agents in core IT service workflows.
- March 2026: Kyndryl received a Texas Department of Information Resources contract to provide deliverables-based technology services to state and local government agencies through the Texas DIR Cooperative Contracts Program.
- March 2026: DXC Technology was actively recruiting for modern workplace leadership roles requiring expertise in Digital Employee Experience, XLAs, AI-enabled operations, automation, self-service and outcome-based workplace services, indicating continued investment in these capabilities within its managed workplace portfolio.
Global Experience-Level Agreement (XLA) Managed Service Desk Market Report Scope
The Experience-Level Agreement (XLA) Managed Service Desk Market comprises outsourced IT service desk offerings in which providers are measured and compensated based on end-user experience outcomes such as satisfaction, sentiment, ease of use, productivity impact, and first-contact resolution rather than solely on traditional SLA metrics like ticket resolution time or uptime.
The Experience-Level Agreement (XLA) Managed Service Desk Market Report is Segmented by Service Model (Fully Managed XLA Service Desk, Co-Managed XLA Service Desk, XLA Advisory and Transformation Services, and XLA Measurement and Analytics as a Service), Service Scope (Level 0 and Self-Service Support, Level 1 Service Desk Support, Level 2 and Specialized Support, Deskside and Field Support, Major Incident and Problem Management, and Service Experience Governance), Experience Metric (Service Reliability, Service Quality, Requester Effort, Employee Satisfaction and Sentiment, Productivity and Workflow Interruption, and Adoption and Successful Outcome), End User Industry (Banking, Financial Services, and Insurance, Healthcare and Life Sciences, Information Technology and Telecommunications, Manufacturing, Retail and E-Commerce, Government and Public Sector, and Other End User Industries), and Geography (North America, South America, Europe, Asia-Pacific, and Middle East and Africa). The Market Forecasts Are Provided in Terms of Value (USD).
Segmentation Overview
| Fully Managed XLA Service Desk |
| Co-Managed XLA Service Desk |
| XLA Advisory and Transformation Services |
| XLA Measurement and Analytics as a Service |
| Level 0 and Self-Service Support |
| Level 1 Service Desk Support |
| Level 2 and Specialized Support |
| Deskside and Field Support |
| Major Incident and Problem Management |
| Service Experience Governance |
| Service Reliability |
| Service Quality |
| Requester Effort |
| Employee Satisfaction and Sentiment |
| Productivity and Workflow Interruption |
| Adoption and Successful Outcome |
| Banking, Financial Services, and Insurance |
| Healthcare and Life Sciences |
| Information Technology and Telecommunications |
| Manufacturing |
| Retail and E-Commerce |
| Government and Public Sector |
| Other End User Industries |
| North America | United States |
| Canada | |
| Mexico | |
| South America | Brazil |
| Argentina | |
| Chile | |
| Rest of South America | |
| Europe | Germany |
| United Kingdom | |
| France | |
| Italy | |
| Spain | |
| Rest of Europe | |
| Asia-Pacific | China |
| Japan | |
| India | |
| South Korea | |
| Rest of Asia-Pacific | |
| Middle East and Africa | Saudi Arabia |
| United Arab Emirates | |
| South Africa | |
| Egypt | |
| Rest of Middle East and Africa |
| By Service Model | Fully Managed XLA Service Desk | |
| Co-Managed XLA Service Desk | ||
| XLA Advisory and Transformation Services | ||
| XLA Measurement and Analytics as a Service | ||
| By Service Scope | Level 0 and Self-Service Support | |
| Level 1 Service Desk Support | ||
| Level 2 and Specialized Support | ||
| Deskside and Field Support | ||
| Major Incident and Problem Management | ||
| Service Experience Governance | ||
| By Experience Metric | Service Reliability | |
| Service Quality | ||
| Requester Effort | ||
| Employee Satisfaction and Sentiment | ||
| Productivity and Workflow Interruption | ||
| Adoption and Successful Outcome | ||
| By End User Industry | Banking, Financial Services, and Insurance | |
| Healthcare and Life Sciences | ||
| Information Technology and Telecommunications | ||
| Manufacturing | ||
| Retail and E-Commerce | ||
| Government and Public Sector | ||
| Other End User Industries | ||
| By Geography | North America | United States |
| Canada | ||
| Mexico | ||
| South America | Brazil | |
| Argentina | ||
| Chile | ||
| Rest of South America | ||
| Europe | Germany | |
| United Kingdom | ||
| France | ||
| Italy | ||
| Spain | ||
| Rest of Europe | ||
| Asia-Pacific | China | |
| Japan | ||
| India | ||
| South Korea | ||
| Rest of Asia-Pacific | ||
| Middle East and Africa | Saudi Arabia | |
| United Arab Emirates | ||
| South Africa | ||
| Egypt | ||
| Rest of Middle East and Africa | ||
Key Questions Answered in the Report
What is the size of the Experience-Level Agreement (XLA) Managed Service Desk Market?
The Experience-Level Agreement (XLA) managed service desk market size is USD 4.68 billion in 2026 and is forecast to reach USD 10.04 billion by 2032, at a 12.87% CAGR from 2027 to 2032.
What is driving adoption of XLA managed service desks?
Hybrid work, AI-enabled self-service, endpoint telemetry, and procurement focused on measurable employee experience are supporting adoption.
Which service model leads XLA managed service desk spending?
Fully Managed XLA Service Desk leads with 46.64% share in 2026, while XLA Measurement and Analytics as a Service has the highest forecast CAGR at 13.14%.
Why are AI tools important for managed service desks?
AI can reduce employee effort by handling routine diagnosis and resolution, while service teams focus on complex cases and experience improvement.
Which end-user sector has the highest XLA managed service desk growth outlook?
Healthcare and Life Sciences is projected to expand at a 13.27% CAGR through 2032 because clinical workflows are highly sensitive to technology disruption.
Which region has the strongest XLA managed service desk outlook?
North America leads with 38.37% share in 2026, while Asia-Pacific has the highest forecast CAGR at 13.28% through 2032.