
Gainshare and Value-Based Managed Services Market Size and Share
Market Overview
| Study Period | 2021 - 2032 |
|---|---|
| Market Size (2027) | USD 21.34 Billion |
| Market Size (2032) | USD 46.24 Billion |
| Growth Rate (2027 - 2032) | 16.73 % |
| Fastest Growing Market | Asia-Pacific |
| Largest Market | North America |
| Market Concentration | Medium |
Major Players *Disclaimer: Major Players sorted in no particular order Image © Mordor Intelligence. Reuse requires attribution under CC BY 4.0. | |
Gainshare and Value-Based Managed Services Market Analysis by Mordor Intelligence
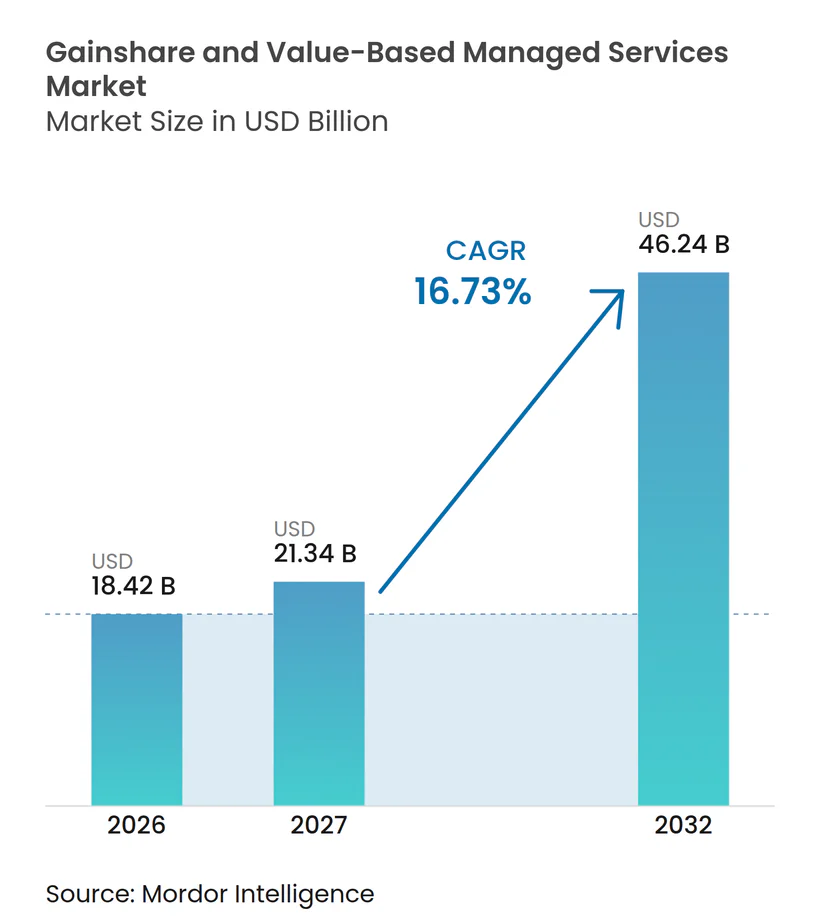
The gainshare and value-based managed services market size is projected to expand from USD 18.42 billion in 2026 to USD 21.34 billion in 2027, and to USD 46.24 billion by 2032, registering a CAGR of 16.73% between 2027 and 2032. The gainshare and value-based managed services market is growing because buyers increasingly link provider compensation to verified cost reductions, availability improvements, and operational improvements. This approach changes the commercial relationship because providers accept a larger share of delivery risk in return for a share of measurable value. Better data collection and AI-based monitoring make it easier to set baselines and track performance across connected systems. Providers with established asset data, delivery experience, and measurement platforms are better placed to win larger contracts. The gainshare and value-based managed services market also benefits from procurement programs that require measurable results in energy, service, and resilience.
Key Report Takeaways
- By service type, managed outcome services held 40.72% of the gainshare and value-based managed services market share in 2026 and are projected to grow at a 16.97% CAGR through 2032.
- By organization size, large enterprises held 77.83% of revenue in 2026, while small and medium enterprises are projected to expand at a CAGR of 17.59% through 2032.
- By technology, AI and analytics platforms accounted for 29.41% of revenue in 2026 and are projected to expand at a CAGR of 17.54% through 2032.
- By contract duration, one- to three-year contracts accounted for 48.78% of revenue in 2026, while contracts longer than 3 years are projected to expand at a CAGR of 17.03% through 2032.
- By application, manufacturing and industrial accounted for 22.04% of revenue in 2026, while healthcare and life sciences are projected to expand at a CAGR of 17.21% through 2032.
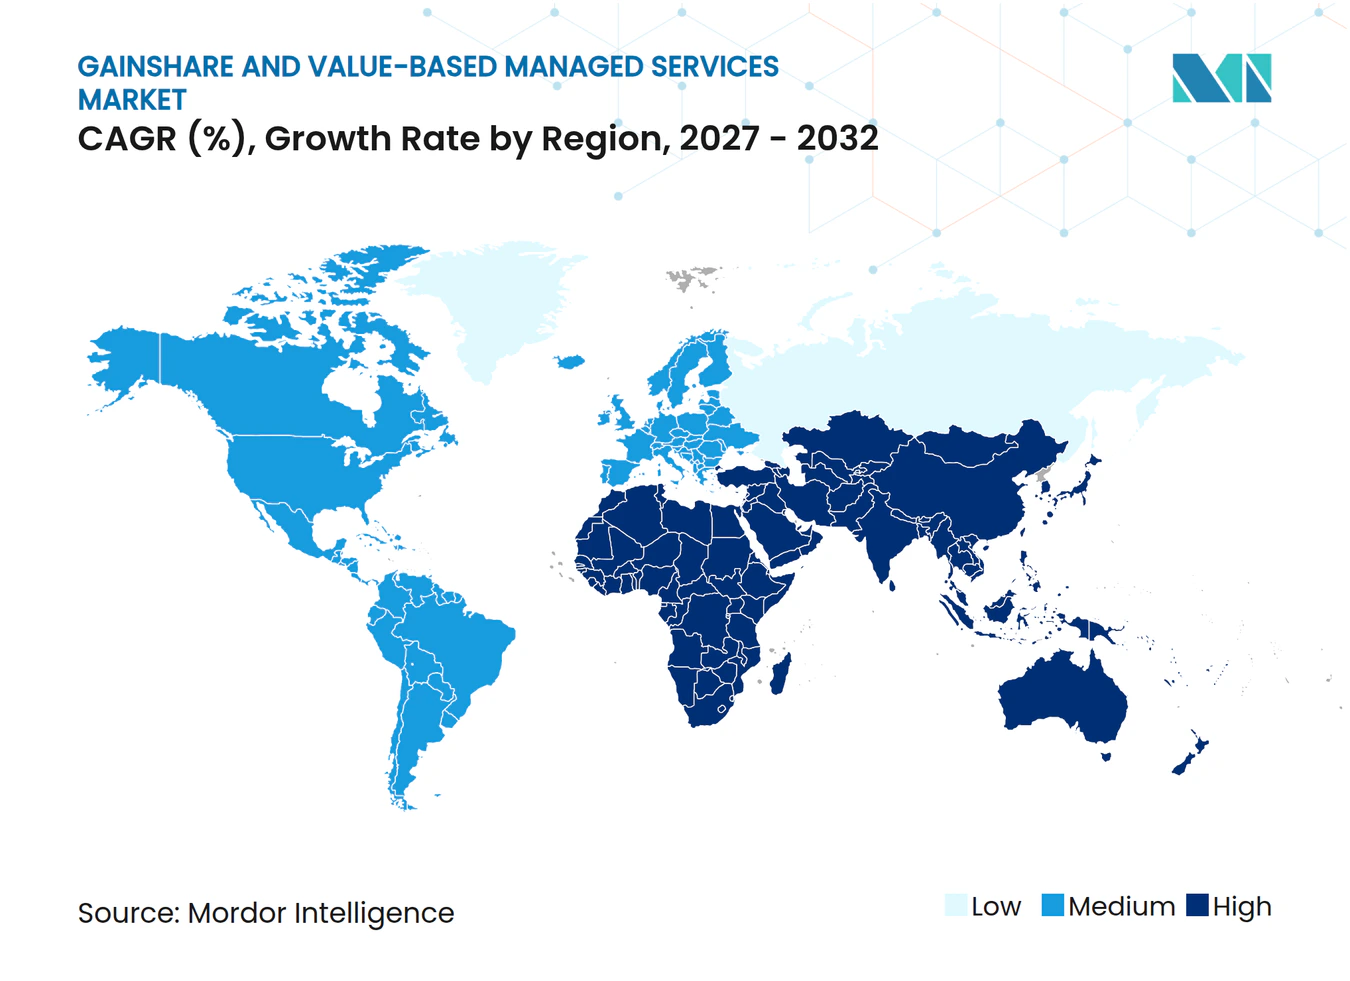
- By geography, North America held 41.93% of revenue in 2026, while Asia-Pacific is projected to expand at a CAGR of 17.43% through 2032.
Note: Market numbers in this report are based on Mordor Intelligence's proprietary estimation framework, which combines nine months of actuals with Q4 projections for base year 2026.
Market Trends and Insights
Drivers Impact Analysis of Gainshare and Value-Based Managed Services Market*
| Driver | (~) % Impact on CAGR Forecast | Geographic Relevance | Impact Timeline |
|---|---|---|---|
| Enterprise Shift Toward Operating Expense and Budget Certainty | +4.5% | Global, most pronounced in North America and Europe | Short term (≤ 2 years) |
| AI-Enabled Measurement of Business Outcomes | +3.9% | Global, with early concentration in Asia-Pacific and North America | Medium term (2-4 years) |
| Rising Demand for Operational Resilience and Uptime Guarantees | +3.3% | North America, Europe, Middle East | Short term (≤ 2 years) |
| Sustainability-Linked Procurement and Verified Resource Savings | +2.2% | Europe, North America, Asia-Pacific core with spillover to Middle East and Africa | Medium term (2-4 years) |
| Multi-Site Asset Complexity and Specialist Talent Shortages | +1.9% | Global, most acute in Asia-Pacific and South America | Medium term (2-4 years) |
| Contractual Monetization of Provider-Owned Operational Data | +1.4% | Global, with early gains in North America and Northeast Asia | Long term (≥ 4 years) |
| Source: Mordor Intelligence | |||
Enterprise Shift Toward Operating Expense and Budget Certainty
Enterprises are moving more technology spending toward recurring operating expenses, which supports contracts that avoid large upfront modernization costs. In the gainshare and value-based managed services market, a provider can fund part of an improvement program and recover value through a defined share of verified savings. This structure gives buyers a clearer view of the financial commitment while making providers responsible for credible savings models. It also underscores the importance of data governance, as both parties need a shared method for measuring the starting point and the outcome. Providers that can model savings, explain assumptions, and document performance can use this demand to build longer client relationships.
AI-Enabled Measurement of Business Outcomes
AI and analytics tools help providers connect operational data from separate systems and monitor results against agreed thresholds. The gainshare and value-based managed services market relies on this capability because the commercial model depends on defensible measurement rather than broad service promises. Kyndryl states that its Kyndryl Bridge platform integrates information from more than 100 technology partners and produces 15 million actionable insights each month, demonstrating the scale of investment providers are making in real-time service visibility.[1] These systems can identify a delivery gap earlier and support a discussion about corrective action before a contract outcome is missed. Their wider use may reduce measurement delays, although contracts still need clear rules on data access and accountability.
Rising Demand for Operational Resilience and Uptime Guarantees
Outcome-linked arrangements are particularly relevant when equipment or system downtime creates a direct safety, service, or revenue risk. Rolls-Royce uses CorporateCare agreements that link its support model to engine availability, and the company expanded coverage for additional business jet engines in September 2025. The gainshare and value-based managed services market, therefore, has a strong fit with aerospace, health care, energy, and other operating environments where performance can be verified. Such buyers are more likely to value a provider that assumes a defined share of reliability risk. The model also encourages preventive maintenance, because fewer failures can directly improve the provider’s return.
Sustainability-Linked Procurement and Verified Resource Savings
Large buyers are increasingly writing energy, emissions, and water targets into service agreements. ENGIE Solutions described a French environmental performance contract covering 68 public sites with guaranteed reductions in energy use, emissions, and water use that are monitored through digital protocols. Johnson Controls also signed a 10-year agreement with Concordia University in September 2025 that guarantees up to a 50% reduction in energy consumption. These examples show why verified resource savings can move sustainability commitments from general targets into commercial obligations. They also give providers the opportunity to combine equipment upgrades, monitoring, and ongoing operations into a single performance-linked agreement.
Restraints Impact Analysis of Gainshare and Value-Based Managed Services Market*
| Restraint | (~) % Impact on CAGR Forecast | Geographic Relevance | Impact Timeline |
|---|---|---|---|
| Outcome Attribution and Baseline Disputes | -5.1% | Global, most acute in multi-vendor engagements | Short term (≤ 2 years) |
| Legal, Accounting, and Revenue-Recognition Exposure | -4.2% | Global, especially North America and Europe | Medium term (2-4 years) |
| Provider Working-Capital and Balance-Sheet Risk | -3.3% | Global, most acute in the Asia-Pacific and South America emerging markets | Medium term (2-4 years) |
| Metric Gaming and Cross-Functional Incentive Misalignment | -2.4% | Global, concentrated in multi-stakeholder enterprise environments | Long term (≥ 4 years) |
| Source: Mordor Intelligence | |||
Outcome Attribution and Baseline Disputes
Attribution remains difficult when several vendors, internal teams, and client decisions influence the same outcome. A contract can become contentious if the parties do not agree on the baseline, the source data, or the effect of external conditions. The gainshare and value-based managed services market needs clear measurement rules before work begins, especially in multi-vendor environments. Parties are responding with tiered accountability models that distinguish primary responsibility from contributing factors. Even with stronger governance, changes in processes and AI-supported decision-making can make a provider’s specific contribution harder to isolate over time.
Legal, Accounting, and Revenue-Recognition Exposure
Variable fees can introduce accounting and reporting uncertainty for providers, particularly where payment depends on results that are measured after the work is completed. The issue can affect when revenue is recognized and how providers report expected consideration over the term of a contract. Providers often respond by retaining a fixed fee and adding a performance-based component rather than relying solely on gainshare. This reduces earnings uncertainty but can limit the share of the contract value tied to outcomes. Smaller providers may face greater challenges because they have less financial capacity to cover upfront investment or manage uneven payments.
*Our forecasts treat driver/restraint impacts as directional, not additive. The impact forecasts reflect baseline growth, mix effects, and variable interactions.
Gainshare and Value-Based Managed Services Market Segment Analysis
By Service Type:
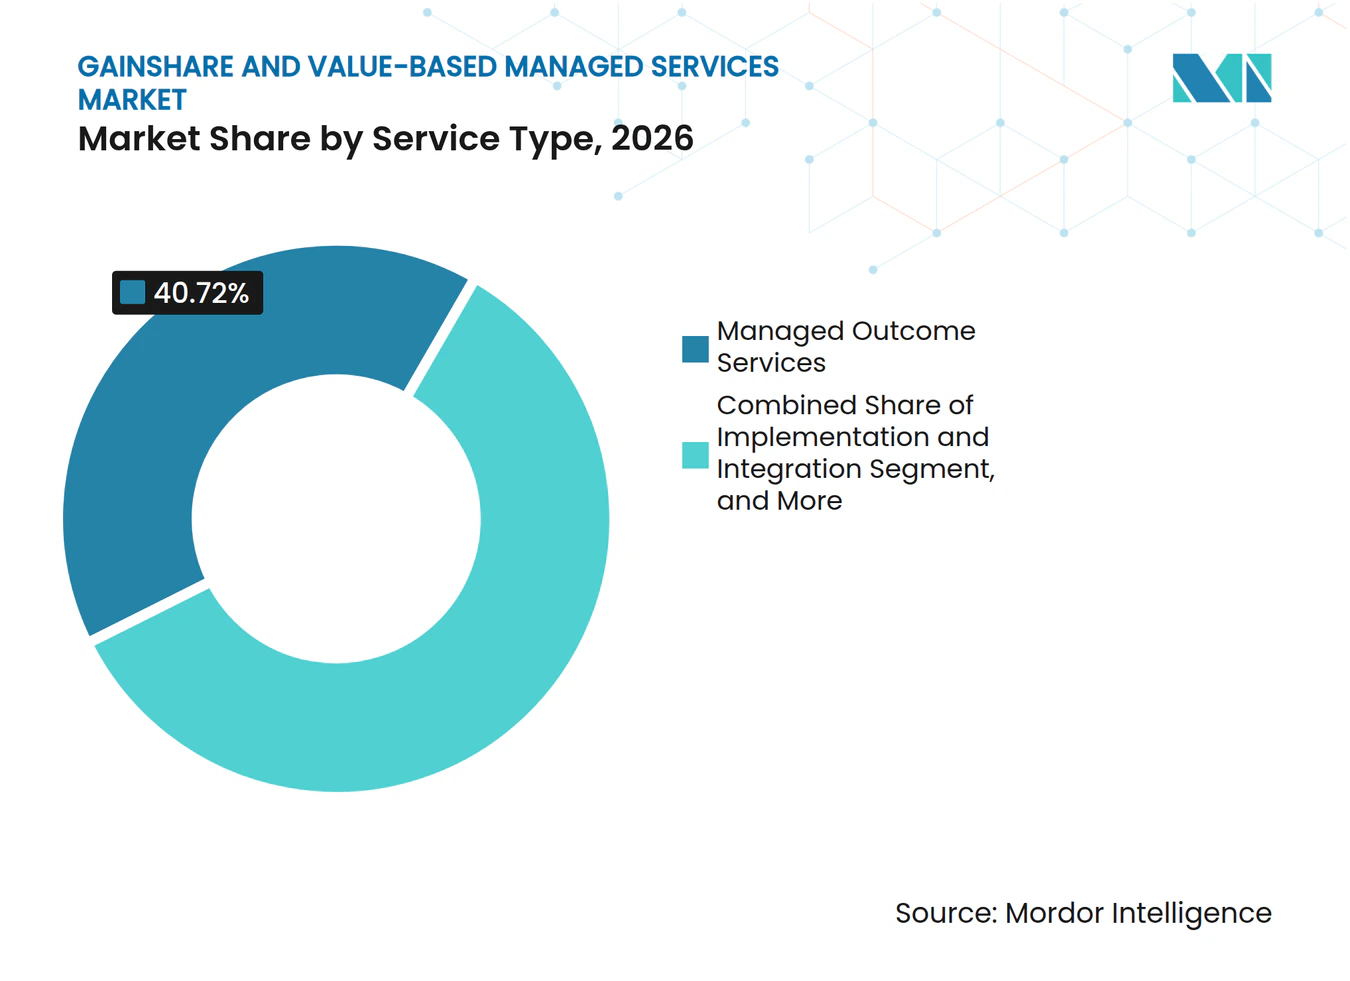
Managed Outcomes Support Single-Provider AccountabilityManaged outcome services held 40.72% of the gainshare and value-based managed services market share in 2026 and are projected to grow at a 16.97% CAGR through 2032. Buyers use this service type when they want a single party to coordinate a complex scope and accept responsibility for agreed results. The model fits environments with several connected assets or systems because the provider can link operations, monitoring, and improvement work. AI-based observability supports the approach by helping the provider see issues across service layers. It also gives clients a shared view of performance against the contract.
Advisory and consulting services remain important for buyers who are setting their first baseline or deciding how to structure an outcome-based agreement. Implementation and integration work help clients migrate legacy assets and data into systems that generate reliable operational information. Support and optimization services create recurring opportunities where providers already understand an installed base and its performance history. These services can create switching costs because a new provider must rebuild the data context and operating knowledge. The gainshare and value-based managed services industry consequently rewards service providers that combine commercial design with ongoing delivery discipline.



By Organization Size:
Large Enterprises Lead While Smaller Buyers Gain AccessLarge enterprises accounted for 77.83% of revenue in 2026 because they typically have the governance, data maturity, and vendor management resources needed for complex contracts. Their scale also allows them to test a program across multiple sites and make the required modernization investment. Caterpillar is targeting USD 28 billion in services revenue through digital capabilities by 2026, supported by connected-asset and predictive maintenance capabilities.[2] In February 2026, the company announced work with Geotab to integrate on-highway vehicle data into its VisionLink platform. This type of integrated data environment supports outcome management across mixed fleets.
Small and medium enterprises are projected to expand at a CAGR of 17.59% through 2032. Standardized platforms and reusable measurement templates can make outcome contracts more practical at smaller contract values. Managed service providers can offer defined commitments on costs, resolution time, or customer service without asking each buyer to build a full internal measurement capability. The opportunity is strongest where a provider can use repeatable workflows across similar clients. Buyers still need to assess whether the promised metrics reflect outcomes they can influence and verify.
By Technology:
AI and Analytics Platforms Connect Delivery and MeasurementAI and analytics platforms accounted for 29.41% of the gainshare and value-based managed services market size in 2026 and are projected to grow at a 17.54% CAGR through 2032. These tools support both service delivery and the evidence needed to show that a result has been achieved. They can combine data from applications, devices, workflow systems, and operations teams into a common performance view. Providers use the resulting information to identify likely failures, explain root causes, and propose changes before a service threshold is missed. This makes AI platforms central to contracts based on efficiency, uptime, and resource use.
IoT and sensor networks provide much of the machine and environmental data that analytics systems need. Woodside Energy described its industrial data fabric deployment in July 2025, which connected operational technology sensors to a central digital twin with near-real-time information flow. Cloud and edge infrastructure support the processing speed and scale needed for multi-site monitoring. Digital twins can help define expected asset performance and test a proposed intervention before it is committed to a contract. Process mining and workflow automation also help providers identify inefficiency that may be converted into a measurable improvement target.
By Contract Duration:
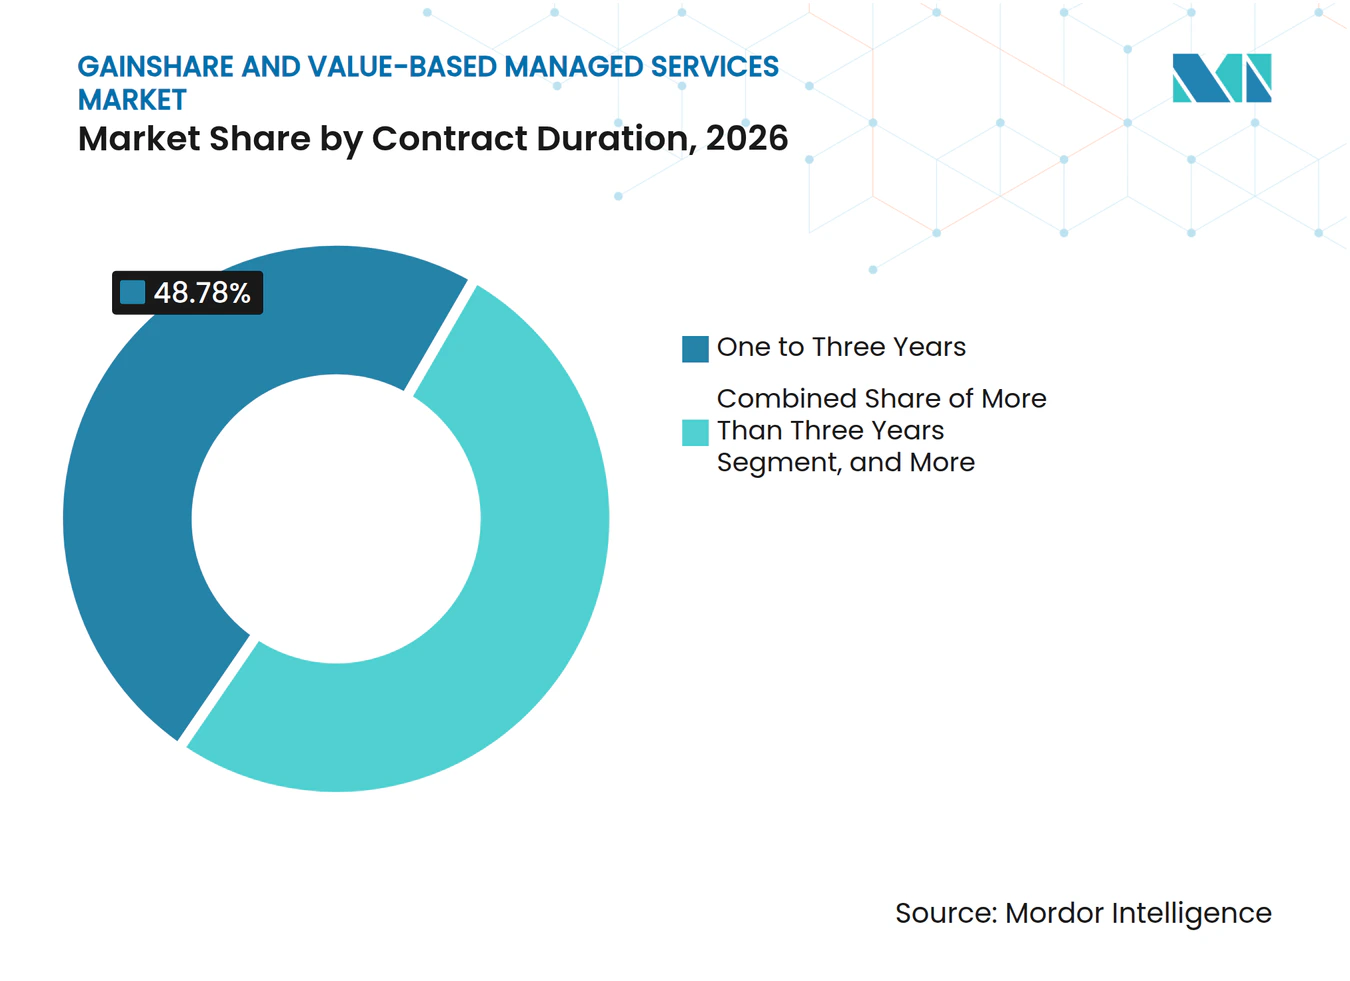
Mid-Term Agreements Balance Proof and FlexibilityOne- to three-year contracts accounted for 48.78% of revenue in 2026. This duration gives providers time to deliver modernization work and demonstrate sustained results, while buyers maintain a clear renewal point. It also fits many AI-led transformation programs, where measurable productivity benefits can emerge within 18 to 30 months. Providers can use the initial term to establish trust in the baseline and reporting approach. Buyers can use it to evaluate whether the provider’s operating model works in their environment.
Contracts lasting more than 3 years are projected to expand at a CAGR of 17.03% through 2032. Longer agreements become more practical after both parties have confidence in the metrics and the provider’s ability to manage risk. Rolls-Royce has built long-term support models around engine availability and flying hours, giving it a direct incentive to improve maintenance and parts performance. Shorter contracts can serve as structured pilots before a client accepts a broader commitment. The gainshare and value-based managed services market can therefore use contract length as a practical way to match commercial exposure with measurement maturity.

By Application:
Industrial Operations Lead While Health Care ExpandsManufacturing and industrial accounted for 22.04% of the gainshare and value-based managed services market share in 2026. Asset-heavy businesses hold extensive operational data on uptime, throughput, maintenance, and energy use, which creates a practical foundation for performance-linked services. Siemens, Caterpillar, Honeywell, and similar providers can use equipment knowledge and data history to define measurable commitments. Accenture and Siemens announced a business group in March 2025, which was planned to include 7,000 professionals working on engineering, manufacturing, security, and AI-based automation services. The combination of industrial software, service delivery, and after-sales support can make shared-outcome structures workable across factory environments.
Healthcare and life sciences are projected to expand at a CAGR of 17.21% through 2032. The application benefits from the growing use of value-based reimbursement and the need to demonstrate clinical and financial results. Omada Health reported USD 260 million in full-year 2025 revenue and 886,000 members in March 2026, reflecting the scale to which outcome-based virtual care can grow. Energy and utilities also offer an active use case, particularly for contracts tied to energy performance and infrastructure efficiency. Information technology, telecommunications, financial services, transportation, retail, agriculture, buildings, facilities, and public services have different levels of readiness based on their data quality and payment incentives.
Geography Analysis
North America Gainshare and Value-Based Managed Services Market
North America held 41.93% of the gainshare and value-based managed services market size in 2026. The United States has a large base of enterprise buyers, experienced providers, and established contract frameworks that link payment to performance. The region also has substantial demand from health care, technology, energy, and industrial operations. Canada contributes through energy performance contracts, while Mexico supports demand for industrial asset management. These conditions give North American buyers and providers a relatively mature base for performance-linked service models.
APAC Gainshare and Value-Based Managed Services Market
Asia-Pacific is projected to expand at a CAGR of 17.43% through 2032. The region combines demand for enterprise modernization with growing capabilities in cloud, AI, and managed services. India contributes as both a large buyer base and the home of major services providers, including TCS, Infosys, Wipro, and HCLTech. Japan and South Korea are applying outcome-linked approaches to enterprise technology modernization. FPT Software Korea offers managed services focused on results such as IT cost reduction and productivity improvement, illustrating a regional focus on measurable operating outcomes.
EMEA and South America Gainshare and Value-Based Managed Services Market
Europe has meaningful adoption in manufacturing, financial services, and public-sector programs, with Germany, the United Kingdom, and France as important markets. ENGIE’s environmental performance contract in France shows how public procurement can extend outcome agreements beyond core IT services.[3] South America, the Middle East, and Africa are earlier-stage areas where energy performance and infrastructure needs are creating entry points. Saudi Arabia and the United Arab Emirates are using performance-linked services in infrastructure programs. South Africa and Nigeria offer potential demand where skills gaps and energy access needs make verified performance commitments more relevant.
Competitive Landscape
Market Concentration
The gainshare and value-based managed services market brings together large IT services firms and industrial specialists with long-established asset data. Accenture, TCS, Kyndryl, Capgemini, and Infosys compete for enterprise technology contracts, while Rolls-Royce, Siemens, Johnson Controls, Honeywell, and Ameresco compete in asset-intensive settings. The IT services group generally focuses on AI-based observability, operating transformation, and commercial models that connect service fees to client metrics. Industrial specialists draw on equipment knowledge, maintenance records, and installed-base data to support availability and efficiency commitments. This creates two distinct but overlapping paths to a stronger competitive position.
Kyndryl’s platform strategy illustrates a technology services approach, as Kyndryl Bridge connects data from more than 100 partners and provides a large volume of operational insights. Rolls-Royce continues to widen its CorporateCare offering for business aviation engines, reinforcing a service model linked to asset availability. Johnson Controls has used a 10-year, performance-guaranteed agreement with Concordia University to apply its facilities capabilities to reduce energy use.[4] These moves show that leading providers combine data, implementation capability, and a willingness to accept selected operating risk. They also demonstrate why buyers will assess a provider’s measurement approach as closely as its technical capability.
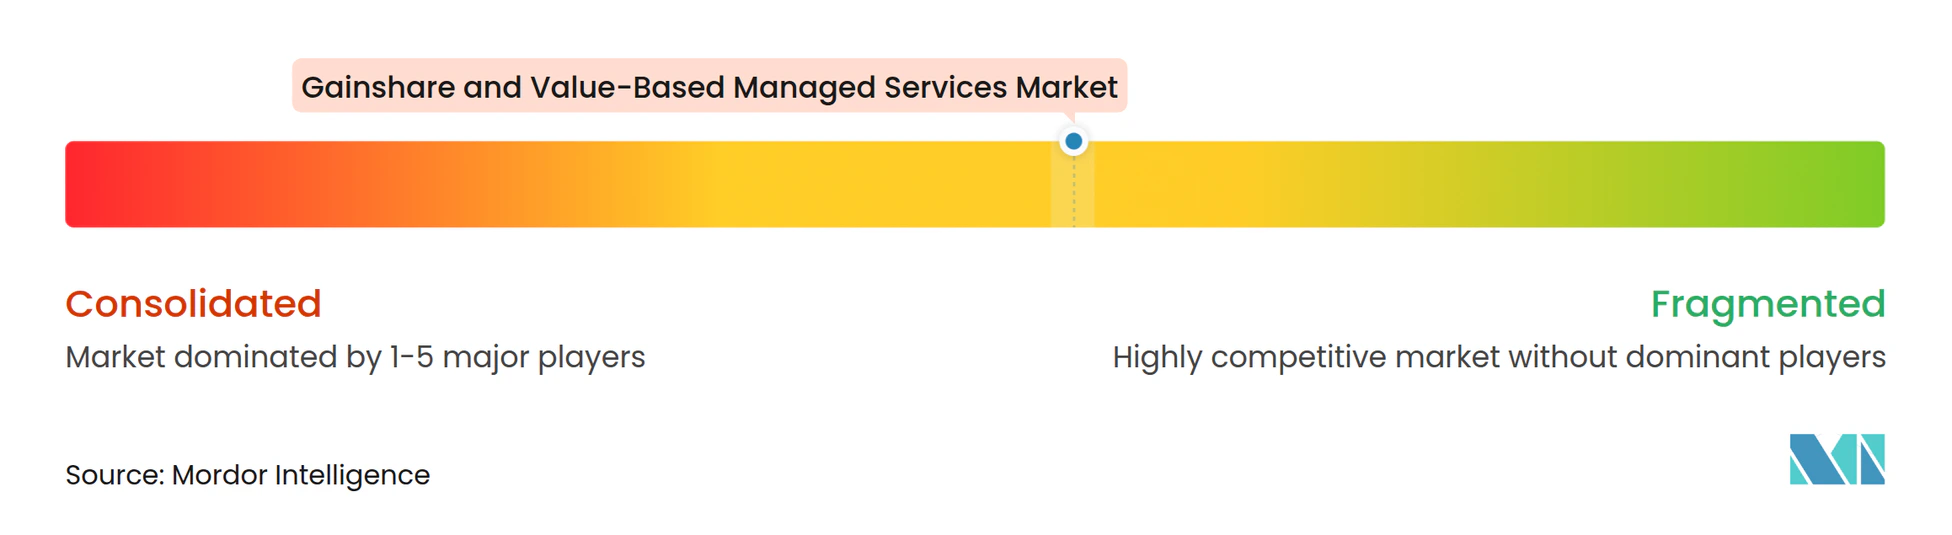
Opportunities remain among mid-market buyers that need advisory support before committing to a fully outcome-linked agreement. Agriculture, transportation, and public infrastructure also provide room for sustainability-focused performance contracts as data collection improves. Multi-vendor coordination is another opening because many enterprise technology estates are too diverse for one provider to manage alone. AI-native firms such as DataRobot, C3.ai, and UptimeAI seek to build measurement and prediction capabilities from the data layer, while ServiceMax supports industrial field-service operations. The gainshare and value-based managed services market is moderately concentrated at the leading end but remains fragmented among specialists and vertical providers.
Gainshare and Value-Based Managed Services Industry Leaders
-
Rolls-Royce plc
-
Schneider Electric SE
-
Siemens AG
-
International Business Machines Corporation
-
Signify N.V.
- *Disclaimer: Major Players sorted in no particular order
Gainshare and Value-Based Managed Services Market Companies Covered in this Report
- Rolls-Royce plc
- Schneider Electric SE
- Siemens AG
- International Business Machines Corporation
- Signify N.V.
- ValueLabs LLP
- Capgemini SE
- Accenture plc
- Tata Consultancy Services Limited
- Infosys Limited
- Wipro Limited
- Cognizant Technology Solutions Corporation
- HCLTech Limited
- Kyndryl Holdings, Inc.
- NTT DATA Group Corporation
- Fujitsu Limited
- Honeywell International Inc.
- Johnson Controls International plc
- Compagnie Générale des Établissements Michelin SCA
- Caterpillar Inc.
- GE Digital LLC
- ServiceMax, Inc.
- DataRobot, Inc.
- C3.ai, Inc.
- UptimeAI Inc.
- Omada Health, Inc.
- Indigo Ag, Inc.
- Zipline International Inc.
- Ameresco, Inc.
- ENGIE SA
- Veolia Environnement S.A.
Recent Industry Developments in Gainshare and Value-Based Managed Services Market
- May 2026: Omada Health joined Eli Lilly's Employer Connect program as an independent program administrator, allowing employers to access GLP-1 care with a predictable cost structure and coordinated lifestyle support, extending Omada's outcome-based healthcare contracting model into a new direct-to-employer distribution channel.
- February 2026: Caterpillar announced a collaboration with Geotab Inc. to integrate on-highway vehicle data into its VisionLink platform, creating a unified outcome management interface covering Cat and non-Cat off-highway assets alongside on-highway vehicles, in support of its goal of reaching USD 28 billion in services revenue through digital capabilities.
- September 2026: Rolls-Royce expanded the terms of its CorporateCare agreement for business jet engine operators, extending coverage to a broader range of turbofans used on new models including the Gulfstream G700 and G800, deepening its power-by-the-hour outcome model across the business aviation fleet.
- March 2025: Accenture and Siemens announced the Accenture Siemens Business Group at Hannover Messe, a dedicated business practice planned to encompass 7,000 professionals delivering managed security services, AI-powered shopfloor automation, and after-sales service for manufacturing and industrial clients under outcome-aligned commercial terms.
Global Gainshare and Value-Based Managed Services Market Report Scope
The Gainshare and Value-Based Managed Services Market refers to the market for outsourced service arrangements in which providers and clients share financial benefits generated through measurable improvements in operational performance, cost efficiency, revenue growth, or business outcomes.
The Gainshare and Value-Based Managed Services Market Report is Segmented by Service Type (Advisory and Consulting, Implementation and Integration, Managed Outcome Services, and Support and Optimization), Organization Size (Large Enterprises and Small and Medium Enterprises), Technology (AI and Analytics Platforms, IoT and Sensor Networks, Cloud and Edge Infrastructure, Digital Twin and Simulation Platforms, and Process Mining and Workflow Automation), Contract Duration (Less Than One Year, One to Three Years, and More Than Three Years), Application (Information Technology and Telecommunications, Healthcare and Life Sciences, Manufacturing and Industrial, Energy and Utilities, BFSI, Retail and E-Commerce, and Other Applications), and Geography (North America, South America, Europe, Asia-Pacific, Middle East, and Africa). The Market Forecasts are Provided in Terms of Value (USD).
Segmentation Overview
| Advisory and Consulting |
| Implementation and Integration |
| Managed Outcome Services |
| Support and Optimization |
| Large Enterprises |
| Small and Medium Enterprises |
| AI and Analytics Platforms |
| IoT and Sensor Networks |
| Cloud and Edge Infrastructure |
| Digital Twin and Simulation Platforms |
| Process Mining and Workflow Automation |
| Less Than One Year |
| One to Three Years |
| More Than Three Years |
| Information Technology and Telecommunications |
| Healthcare and Life Sciences |
| Manufacturing and Industrial |
| Energy and Utilities |
| BFSI |
| Retail and E-Commerce |
| Other Applications |
| North America | United States |
| Canada | |
| Mexico | |
| South America | Brazil |
| Argentina | |
| Rest of South America | |
| Europe | Germany |
| United Kingdom | |
| France | |
| Italy | |
| Spain | |
| Russia | |
| Rest of Europe | |
| Asia-Pacific | China |
| India | |
| Japan | |
| South Korea | |
| Australia | |
| Rest of Asia-Pacific | |
| Middle East | Saudi Arabia |
| United Arab Emirates | |
| Turkey | |
| Rest of Middle East | |
| Africa | South Africa |
| Egypt | |
| Nigeria | |
| Rest of Africa |
| By Service Type | Advisory and Consulting | |
| Implementation and Integration | ||
| Managed Outcome Services | ||
| Support and Optimization | ||
| By Organization Size | Large Enterprises | |
| Small and Medium Enterprises | ||
| By Technology | AI and Analytics Platforms | |
| IoT and Sensor Networks | ||
| Cloud and Edge Infrastructure | ||
| Digital Twin and Simulation Platforms | ||
| Process Mining and Workflow Automation | ||
| By Contract Duration | Less Than One Year | |
| One to Three Years | ||
| More Than Three Years | ||
| By Application | Information Technology and Telecommunications | |
| Healthcare and Life Sciences | ||
| Manufacturing and Industrial | ||
| Energy and Utilities | ||
| BFSI | ||
| Retail and E-Commerce | ||
| Other Applications | ||
| By Geography | North America | United States |
| Canada | ||
| Mexico | ||
| South America | Brazil | |
| Argentina | ||
| Rest of South America | ||
| Europe | Germany | |
| United Kingdom | ||
| France | ||
| Italy | ||
| Spain | ||
| Russia | ||
| Rest of Europe | ||
| Asia-Pacific | China | |
| India | ||
| Japan | ||
| South Korea | ||
| Australia | ||
| Rest of Asia-Pacific | ||
| Middle East | Saudi Arabia | |
| United Arab Emirates | ||
| Turkey | ||
| Rest of Middle East | ||
| Africa | South Africa | |
| Egypt | ||
| Nigeria | ||
| Rest of Africa | ||
Key Questions Answered in the Report
What is the size of the gainshare and value-based managed services market?
The gainshare and value-based managed services market size is USD 18.42 billion in 2026 and is projected to reach USD 46.24 billion by 2032 at a 16.73% CAGR. The expansion reflects buyer demand for payment models that connect service fees with measurable savings, availability, and operating improvements.
What is driving demand for gainshare and value-based managed services?
The gainshare and value-based managed services market is supported by operating budget discipline, AI-enabled measurement, resilience requirements, and verified resource savings. Buyers use these structures to share performance risk with providers when the result and the data needed to verify it can be defined in advance.
Which service type leads demand?
Managed outcome services lead with a 40.72% share in 2026 and are projected to grow at a 16.97% CAGR through 2032. They appeal to buyers seeking a single provider that can coordinate operations, monitoring, improvement actions, and responsibility for the agreed service result.
Which technology supports outcome-based managed services?
AI and analytics platforms support performance measurement, prediction, and reporting. They held a 29.41% share in 2026 because the gainshare and value-based managed services market requires evidence linking provider actions to documented results across applications, workflows, and connected assets.
Which region is growing fastest?
Asia-Pacific is projected to grow at a 17.43% CAGR through 2032, supported by modernization and AI adoption. The gainshare and value-based managed services market in the region also benefits from a large technology services base, increasing cloud use, and enterprise demand for repeatable management models.
What is the main challenge in outcome-linked contracts?
Parties must agree on baselines, attribution, and data sources before payment can be tied to measured results. This is more difficult when internal teams, separate providers, client decisions, and outside operating conditions all affect the same target.